
Modern Tactile Maps In Special Education


Abstract
The majority of information has a spatial context that can be represented on a map. For people with visual impairments, using a map as a representation of a real spatial context is not only a possibility but also a necessity. At the Department of Geoinformatics, Faculty of Science, Palacký University Olomouc, Czech Republic, the research team has developed prototypes and methodology for the creation of a modern type of 3D tactile maps, linkable with mobile devices. The prototypes have been verified in practice in cooperation with educational centres for people with visual impairment and blind people, and in special schools. It is comprehensive research focusing on a number of scientific challenges. The implementation of newly created tactile maps into the process of education of people with visual impairment was realized thanks to the active cooperation of experts from the Institute of Special Education Studies, experts from the Department of Geoinformatics, Palacký University Olomouc, Czech Republic, educators from many special education centres, and teachers from special schools. The development of prototypes was possible thanks to cooperation with the target respondents (people with visual impairments) and their willingness to evaluate maps, to evaluate the use of tactile maps in training, and their readiness to cooperate on modifying the proposed prototypes through the user testing.
Keywords: Tactile mapsspecial educationvisual impairment3D technology
Introduction
Education responds to the current state of knowledge in the world. It is the process of facilitating learning, or the acquisition of knowledge, skills, values, beliefs, and habits. It is about sharing knowledge with individuals. With new knowledge, the curriculum and didactic methodologies are changing. This also applies to the field of special education. However, this is not only about new knowledge, but above all about new technologies which bring new possibilities to the field of special education.
The aim of this contribution is to present the joint research conducted at the Institute of Special Education Studies and the Department of Geoinformatics, Palacký University Olomouc, Czech Republic. Among other issues, a new type of tactile map has been developed, using the most advanced 3D printing options. The research includes the concept of creating tactile maps, testing them with users, and the use of modern, tactile cartography in different levels of education, including long-life education (Vondráková & Růžičková, 2018).
Education of people with visual impairment
The number of people with visual impairment increases every year, and great attention is paid to their full-fledged integration into society. Persons with visual impairment are those who have difficulties in their everyday activities caused by visual impairment, even after the maximum possible pharmacological, surgical, or optical correction.
Special pedagogy categorizes people with visual impairment according to several criteria that form a coherent picture as a fundamental basis for the needs of educational system (Voženílek, Michalík, Vondráková, & Brychtová, 2014). In contrast, the medical definition works primarily with defining degrees of visual impairment based on a visa or levels of spatial vision, or visual field status (Růžičková, Kroupová, & Kramostilová, 2016). The most classical division is then among people with blindness, with visual impairment, and possibly binocular vision disorder (Růžičková, 2018).
Many countries are actively trying to integrate people with disabilities into society, while the inclusive tendencies predominate. An essential part of this process is progressive special education using all available means. An example of modern teaching aids is tactile maps using smart devices (especially touch tablets).
Tactile cartography
The majority of information has a spatial context that can be represented on a map (Vondráková, 2013). For people with visual impairment, utilising maps is not only a possibility but also a necessity to understand the spatial nature of the information. However, conventional maps are insufficient for these users (Voženílek & Vondráková, 2014).
Tactile cartography focuses on the creation of maps and other visualizations of spatial data, specially made for perception by touch. In its nature, tactile cartography is mainly related to geography and computer science but it is also essential to cooperate with experts on the appropriate pedagogy and didactics.
Tactile perception may partially compensate for visual perception by means of the cognition of the surrounding world using tactile maps (Litvak, 1979). Cartographically developed countries provide to their citizens with visual impairment a wide range of publications focusing on geographic information, including high quality equivalents of national atlases, and the latest trend is a modern type of 3D tactile maps (Barvir, Vondrakova, & Ruzickova 2018). Nevertheless, non-profit organizations and universities do most of the tactile map production because the purchasing power of this target group is not enough for commercial companies.
Problem Statement
For centuries, tactile maps have been an essential part of the education of people with visual impairment. Early modern tactile maps in special education (the second half of the 20th century) were mostly made of heavy paper and were used for the training of spatial orientation and independent motion of blind people in their everyday life. Later production of tactile maps was based on using the technology of thermo-vacuum foil and other available technologies, such as gypsum or plastic castings (Vondrakova, Barvir, Vozenilek, & Brus, 2018).
Tactile maps can be divided into several types according to interactivity, purpose, technology, etc. Raised and depressed surfaces are used to indicate spatial phenomena. The content of maps and their form must also be relevant to the level of education: children, adults, people with combined disabilities (for example visual impairment combined with mental disabilities), and users who have experience using any tactile maps previously—each group may have different requirements.
The design and creation of proper tactile maps is a task for cartographers, while the education of the target group of users is a task for teachers or staff of special education centres. Only cooperation between these two groups of experts can lead to the efficient education of people with visual impairment using tactile maps.
Within the project
Research Questions
The area of spatial orientation and independent movement is one of the most significant and probably also most frequently mentioned consequences of severe visual impairment. In the years 2017–2018 a survey was performed which aimed to penetrate deeper into the issue; all respondents were contacted by the researchers from the Institute of Special Education Studies, Palacký University Olomouc, Czech Republic. The purpose of the survey was the exploration and description of selected aspects of spatial orientation and independent movement from the point of view of the actors themselves – people with severe visual impairment and interested professionals.
Based on the survey and research findings, and in cooperation with experts from the Department of Geoinformatics, Palacký University Olomouc, Czech Republic, a project proposal, “
Purpose of the Study
The proper teaching aids, such as the modern tactile maps presented here, can significantly simplify the process of acquiring spatial information by people with visual impairment. Spatial orientation and knowledge of spatial information are crucial for people with visual impairments not only because of the general education and understanding of fundamental processes in life and the world but mainly because of quality of life improvements that can be brought about by enabling independent movement through space. Independent walking (movement) training is an integral part of the lives of individuals with a severe visual impairment from early childhood to senior age (Wiener, 2006).
For better understanding of the learning and teaching processes in (tactile) cartography, it is highly recommended to study widely acclaimed publications such as Learning and Teaching with Maps (Wiegand, 2006), papers from the Journal of Visual Impairment & Blindness, papers from cartographic journals, and papers focusing the psychology of education of people with visual impairment (Vondráková & Růžičková, 2018).
The main aim of the presented research was to develop modern multi-media tactile maps based on the knowledge of the latest 3D printing techniques and based on the research outcomes dealing with the needs and preferences of people with visual impairment. User issues are very important in the process of map production (Vondráková, 2016; Brychtova, Popelka, & Dobesova 2012). The tactile maps have been subjected to user testing, and the final prototypes were created focusing on acquired knowledge. The current phase of research is implementation into special education in the form of various didactic procedures.
Research Methods
There are many kinds of research focusing on the theoretical part of tactile cartography, such as cartographic communication, tactile graphics, semantics, symbology in a tactile map, and also on the mechanical issues, such as printing technologies. However, there are just a few papers focusing on user studies with people with visual impairment and focusing on this particular part of special education.
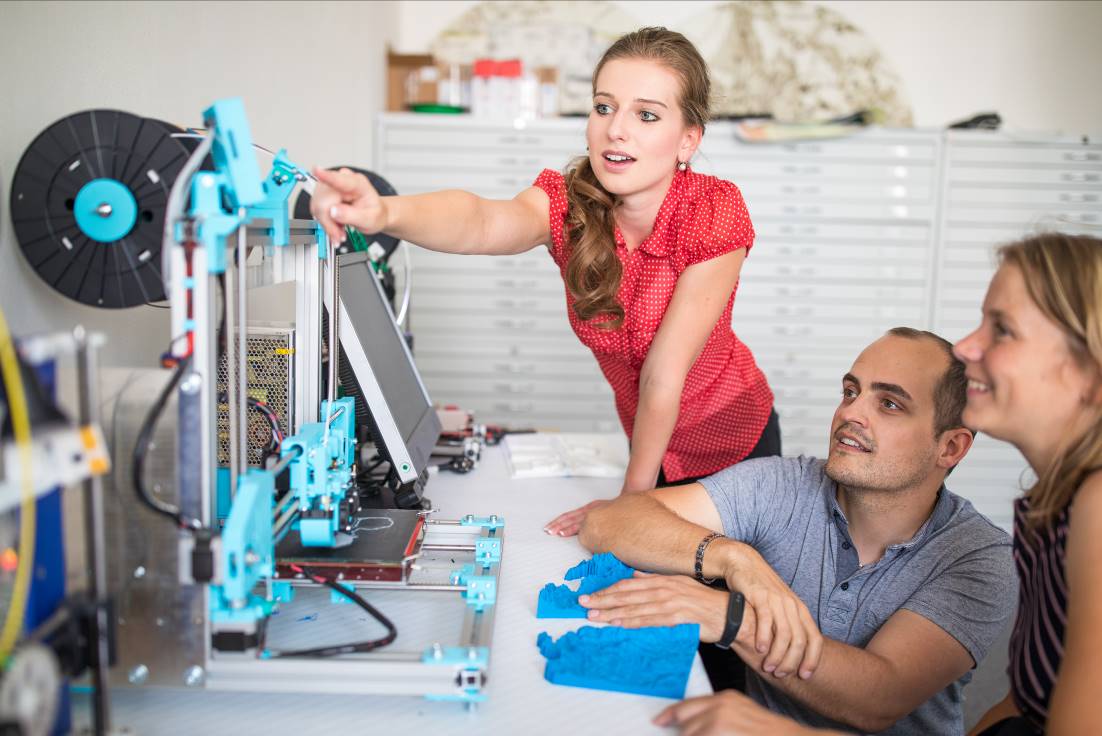
The primary research methods used include working with the target group of users, focusing on their needs and preferences. Subsequently, extensive interviews were conducted with educators involved in the education of persons with visual impairments and in the training of the independent movement of these persons. In parallel, research in the field of tactile cartography was conducted. Synthesis of the acquired knowledge enabled the design of new tactile maps. After extensive user testing and incorporating comments and changes, these maps are implemented in the education of people with visual impairments. The last phase of the project is also the study and design of specific didactic procedures within the education process.
Findings
The main reason to use tactile maps in the education of people with visual impairments is that they are inherently unable to understand the characteristics of space and spatial characteristics in any other way. The spoken word does not sufficiently replace the perception of the metric properties of space.
Modern type of tactile maps
Creating a tactile map for people with visual impairment and blind people is conceptually different and more complicated compared to normal map creation. Modern technologies bring new possibilities to the process of map design and map creation. Therefore, cartographers focus on the question of how spatial information can be effectively presented to people with visual impairment using available information technologies. One of the solutions is to link the 3D tactile-cartography to mobile devices such as smartphones and tablets. The modern mobile /technologies with the internet connection and GNSS (Global Navigation Satellite Systems) navigation have brought new possibilities on how to quickly convert spatial information into voice.
During the implementation of the project
TouchIt3D technology
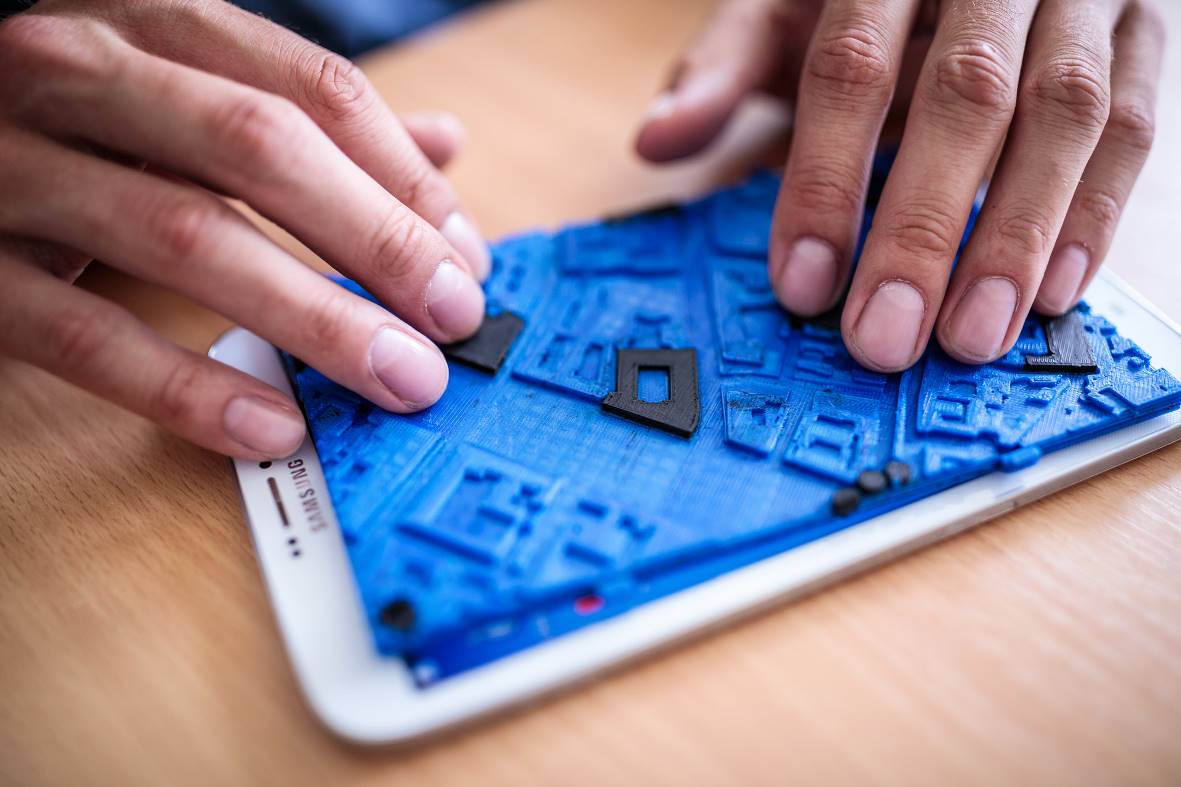
The developed TouchIt3D technology is based on linking 3D objects, such as tactile maps, 3D models, controls, etc., with a mobile tablet or mobile phone using a combination of conductive and non-conductive filament. Each model is linked to an individual mobile application layout that initiates a pre-action based on user suggestions made while touching the model. Data can be acquired in real-time via the Internet as the tablet can be connected to WiFi or a cellular network.
TouchIt3D technology is primarily focused on the presentation of spatial data and navigation for people with visual or other impairments, and can be used for the general public as well. There are two ways how to create TouchIt3D tactile map. The first way is to prepare all the data manually. Another approach is the semi-automatic workflow. This approach is significantly different from previous workflows of producing maps for people with visual impairment. A solution based on open-source and free software and data together with sharing the electronic part of the map in the form of a tablet dramatically lowered costs of tactile maps production. The designed scripts and models also reduced the time necessary to spend on map design to a minimum.
User testing provided all data required for the improvement, and maximal adaptation of the cartographic visualisation methods to the target user needs. Nevertheless, maps which are partly automatically done and based on crowdsourced data cannot bring the same quality as individually made tactile maps.
The main aim of the research was to find a workflow for interactive tactile maps created using TouchIt3D technology. The research also dealt with setting appropriate parameters of the map, e.g. the map scale, cartographic symbol size, map content etc. This optimisation is done to fit the needs of people with visual impairment as much as possible on the one hand and taking into account the limitations of the possibilities of map creation (Figure
Implementation in special education
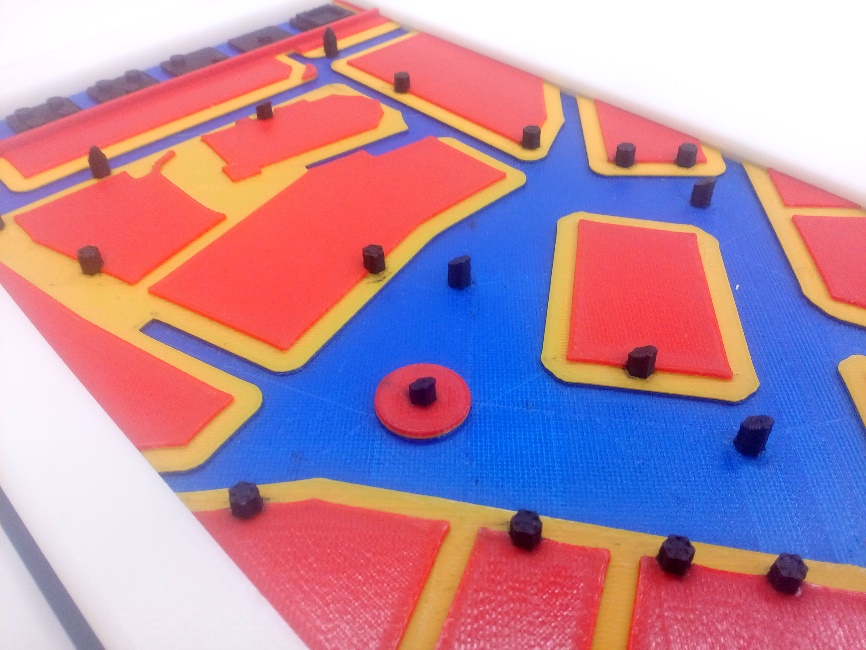
The proposed maps can be divided according to their purpose, into maps which are intended for independent movement training of people with visual impairments, and maps which are intended for general education and gaining specific information about space.
The maps are in multiple colours because the majority of people with visual impairments have some remnants of vision and therefore see different areas. The design in contrasting colours, therefore, allows them to engage another sense, not just touch (and hearing for multimedia elements).
The first type of map (Figure
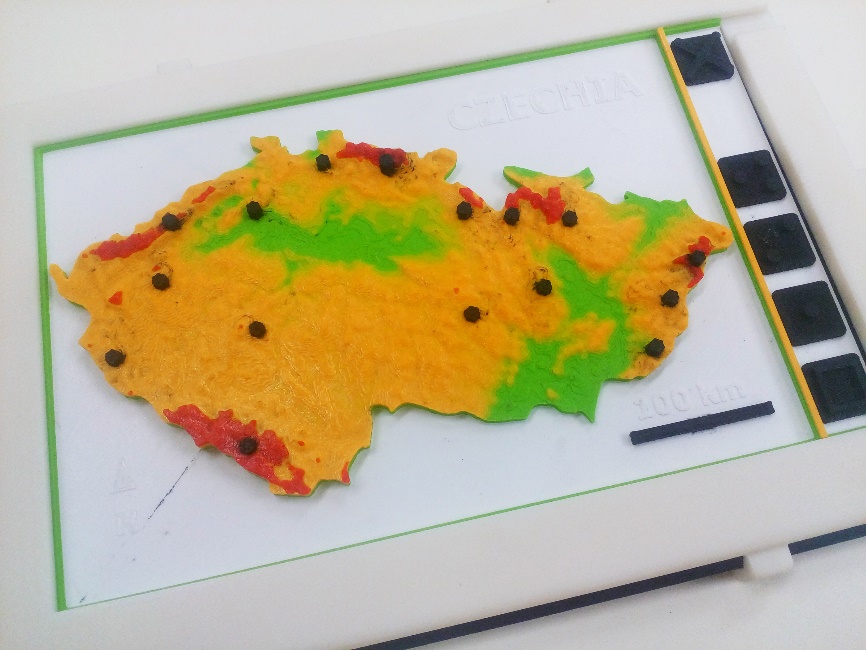
The second type of map is used for a general presentation of space and can be used for any topic where it is possible to use a map. An example is an altitude map of the Czech Republic (Figure
TouchIt3D tactile maps use special software (TactileMapTalk) that is installed on the tablet.
Currently, a tool is being developed to enable individual teachers to create audio content for the prepared maps.
Conclusion
The majority of information has a spatial context that can be represented on a map. For some kinds of users, in particular those with visual impairments, using a map as a representation of real spatial context is not only a possibility but a necessity.
At the Department of Geoinformatics, Faculty of Science, Palacký University Olomouc, Czech Republic, the research team developed prototypes and methodology for the creation of 3D tactile maps of a modernt type, linkable with mobile devices.
Interactive tactile maps connectable with mobile devices bring new opportunities to develop tactile map production. The prototypes have been verified in practice in cooperation with educational centres for people with visual impairment and blind people, and with special schools. It is comprehensive research focusing on numerous scientific challenges. Individual parts of the presented research, such as user testing, a detailed description of technological processes during tactile map creation, etc. are published by the author's team as the results are achieved and verified, and links are also available at the website
The implementation of newly created tactile maps into the process of education of people with visual impairment was realized thanks to the active cooperation of experts from the Institute of Special Education Studies, experts from the Department of Geoinformatics, Palacký University Olomouc, Czech Republic, educators from many special education centres, and teachers from special schools. Last but not least, it was possible thanks to the enthusiasm of the target respondents (people with visual impairments) and their willingness to evaluate maps, to evaluate the use of tactile maps in training, and their readiness to cooperate on modifying the proposed prototypes through further user testing.
Acknowledgments
The paper was realized with the support of project
References
- Barvir, R., Vondrakova, A., & Ruzickova, V. (2018). Graphics Complexity of Tactile Maps and User Study. International Multidisciplinary Scientific GeoConference: SGEM: Surveying Geology & mining Ecology Management, 18, 433-440.
- Brychtova, A., Popelka, S., & Dobesova, Z. (2012). Eye-tracking methods for investigation of cartographic principles. SGEM 2012 Conference Proceedings, 2, 1041-1048.
- Litvak, A. G. (1979). Nástin psychologie nevidomých a slabozrakých. [An outline of the psychology of the blind and partially sighted] Praha: SPN.
- Růžičková, V., Kroupová, K., & Kramostilová, Z. (2016). Zrakový trénink a jeho podmínky. [Visual training and its conditions]. Czech Republic: Palacký University Olomouc.
- Růžičková, V. (2018). Counselling for People with Visual Impairment in the Czech Republic (254 – 260) in 4th International Conference on Lifelong Education and Leadership for all, ICLEL 2018, Conference proceeding Book. Sakarya: Sakarya University Faculty of Education.
- Vondráková, A., & Růžičková, V. (2018). The Importance of User Issues in the Cartographic Education of People with Visual Impairment (s. 250 – 253) in 4th International Conference on Lifelong Education and Leadership for all, ICLEL 2018, Conference proceeding Book. Sakarya: Sakarya University Faculty of Education.
- Vondráková, A. (2013). Non-technological aspects of map production. SGEM2013 Conference Proceedings, 1, 813-820.
- Vondrakova, A. (2016). User Issues in Geovisualization. 6th International Multidisciplinary Scientific GeoConference SGEM 2016, www.sgem.org, SGEM2016 Conference Proceedings, June 28 - July 6, 2016, Book 2,3, 599-606.
- Vondrakova, A., Barvir, R., Vozenilek, V., & Brus, J. (2018). The Use of Modern Technologies. The Geospace 3d Visualization. International Multidisciplinary Scientific GeoConference: SGEM: Surveying Geology & mining Ecology Management, 18, 681-688.
- Voženílek, V., Michalík, J., Vondráková, A., & Brychtová, A. (2014). Mapping and visualisation of activities in special education. Procedia-Social and Behavioral Sciences, 112, 1106-1120.
- Voženílek, V., & Vondráková, A. (2014). Tactile Maps Based on 3D Printing Technology. In Proceeding of the International Scientifical Conference May 23th–24th (Vol. 3).
- Wiener, P. (2006). Prostorová orientace zrakově postižených. [Spatial orientation of the visually impaired] (3rd ed.). Praha: Institut rehabilitace zrakově postižených UK FHS, 2006. Czech Republic.
Copyright information

This work is licensed under a Creative Commons Attribution-NonCommercial-NoDerivatives 4.0 International License.
About this article
Publication Date
07 November 2019
Article Doi
eBook ISBN
978-1-80296-071-6
Publisher
Future Academy
Volume
72
Print ISBN (optional)
-
Edition Number
1st Edition
Pages
1-794
Subjects
Psychology, educational psychology, counseling psychology
Cite this article as:
Vondráková, A., Barvíř, R., & Brus, J. (2019). Modern Tactile Maps In Special Education. In P. Besedová, N. Heinrichová, & J. Ondráková (Eds.), ICEEPSY 2019: Education and Educational Psychology, vol 72. European Proceedings of Social and Behavioural Sciences (pp. 418-426). Future Academy. https://doi.org/10.15405/epsbs.2019.11.40