
Dynamic Means Of Graphical Clarity

Abstract
For the formation of students' metadisciplinary competencies and, first of all, universal educational skills of graphic clarity, graphic visualization tools are used. Dynamic means of graphic visualization are graphic objects capable of interactive transformation to obtain the most favorable conditions for the observation of physical phenomena and the study of physical laws. Working with ready-made means of graphic visualization - reading and analysis – is a kind of analytical activity, the results of which are allocation from the graphic object of all the essential information on the subject matter (text, question, task, etc.). Work on creation of means of graphic visualization – construction and representation – forms a type of design activity, which results in allocation of the essential properties from the subject matter and the method of coding (tables, schemes or graphics, etc.). The article provides examples of dynamic graphical visualization tools developed by the authors and built in the Geogebra multi-system. Dynamic means of graphic visualization "Collecting lens" and "Scattering lens" can be used at all stages of the process of teaching physics, by conducting a virtual experimental study. Design and research work on the introduction of dynamic graphic visualization tools was carried out in secondary educational institutions of Moscow on the basis of the instrumental capabilities of the platform <IRBIS: ActivInspire – Studio>, which allowed the widest possible dissemination of methodological experience in educational practice.
Keywords: Skillsgraphic visualizationdynamic meansphysics
Introduction
To solve the problem of the study, the requirements for metadisciplinary outcomes of students' mastering the basic educational program were studied. The Federal state educational standard of basic General education (FSES BGE) it is noted that metadisciplinary learning outcomes include mastered interdisciplinary concepts and universal learning activities (regulatory, cognitive, communicative). In school courses of Informatics and Physics the universal educational actions, in particular, include the ability of graphic clarity, namely, the ability to create, apply and transform signs and symbols, models and schemes for solving educational and cognitive problems (Federal State Educational Standard of Basic General Education, 2010).
The draft of Federal state educational standard of basic General education specifies the following requirements for metadisciplinary outcomes: "to use symbolic means to present information and create simple models of the studied objects; to transform the proposed models into a text version of the presentation of information, as well as the proposed text information in the model (table, diagram, diagram)" (Project of Federal State Educational Standard of Basic General Education, 2019).
The question of the need to use visual representations and visualization in mathematics, reading and natural Sciences is often raised in foreign literature (Eilam & Gilbert, 2014; Phillips, Norris, & Macnab, 2010). Of great interest are the works on model-oriented learning (Clement & Rea-Ramirez, 2008), training based on modeling in natural science education (Gilbert & Justi, 2016; Khine & Saleh, 2011), structural modeling in pedagogy and psychology (Ostapenko, 2012).
The use of graphic clarity and models is considered an integral characteristic of physical and mathematical education in the domestic (Kamenetsky & Solodukhin, 1982) and foreign (Doig, Williams, Swanson, Borromeo, & Drake, 2019; Treagust, Duit, & Fischer, 2017) school. The use of schemes, diagrams and supporting abstracts allows to systematize the educational material (Maron & Maron, 2017), the use of models of the physical situation of the problem – to solve physical problems (Mashinyan & Kochergina, 2017).
Problem Statement
The issue of this study is the need to eliminate the contradiction between the requirements of FSES BGE to the formation of graphic visualization skills, and the lack of theory and practice of dynamic means of graphic visualization, methods and approaches to their application at school.
Research Questions
In our research the following issues were raised and solved:
To determine the taxonomy of graphic visualization skills and methods of their formation.
To describe the dynamic means of graphic clarity.
To develop dynamic means of graphic visualization.
To carry out design and research work on the introduction of dynamic means of graphic visualization.
Purpose of the Study
To solve this contradiction, the aim of the study was formulated: to characterize the dynamic means of graphic clarity, to consider the possibility of their application in teaching the subjects of physical and mathematical cycle and typical tasks for their use.
Research Methods
The following methods were used: analysis and generalization of normative documents, scientific and methodical literature on the problems of formation of graphic visualization skills. Computer modeling of graphic visualization tools was carried out. The modeling of the process of teaching physics with the use of graphic visualization was carried out.
Findings
Graphic clarity is one of the most common and widely used didactic forms of enhancing the visibility of educational material. In essence, it is reduced to the creation of graphic images in the minds of students. Graphic images can be combined into several groups: tables, diagrams, diagrams (functional, principal, etc.), graphs, vector diagrams, graphs.
Taking into account many years of experience of practical work with students, including technical specialties, we can state that the work of students with graphic media becomes the most meaningful and productive if it is built linearly in a certain sequence, and not spontaneously and situationally. It is noticed that multi-complex schemes and graphs are better mastered by students who already know how to work with tables and diagrams. A work with vector diagrams and functional graphs better trained students who have mastered the scheme or graphs to this topic. In this regard, we propose to form the skills of graphic clarity consistently in the implementation of the relevant taxonomy. Taxonomy of graphic clarity skills on increase in operational complexity is as follows:
Ability to read, analyze, build and present simple table.
Ability to read, analyze, build and present charts.
Ability to read, analyze, build and present schemes and graphs.
Ability to read, analyze, build and present vector charts and graphs.
Ability to read, analyze, build and present dynamic means of graphic visualization.
In this system, each subsequent type of skill is associated with the previous one, logically follows from it, becoming more complex in content. Describe the content of each skill. Operationally, each skill consists of two parts: 1) to read and analyze a certain type of graphic clarity and 2) to build and present it (Mashinyan & Kochergina, 2018). These parts are also arranged by us in order of complexity and appear in the form of a certain sequence of stages.
The application by students of ready-made means of graphic visualization is a kind of analytical activity, which will be called "reading and analysis (tables, diagrams, diagrams, etc.)". The organization of such activities will be carried out with the help of special standard tasks. For the formation of the ability to read and analyze the graphic visibility of students are offered ready its types. According to the results of reading the graphic object, students should highlight all the encrypted it essential information about the subject. As a result of the analysis, students must formulate a certain conclusion (fact, concept, rule, pattern, etc.) within the content of the discipline.
For the formation of the ability to build and present graphic clarity the students are offered other typical tasks: texts, questions, tasks, which result in the appropriate skills of graphic clarity being mastered. Students must first select from the subject matter (text, question, task) the essential properties, then come up with a way to encode some graphical object (tables, diagrams or graphics, for example). Finally, they must learn highly informative ways of representing the graphical object they have formed, which carries subject information. The second part of the work is more complex, because the formed skills relate to the design and/or design skills of educational and cognitive activity.
Dynamic means of graphic visualization were included into the school educational practice at the turn of 20th and 21st centuries. The development of the software allowed to turn ordinary, familiar from paper textbooks, static images into dynamic graphical objects.
A distinctive feature of the dynamic means of graphic visualization is the possibility of its interactive transformation, that is, the student or teacher as necessary modifies the graphic object to obtain the most favorable conditions for observing the phenomenon and studying the laws used to describe it. When creating and using dynamic means of graphic visualization, the question of scientific reliability and subject relevance remains fundamental.
The pinnacle of mastery of universal educational skills of graphic visualization are the ability to read, analyze, build and present dynamic tools. They allow to encode information into a new form, as well as to visually convey the process of its transformation in time and space. This transformation of the selected form allows to visualize the physical processes hidden from the observer, leading to changes in physical quantities that are not directly observable and measurable. More typical examples can be considered all field of macroscopic processes, which are microscopic (molecular-kinetic, atomic and nuclear) phenomena, all threat monitoring and fast running processes, etc.
In the study of "hidden" from direct observation of physical processes and similar physical problems the student needs a well-developed imagination. Without the use of imagination, the physical essence of the phenomenon itself takes a back seat, and the mathematical apparatus used to describe this phenomenon begins to dominate. In this case an inadequate representation of the physical phenomenon and the errors in the solution of physical problems are almost inevitable.
Let us consider examples of such tools built in the Multisystem Geogebra. Dynamic means of graphic visualization "Collecting lens" can be used at all stages of the learning process, through virtual experimental research.
The program window of "Collecting lens" consists of two sections: The first part – the program window "SL-1" (Fig. 1) – considers the situation in which the object is located at a distance greater than the focal length (b > F).
When working with the SL-1 program window, students should understand the regularity of the image of the object located between the focal plane and the double focus turns out to be real, inverted, enlarged. The location of the image in this case is behind the lens between the double focus and infinity.
There is no need to measure any distances and dimensions on the grid, which allows to measure any distances. They are on the coordinate axes. The scale and spatial depth can be easily changed by scrolling the mouse wheel.
The red color on the graphic object indicates the lens located in the center of the coordinate system. The main optical axis of the lens coincides with the abscissa axis. Red dotted lines on both sides of the lens show its focal planes crossing the main optical axis in focus. The OBJECT is shown on the left – blue arrow. The IMAGE of the object –located to the right of the lens (the arrow of purple color) – is built and moves automatically simultaneously with the change of the object, in accordance with the formula of a thin lens:
This dynamic tool of graphic clarity – window "SL-1" allows to solve any problem on the construction of the image in the collecting lens: the size and/or increase, location, distance from the object to the lens and the distance from the lens to the image. Focal plane after the focus is easily moved with the mouse at any distance, as well as the subject. Moreover, the program window is constructed in such a way that any changes in the location of the object, its size, tilt or change in focal length instantly lead to instant automatic recalculation and adjustment of the program image parameters and the location of the image given by the lens (see Figure
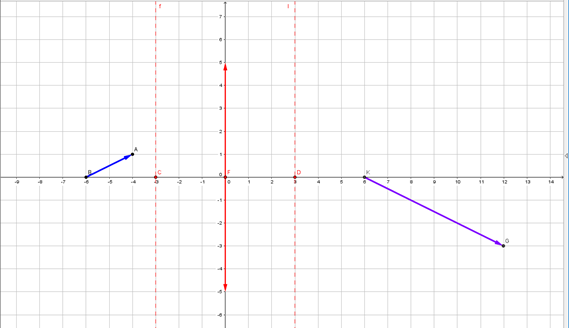
Software window "SL-1"
It is necessary in the form of an experimental task to invite students to move the object in the interval between the focal plane and the plane of double focus, and on an empirical level to identify a pattern: at what location of the object its image is closer to the focal plane, and at what location is removed to infinity.
Figure
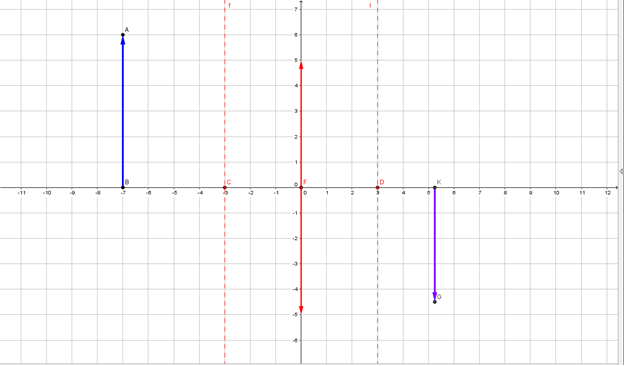
Software window "SL-1"
It is useful in the form of experimental work to offer students to move the object in the interval between the plane of double focus collecting lens and infinity, to understand the pattern: at what location of the object its image is closer to the focal plane, and at what – to the plane of double focus.
For successful learning to solve the problems of building an image in the lens, it is important that students, experimenting with subject windows "Collecting lens" and "Scattering lens", realized that all the actual images obtained with the lens are inverted. This means that the position of the object and the image can be interchanged, resulting in NO violation of the optical laws of physics.
For the formation of students' skills to make the construction of images given by a thin lens (the theme of "Course of the rays in the lens"), it is advisable to use an electronic board and print the above images. Printouts of images as handouts will allow students to finish building on them the course of light rays refracted in the lens and create an image. On the electronic board you can also instruct students to perform this task at the Board.
The subject can be placed at a distance less than the focal length (d < F). The result of this window should be the students' understanding of patterns that the image of the object located between the focal plane and the lens is always imaginary, direct, increased, and the ratio of the distance from the lens to image distance from the lens to the subject is equal to the ratio of image size to the size of the object, i.e., the magnification factor of the magnifier G:
where
H is the height of the image,
h is the height of the object.
As an experimental task, it is advisable to offer students to establish the distance at which the lens should be placed with a focal length of 5 cm from the object, so that the human eye saw the object increased by 10 times. The solution of this problem is associated with the formation of students ' fundamentally important skills of practical use of the magnifying glass.
The above and other tasks were used in the experimental teaching of physics in school practice. The study has undergone evaluation in SBEO No. 1265 and SBEO №1065. All the proposed types of graphic clarity and typical tasks were used in the process of teaching physics to students in grades 9-11. To form the skills of graphic clarity, the tools of the interactive environment "ActivInspire – Studio" were used.
Mastering the technological and instrumental capabilities of the platform <IRBIS: ActivInspire – Studio> was carried out by studying the documentation, in the process of practical use, in communication with colleagues, by searching for information on the Internet. For the fastest development of the IRBIS interactive whiteboard software, we installed the identical application "ActivInspire – Studio" from Promethean company on a personal computer (from the website: https://support.prometheanworld.com) (Appendix ActivInspire – Studio company Promethean, 2018).
In the process of scientific and methodical work:
The capabilities of the platform <IRBIS: ActivInspire – Studio> in terms of implementation of various types of graphical visibility for coding, presentation and analysis of subject information are determined.
The approximate basis of graphic modeling by means of "ActivInspire – Studio" and universal educational skills of graphic visualization is developed in accordance with their taxonomy, which supposes sequential step-by-step formation of skills to read, analyze, encode and present information in each type of visualization;
The comparative check of levels of formation of abilities to read, analyze, encode and represent information in various types of graphic visibility at pupils of the 9th and 11th classes is carried out.
As a result of the experimental teaching, it was found that the use of dynamic means of graphic visualization allows fundamentally new ways to solve the problem of the formation of students' universal educational skills of graphic visualization.
Conclusion
Current FSES BGE and the project of FSES BGE 2019 require the formation of students' skills of graphic clarity. It is necessary to form skills of graphic visualization consistently in accordance with the taxonomy, built on the increase of operational complexity of skills. The development of information technology has led to the emergence of dynamic means of graphic clarity, allowing to create the best conditions for the observation of physical phenomena. The authors have developed dynamic means of graphic visualization in the multi-system Geogebra, which can be used at all stages of the learning process by conducting a virtual experimental study. The use of dynamic means of graphic visualization is largely provided by the introduction in school practice of technological and instrumental capabilities of the platform <IRBIS: ActivInspire – Studio>. This platform allows you to translate the methodology of teaching subjects of the physical and mathematical cycle on a digital basis.
Acknowledgments
The article was prepared in the framework of the state task of the FSBSI "Institute for Strategy of Education Development of the Russian Academy of Education" (project № 27.6122.2017/BCh).
References
- Appendix ActivInspire – Studio company Promethean (2018). Retrieved from: URL: https://support.prometheanworld.com.
- Clement, J., & Rea-Ramirez, M. (2008). Model Based Learning and Instruction in Science. Netherlands: Springer.
- Doig, B., Williams, J., Swanson, D., Borromeo Ferri, R., & Drake, P. (2019). Interdisciplinary Mathematics Education. Netherlands: Springer.
- Eilam, B., Gilbert, J. (2014). Science Teachers’ Use of Visual Representations. Netherlands: Springer.
- Federal State Educational Standard of Basic General Education (2010). Order Of The Ministry Of Education And Science Of Russia № 1897. Retrieved from: URL: https://xn--80abucjiibhv9a.xn--p1ai/documents/938. [in Rus.].
- Gilbert, J., & Justi, R. (2016). Modelling-based Teaching in Science Education. Netherlands: Springer.
- Kamenetsky, S.E., & Solodukhin, N.A. (1982). Modeli i analogii v kurse fiziki srednej shkoly`: posobie dlya uchitelej [Models and analogies in the course of high school physics: a manual for teachers]. Moscow: Prosveshhenie Publ [in Rus.].
- Khine, M., & Saleh, I. (2011). Models and Modeling. Cognitive Tools for Scientific Enquiry. Netherlands: Springer.
- Maron, A.E., & Maron, E.A. (2017). Oporny`e konspekty` i raznourovnevy`e zadaniya. Fizika. 7 klass [Reference notes and multi-level tasks. Physics. 7th grade]. SPb: OOO Viktoriya plyus Publ [in Rus.].
- Mashinyan, A.A., & Kochergina, N.V. (2018). Taxonomy of graphic presentation skills. In Materials of the IV International Scientific Conference «Actual problems of teaching mathematics and computer science at school and university» (pp. 142-144). Moscow [In Rus.].
- Mashinyan, A.A., & Kochergina, N.V. (2017). Technology training in solving physical problems in the modern information environment. The world of science, culture, education, 5, 167-171. [in Rus.].
- Ostapenko, R.I. (2012). Osnovy` strukturnogo modelirovaniya v psixologii i pedagogike: uchebno-metodicheskoe posobie dlya studentov psixologo-pedagogicheskogo fakul`teta [Fundamentals of structural modeling in psychology and pedagogy: a teaching aid for students of the psycho-pedagogical faculty]. Voronezh: VGPU Publ., 116 p. [in Rus.].
- Phillips, L., Norris, S., & Macnab, J. (2010). Visualization in Mathematics, Reading and Science Education. Netherlands: Springer.
- Project of Federal State Educational Standard of Basic General Education. (2019). – Retrieved from: https://www.preobra.ru/attachments/1/01/b241a7-22cb-460b-beb0-9f04fd46f4ec/%D0%A2%D1%80%D0%B5%D0%B1%D0%BE%D0%B2%D0%B0%D0%BD%D0%B8%D1%8F_%D0%BA_%D0%BC%D0%B5%D1%82%D0%B0%D0%BF%D1%80%D0%B5%D0%B4%D0%BC%D0%B5%D1%82%D0%BD%D1%8B%D0%BC_%D1%80%D0%B5%D0%B7%D1%83%D0%BB%D1%8C%D1%82%D0%B0%D1%82%D0%B0%D0%BC_%D0%9E%D0%9E%D0%9E.pdf. [in Rus.].
- Treagust, D., Duit, R., & Fischer, H. (2017). Multiple Representations in Physics Education. Netherlands: Springer.
Copyright information

This work is licensed under a Creative Commons Attribution-NonCommercial-NoDerivatives 4.0 International License.
About this article
Publication Date
30 September 2019
Article Doi
eBook ISBN
978-1-80296-068-6
Publisher
Future Academy
Volume
69
Print ISBN (optional)
-
Edition Number
1st Edition
Pages
1-1054
Subjects
Education, educational equipment, educational technology, computer-aided learning (CAL), Study skills, learning skills, ICT
Cite this article as:
Kochergina*, N. V., & Mashinyan, A. A. (2019). Dynamic Means Of Graphical Clarity. In S. K. Lo (Ed.), Education Environment for the Information Age, vol 69. European Proceedings of Social and Behavioural Sciences (pp. 432-439). Future Academy. https://doi.org/10.15405/epsbs.2019.09.02.50