
The Relationship Between Consumer’s Behavior and Shopping Orientation Moderated by Consumer’s Demographics


Abstract
The e-commerce industry in Indonesia is experiencing a rapid increase, especially for the B2C-based e-commerce industry (Business-to-Consumer). According to current existing data, Indonesia has a wide range of customer orientations and is one of the countries with the highest E-Commerce usage in the world, but Indonesia is still experiencing a customer data crisis that makes B2C-based e-commerce service companies to experience some turbulence in applying features to customers with certain characteristics. Through this research, the author will measure whether demography moderates the relationship between Consumer's Shopping Orientation and Consumer's Shopping Behavior. The data was collected through questionnaires distributed to 536 people who had done transaction through B2C based e-commerce site in Bandung City. The analysis technique used is Structural Equation Model (SEM) with SmartPLS 2.0. The results show that several factors of demography such as income and age levels moderate the relationship between consumer's shopping behavior and consumer's shopping orientation. The results are expected to be a reference for B2C based companies to apply some additional features that are expected to improve the quality and traffic of B2C site itself based on the characteristics of site users.
Keywords: Shopping orientationconsumer behavioure-commecredemographics
Introduction
The digital economy industry continues to grow along with technological growth. One technology that drives Indonesia's economic sector is the internet. The internet has made a major contribution to the growth of developing countries, where the integration of the internet into the economic shutter of these countries has a very significant impact on change (Choi, 2003). The development of the internet in the economic field has encouraged the development of the e-commerce industry. The growth of the Internet in Indonesia has made many people, especially young people, to choose the purchase of goods through online channels because of the ease in the process of purchasing online lanes (Aribawa, 2016). Based on data obtained from EcommerceIQ (2018), e-commerce service providers in Indonesia themselves are divided into various major parts, which consist of Business-to-Consumer, Business-to-Business, and Consumer-to-Consumer. Of the three types of intermediaries, the operator with the largest user and buyer entered the B2C category. Because this research focuses on individuals who have purchased goods through e-commerce sites, the sites that will be used as research objects will be B2C-based.
Along with the growth of technology and e-commerce, the type of shopping orientation that people have has changed. Customers who have used e-commerce features will have a different shopping orientation segmentation compared to consumers who still shop brick-and-mortar (Vijayasarathy, 2003). The impact of changes in orientation segments that arise due to the use of online markets into the internet has resulted in an increase in the percentage of consumers in searching for new items and in particular an increase in the search for goods that match the compatibility of users Rodríguez-Ardura, Ryan, and Gretzel, (2012). This change in orientation prompted many people to use online media to search for items online. The development of dramatic customer orientation segmentation in the world of e-commerce led to the emergence of certain characteristics in consumer behavior when conducting transaction services through e-commerce providers. Consumer behavior that arises when shopping online. Customers spend a lot of time doing stuff sweeping online, as seen in Figure
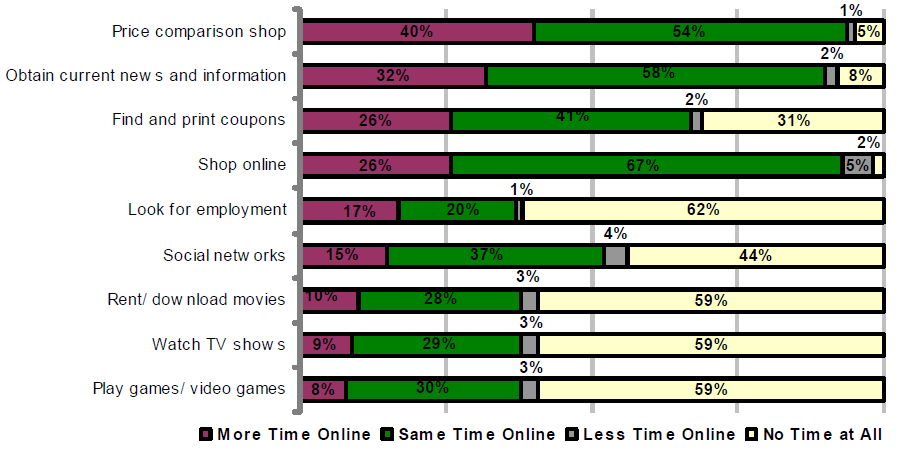
The economic recession caused by the emergence of e-commerce, customer behavior in finding and selecting goods online changes drastically. 40% of internet users spend time comparing prices and 32% of users spend time searching for more information about the items they want to buy.
According to a study conducted by Hasyyati (2017), in her research entitled "Demographic and Socioeconomic Characteristics of E-Commerce Users In Indonesia" explained that there was still a data crisis regarding customers, even though the organizing company and the central statistical agency continued to survey the buyers digital in Indonesia, but the survey on customer characteristics in shopping orientation and their shopping behavior is not signaled by the existing demographic data, making it difficult for companies to know and apply types of features that will increase attractiveness and find out if certain demographics have a relationship between shopping orientation customer and customer shopping behavior, therefore this study will discuss the influence of demography on the relationship between consumer's shopping orientation and consumers.
Problem Statement
Research conducted by Saqib et al. (2016) focuses on the role of demography as a moderator in the consumer behavior and shopping orientation in the digital market era. The object in this study only focuses on one country, namely Pakistan. This research focuses only on one object because of the lack of research conducted on the impact of demographics on consumer behavior and shopping orientation of users of e-commerce services in Pakistan. In this study, Demography is translated into 3 main parts, namely: sex, income, education, and age, these components are the basic parts of the demographic component that has been in the previous research. In Vijayasarathy (2003) study describes the relationship between shopping orientations and internet shopping intentions, as well as the selection of product types based on these two variables. In this study Vijayasarathy (2003) also linked variable shopping orientations with demographic data, because it would be easier to break down buyer segmentation based on demographics. This research continues from the results of Kim (2002) study, which also examines similar things, but suggests that demographic data will become obsolete or cannot be used and trusted again after some time.
Cummins, Peltier, Schibrowsky, and Nill (2014) examined the topic of consumer online buying behavior, which focuses on the behavior of users of e-commerce services, but this study did not use demographics as an independent variable or a moderator in his research. Although this data is very useful for e-commerce service providers in the study country, this study displays random data that is not sorted according to age, income, sex, and education so that e-commerce organizers themselves do not know who their target audience is.
The study of Baubonienė and Gulevičiūtė (2015) also focuses on things that are similar to the research that has been described previously, namely about consumer behavior and additional buying decision variables in which research finds out that what mediator factors are very influential on these two variables. This research found that sex or gender is very influential in influencing consumer behavior and buying decisions
This study examines whether demography has a relationship as a mediator between consumer behavior and consumer's shopping orientation. For consumer behavior, it will be translated into frequency and experience. Whereas for shopping orientation will be divided into 3 parts, namely experiential, entertainment, and quality. What distinguishes this research with previous research is that this study focuses on e-commerce objects based on B2C and C2c in Indonesia alone. This study also uses demography as an independent variable between consumer behavior and shopping orientation, unlike how some previous studies used demographics as independent variables or determinants.
Research Questions
1. Does Age moderate the relationship between consumer shopping or consumer and consumer behavior?
2. Does Gender moderate the relationship between consumer shopping or consumer and consumer behavior?
3. Is Revenue moderating the relationship between consumer shopping or consumer behavior?
4. Does education moderate the relationship between consumer shopping or consumer behavior?
Purpose of the Study
The purpose of this study is to measure moderating effect of demographi in shopping orientation and customer behavior relationship
Research Methods
The method carried out by researchers is quantitatively. Viewed in terms of investigation and purpose, this study uses a causal relationship which means that this type of research has a dependent and independent variable and aims to see a causal relationship between the independent variables and the dependent on the planned situation (Sugiyono, 2015).
This study describes the relationship of consumer orientation to consumer online behaviour with demographic mediators of users of B2C-based e-commerce services in the city of Bandung. The data in this study were obtained from primary data collection by distributing questionnaires. Questionnaires made using 1-5 likert scale. The population in this study were all individuals who made purchases online. The sample in this study is all of the individuals who have made a purchase transaction on an e-commerce site on a B2C basis in the city of Bandung. The independent variable in this study is the Shopping Orientation and the dependent variable in this study is the Consumer's Behavior with Demographic mediators.
Hypothesis testing is done partially (T test) is used to examine the effect of the relationship of each variable. The mean difference test technique is the simplest one sample t-test, which is a technique to test the difference in the distribution of data in a group of samples whether it is different from the mean value (Chin, 2010). With a confidence level of 95% and a level of precision or an inaccurate limit of (α) = 5% the value of t table is 1.65. So, if the t-statistic value is smaller than the t-table value (t-statistic <1.65), then H0 is accepted. If the t-statistic value is greater than the t-table value (t-statistic ≥ 1.65), then H0 is rejected.
Findings
Characteristics of Respondents
Characteristics in this study illustrate the respondents who filled out the questionnaire. Characteristics of respondents can be seen in table
Data Analysis
Measurement Model
Evaluation of measurement models in research is done to test the validity and reliability of a construct. Model evaluation is done by testing reliability and reliability. Validity test is done by testing convergent validity and discriminant validity. The HTMT approach is to test discriminant validity and to test the validity with convergent validity, while the reliability test is done with two events, namely Cronbach's Alpha and Composite Reliability (Hair et al, 2010).
Validity Test
Validity Test is done to determine the ability of research instruments to measure what should be measured. Validity testing is done through convergent validity and discriminant validity (Hair, Black, Babin, & Anderson, 2010).
Convergent Validity
Convergent validity is related to the extent to which the manifest manifestation (a meter) of a construct is high, which indicates how much similarity is captured by a construct. Measuring the convergent validity with a reflective indicator that is the value of the loading factor> 0.7. The loading factor test results from 0.710 to 0.901 and all above 0.7.
Evaluation of convergent validity can also be done by looking at the value of Average Variance Extracted (AVE)> 0.5. The test results of AVE values in table 4.3 show that all indicators of each variable have a value of> 0.5. Convenience Customer sub variables get a value of 0.749, Entertainment Customers get a value of 0.647, Experiential Customers get a value of 0.752, and Shopping Behaviour gets a value of 0.63. These results can be concluded that all indicators have been valid and have reached convergent validity which shows that each indicator has explained its variables properly.
Discriminant Validity
Discriminant validity implies that a construct must be unique and capture phenomena that are not represented by other constructs in the model.
According to Ramayah et al (2016), there are other tests to measure discriminant validity, namely the Heterotrope-Monotrait Ratio of Correlations (HTMT). The HTMT approach is able to achieve high specificity and sensitivity assessments reaching 97% -99%. HTMT assessment criteria in measuring discriminat validity if the HTMT value is <0.85. The HTMT test results in table 4.5 show the overall value <0.85 which is stated to achieve good discriminant validity (Kline 2011; Ramayah et al, 2016).
Reliability Testing
Reliability testing is used to measure the consistency of respondents in answering question items in a questionnaire or research instrument. Reliability testing in PLS can use two methods, namely cronbach's alpha and composite reliability (Abdillah & Jogiyanto, 2015). The way to test the reliability of a construct by looking at the value of cronbach's alpha> 0.7. for the result arrange of cronbarch’s alpha from 0.707 to 0.890. Testing that can be used to cover the shortcomings of cronbach's alpha in reliability testing is composite reliability. Composite reliability or often called Dillon Goldstein's. Composite reliability measures the true reliability value of a variable that produces a higher value than cronbach's alpha (Abdillah & Jogiyanto, 2015). The way to test the reliability by looking at the composite reliability value> 0.7 which is described as solid. The reult show that composite reliability from 0.845 to 0.924.
Evaluation of Structural Models (Inner Model)
After evaluating the variable measurement model, the next step is to evaluate the structural model or inner model. Structural model testing is done to predict causal relationships between variables and hypothesis testing (Chin, 2010). Structural model evaluation is done by looking at the R-Square (R2) and predictice relevance (Q2) values.
R-Square (R2)
Assessing the structural model with PLS begins by looking at the value of R-Square to determine the amount of variability of endogenous variables that can be explained by exogenous variables. R-Square criteria consist of three classifications, namely 0.67, 0.33, and 0.19, showing a strong, moderate, and weak model (Abdillah & Jogiyanto, 2015).
Predictive Relevance (Q2)
Another test conducted in evaluating the structural model is predictive relevance (Q2) or often called predictive sample reuse. Predictive relevance value (Q2) was obtained through the blindfolding process in the SmartPLS 2.0 software. This measurement is suitable if the endogenous latent variable has a reflective measurement model. Q2 results are said to be good if the value of Q2> 0 indicates that the model has predictive relevance, whereas if the value of Q2 <0 indicates that the model lacks predictive relevance (Abdillah & Jogiyanto, 2015).
Hypothesis Testing
In this study, hypothesis testing for moderating effects was carried out on 4 demographic variables, namely age, education, and gender variables. Hypothesis moderating effect testing is done using the chi square formula (Chin, 2010). With the formula used as follows:
H1: The relationship between shopping orientation and consumer behavior is moderated positively by age
H1a: The relationship between experiential shopping orientation and consumer behavior is moderated positively by age
H1b: The relationship between entertainment shopping orientation and consumer behavior is moderated positively by age
H1c: The relationship between convenience shopping orientation and consumer behavior is moderated positively by age
H1 testing results produce t-statistics of 2.321 for convenience shopping orientation and shopping behavior, 3,010 for relationship entertainment shopping orientation and shopping behavior, and 0.946 for experiential shopping orientation and shopping behavior relationships. These results indicate that convenient direct relationships shopping orientation and shopping behavior and relationship entertainment shopping orientation and shopping behavior are moderately positively moderated by age, where positive moderation comes from a young age for H1B and H1C. H1 was accepted in this study.
H2: The relationship between shopping orientation and consumer behavior is moderated positively by gender
H2a: The relationship between experiential shopping orientation and consumer behavior is moderated positively by gender
H2b: The relationship between entertainment shopping orientation and consumer behavior is moderated positively by gender
H2c: The relationship between convenience shopping orientation and consumer behavior is moderated positively by gender
The test results of H2 produce a negative t-statistic value for all types of relationship shopping orientation and shoppig behavior with t-statistic values smaller than 1.96, Hypotheses H2 (H2A, H2B, and H2C) are rejected in this study.
H3: The relationship between shopping orientation and consumer behavior is positively moderated by the level of income
H3a: The relationship between experiential shopping orientation and consumer behavior is positively moderated by income levels
H3b: The relationship between entertainment shopping orientation and consumer behavior is positively moderated by income levels
H3c: The relationship between convenience shopping orientation and consumer behavior is positively moderated by income levels
H3 test results produce t-statistics value of -1.479 for convenience shopping orientation relationship and shopping behavior, -0.494 for relationship entertainment shopping orientation and shopping behavior, and 2.245 for experiential shopping orientation and shopping behavior relationships. These results show that direct experiential shopping orientation and shopping behavior relations are positively moderated by income. H3 (H3C) was accepted in this study, while for the hypothesis H3A and H3B were rejected.
H4: The relationship between shopping orientation and consumer behavior is moderated positively by the level of education.
H4a: The relationship between experiential shopping orientation and consumer behavior is positively moderated by the level of education
H4b: The relationship between entertainment shopping orientation and consumer behavior is moderated positively by the level of education
H4c: The relationship between convenience shopping orientation and consumer behavior is moderated positively by the level of education
H4 test results produce negative t-statistic values for all types of relationship shopping orientation and shopping behavior with t-statistics values smaller than 1.96, H4 Hypotheses (H4A, H4B, and H4C) were rejected in this study.
Discussion of Research Results
This study aims to see whether the relationship between consumer shopping orientation and consumer behavior is moderated by demographics (age, gender, income, and level of education). The results of this study indicate that the relationship between shopping orientation and consumer behavior is moderately positively moderated by age. The results of this study indicate that the relationship between shopping orientation and consumer behavior is not positively moderated by gender, which means that the hypotheses H2 (H2A, H2B, and H2C) are rejected in the study this. These results indicate that gender does not moderate the relationship between shopping orientation and consumer behavior.
The results of this study indicate that the relationship between shopping orientation and consumer behavior is moderately moderated by age, the moderated relationship is the relationship between experiential shopping orientation (H3A) and consumer behavior which is positively moderated by income levels. This shows that the relationship between experiential consumer orientation and consumer behavior is positively moderated by income, where high income is more likely to capitalize the relationship. The results of this study indicate that the relationship between shopping orientation and consumer behavior was not positively moderated by the level of education, which means that the hypotheses H4 (H4A, H4B, and H4C) were rejected in this study.
Conclusion
The following are conclusions that can answer the research questions that have been described in this study:
1. Based on the results of data processing, it was found that the relationship between shopping orientation and Consumer shopping behavior was moderately moderated by age.
2. Based on the results of data processing, it was found that the relationship between shopping orientation and Consumer shopping behavior was not moderated by gender.
3. Based on the results of data processing, it was found that the relationship between shopping orientation and Consumer shopping behavior was positively moderated by income.
4. Based on the results of data processing, it was found that the relationship between shopping orientation and Consumer shopping behavior was not moderated by education.
References
- Abdillah, W., & Jogiyanto, D. (2015). Partial Least Square (PLS), Alternatif Structure Equation Modeling (SEM) dalam Penelitian Bisnis. Yogyakarta, CV Andi Offset.
- Aribawa, D. (2016). E-Commerce Strategic Business Environment Analysis in Indonesia. International Journal of Economics and Financial Issues, 6(6S), 130-134.
- Baubonienė, Z., & Gulevičiūtė, G. (2015). E-commerce factors influencing consumers’ online shopping decision. Social Technologies, 5(1), 74-81.
- Chin, W. W. (2010). How to write up and report PLS analyses. In Handbook of partial least squares (pp. 655-690). Springer, Berlin, Heidelberg.
- Choi, C. (2003). Does the Internet stimulate inward foreign direct investment? Journal of Policy Modeling, 25(4), 319-326.
- Cummins, S., W., Peltier, J. A., Schibrowsky, J., & Nill, A. (2014). Consumer behavior in the online context. Journal of Research in Interactive Marketing, 8(3), 169-202.
- eCommerceIQ (2018) Top E-Commerce Sites in Indonesia. Retrieved on https://ecommerceiq.asia/top-ecommerce-sites-indonesia/ at 9 Januari 2018
- Hair, J. F. Black. W. C., Babin., B. J., & Anderson, R. E. (2010). Multivariate data analysis, a global perspective. New Jersey. Pearson. Ed, 7, 816.
- Hasyyati, A. N. (2017). Demographic and socioeconomic characteristics of e-commerce users in Indonesia (No. 776). ADBI Working Paper Series.
- Kim, Y. K. (2002). Consumer value: an application to mall and Internet shopping. International Journal of Retail & Distribution Management, 30(12), 595-602.
- Kline, R.B. (2011). Principles and Practice of Structural Equation Modeling. New York: Guilford Press.
- Ramayah, T., Cheah, J., Chuah, F., Ting, H., Memon, M. A. (2016). Partial Least Squares Structural Equation Modeling (PLS-SEM) using SmartPLS 3.0: An Updated and Practical Guide to Statistical Analysis. Retrieved from ResearchGate.
- Rodríguez-Ardura, I., Ryan, G., & Gretzel, U. (2012). Special issue on qualitative approaches to e-marketing and online consumer behaviour: guest editors' introduction. Journal of theoretical and applied electronic commerce research, 7(2), IV-V.
- Saqib, Z. A., Rabnawaz, A., Saqib, K. A., Salma, U., Ahmed, W., Hussain, S., ... & Zulqarnain, M. (2016). Moderating Role of Consumer's Demographics on the Relationship between Consumers’ Shopping Orientation and Behavior.
- Sugiyono (2015). Metode Penelitian Pendidikan (Pendekatan Kuantitatif, Kualitatif dan R&D). Bandung: Penerbit CV. Alfabeta.
- Vijayasarathy, L. R. (2003). Shopping orientations, product types and internet shopping intentions. Electronic Markets, 13(1), 67-79.
Copyright information

This work is licensed under a Creative Commons Attribution-NonCommercial-NoDerivatives 4.0 International License.
About this article
Publication Date
02 August 2019
Article Doi
eBook ISBN
978-1-80296-064-8
Publisher
Future Academy
Volume
65
Print ISBN (optional)
-
Edition Number
1st Edition
Pages
1-749
Subjects
Business, innovation, sustainability, environment, green business, environmental issues
Cite this article as:
Sazaly, M. H., Widiyanesti, S., & Amran, A. (2019). The Relationship Between Consumer’s Behavior and Shopping Orientation Moderated by Consumer’s Demographics. In C. Tze Haw, C. Richardson, & F. Johara (Eds.), Business Sustainability and Innovation, vol 65. European Proceedings of Social and Behavioural Sciences (pp. 712-721). Future Academy. https://doi.org/10.15405/epsbs.2019.08.72