
Eco-Bio-Economic Development And Emissions Reductions By Changing Technology

Abstract
The main objective of this article is the establishment of an innovative training system about social, environmental and economical aspects of the climate change and air pollution, based on the analysis of the eco-bio-economy development implemented in order to move to circular ecological growth with a focus on monitoring and emission reduction to ensure sustainable development. The analysis focuses on setting targets for a developed and organized training courses as engineering and eco-bio-economiy education program module in order to raise awareness and channel knowledge to specialists about: climate change forecasting analysis models, mitigating specific greenhouse gas emissions, adapting public policies to climate change. Scaling up renewable energy to 36% of the global energy mix by 2030 would provide about half of the emissions reductions needed to hold warming to 2°C. Over the period under review (2005-2016), among ten Central and Eastern European Countries (Bulgaria, Czech Republic, Estonia, Hungary, Latvia, Lithuania, Poland, Romania, Slovenia, Slovakia), Poland is the undisputed renewable growth leader, accounting for almost 83 million tonnes of oil equivalent from primary production of biomass, hydropower, geothermal energy, wind and solar energy.
Keywords: Eco-Bio-EconomySustainable Developmentairpollutantsgreenhouse gas emissionsrenewable energiesCentral and Eastern European Countries
Introduction
Primary target group of the training course is audiences professional in climate field, economic,
social, environmental level in order to implement projects and measures that continuously improve the lives
of current and future generations, by developing at the level of central and local communities the ability to
manage and effectively use natural resources, to stimulate innovation in the social and environmental fields,
thus ensuring sustainable agriculture, food security, prosperity, environmental protection, biodiversity, and
economic and social cohesion. American scientist Lester Brown, one of the pioneers of the concept of
sustainable environmental development, launched the eco-economic theory in 2001 that highlights the
importance of ecology and environmental protection in the sustainable development of mankind (Brown,
2001). Environmental policy procedures should be a sound basis for sustainable development for the benefit
of all human beings and the environment (Ostrom, 2007). It has been demonstrated that we can survive a
month without food, between 3 and 8 days without water, between 3 and 10 minutes (differentiated from
person to person) without air, these being the physical requirements of our physical body that sustain
physical life. God could have created humanity in a million different ways, but people's lives depend mainly
on breathing, drinking water and eating food. As Steffen and Kirch conclude in their studies, it is necessary
to effectively integrate the three pillars of sustainable development into the economic, social and
environmental dimensions (Steffen, Sanderson, & Jager, 2004; Kirch, 2005).
Interactions between the three pillars of sustainable development: economy, environment
and society
Ecological economy differs from conventional economy and conventional ecology in terms of the
high horizon of its perception of climate change and the importance it attaches to the interaction between
the environment and the economy (figure
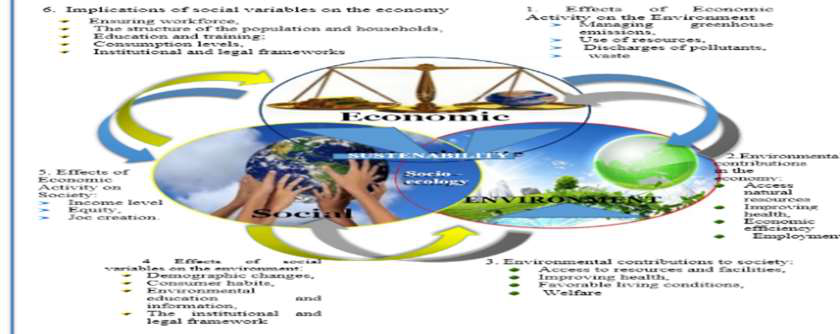
The transition to eco-bio-economy is expected to solve the following issues:
Dependency of limited fossil resources;
Increases in energy consumption, especially in the transport sector;
Climate change and global warming;
Contamination of the environment with unnatural and non-degradable materials;
Sustainable development seen from the perspective of environmental protection should focus on
reducing air pollution by limiting greenhouse gas emissions, prudent management of water and land
resources, effective waste management policies, protecting biodiversity (Constanza, Daly, & Bartholomew,
2006). However, to prevent the deterioration of the environment and to improve living standards, it is
necessary to restructure the tax system by reducing income taxes and increasing environmental taxes for
destructive activities, so that taxes reflect ecological truth.
Environmental policies at EU level and Central and Eastern Europe Countries.
The Energy Union supports the shift towards a resource-efficient, low-carbon economy to achieve
sustainable growth through their legal frameworks and related initiatives. The European Union, which is a
signatory to the United Nations Convention on Climate Change (UNFCCC), reports annually the status of
greenhouse gases (GHG) eliminated in the atmosphere by its Member States (Paris Agreement, 2015)
With the ratification of the Kyoto Protocol in 2002, the European Union (EU) is the main region
that has made strong efforts to mitigate climate change among developed economies, setting a 20%
greenhouse gas reduction target in 2020 compared to 1990. EU 28 GHG emissions were reduced by 17.88%
in 2016 compared to 2007.
After EU integration (in May 2004: Czech Republic, Estonia, Hungary, Latvia, Lithuania, Poland,
Slovenia, Slovakia and January 2007: Romania and Bulgaria), the main objective of the countries in Central
and Eastern Europe (10 CEEC) was to raise living standards by aligning policies with EU requirements.
Therefore, they have implemented profound and coherent political reforms in order to ensure better
interaction and coordination between EU Member States and reduce the gap between them and Western
European countries.
The EU emission reduction obligation is shared between Member and industry through the EU
Emissions Trading Systems (EU ETS). EU Sustainable Development Goals (SDG) indicator set it is used
to monitor progress towards SDG 7 on affordable and clean energy, SDG 12 on ensuring sustainable
consumption and production patterns and SDG 13 on climate action. Furthermore, the European Council
has agreed on three key targets for the year 2030: at least 40 % cuts in greenhouse gas emissions (from
1990 levels), at least 27 % share for renewable energy and at least 27 % improvement in energy efficiency
(European Union, The EU Emissions trading system, 2013).
Problem Statement
Air pollution seriously damages human health and the environment. Emissions of gases can lead to
major environmental problems and can cause acidification, eutrophication or photochemical fog and smoke.
Data on emissions of air pollutants (ammonia (NH3), non-methane volatile organic compounds (NMVOC),
nitrogen oxides (NOx) and sulphur oxide (SOx)) annually reported by Member States to the European
Commission under Directive 2016/2284 of the European Parliament and of the Council on the reduction of
national emissions of certain atmospheric pollutants (European Environment Agency, 2016)
The pollutant with the greatest reduction in emissions across the 10 CEEC has been SOx. Emissions
of SOx in 2016 stood at 1.09 million tonnes compared to 2,24 million tonnes in 2008 . The majority of SOx
emissions were reduced in the energy production and distribution sector (Electricity, gas, steam and air
conditioning supply, 185.386 tonnes less). In
tonnes compared to
than halved from 18.1 to 7.6 million tonnes. In the 10 CEEC, the largest reduction of NOx took place in
Poland, by roughly 15,33 %. Road transport is the main contributing sector to total NOx emissions.
Emissions of NH3 almost entirely derive from agriculture. Main reductions were achieved through better
waste management. Nowadays, ammonia is likely to be the most important acidifying gas emitted in
Europe. Compared to other pollutants, reductions in NH3 emissions were moderate. In 10 CEEC, over the
past 9 years the emissions of NH3 decreased from 749.877,19 to 669.353,74 tonnes. Between 2008 and
2016, CEEC-10-wide emissions of NMVOC have been reduced by roughly 15% from 1.028 million tonnes
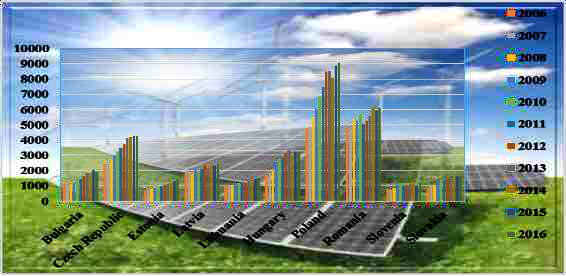
to 875.081,15 tonnes. The charts below show the evolution of the main greenhouse gases in ten countries
from Central and Eastern Europe (figure 02, figure
Poland is the most polluting country in the 10 post-communist EU countries.
Also, Romania and Poland are leading countries in the release of considerable amounts of emissions
into the atmosphere. Between 2015 and 2008, the most notable achievements in reducing carbon dioxide
in the air occurred in the Romania, where the total quantities have been reduced by 27% from 93039627
tonnes to 67935589 tonnes.
Research Questions
How did different countries from Central and Eastern Europe implement renewable energy and what
impact did it have on GHG reductions?
A substantial reduction in CO2 emissions could be achieved by changing existing energy generation
technology with renewable energy technologies. The Energy Union strategy highlights renewable energies
as part of the required efforts for the decarbonisation of the energy system. EU Cohesion Policy (2014-
2020) invests EUR 29 billion in sustainable energy, including energy efficiency, renewable energy, smart
energy infrastructure and low-carbon research and innovation
Renewable energy technologies are recognized as having the potential to serve as an effective tool
for managing natural resources and to encourage a change in positive environmental behaviour. Primary
production of biomass, hydropower, geothermal energy, wind and solar energy are included in renewable
energies.
Over the period under review (2005-2016), among ten Central and Eastern European Countries
(Bulgaria, Czech Republic, Estonia, Hungary, Latvia, Lithuania, Poland, Romania, Slovenia, Slovakia),
Poland is the undisputed renewable growth leader, accounting for almost 83 million tonnes of oil equivalent
from primary production of biomass, hydropower, geothermal energy, wind and solar energy. Perhaps
surprisingly, Romania is the second-largest growth market for renewables with 64 million tonnes of oil
equivalent from primary production of biomass, hydropower, geothermal energy, wind and solar energy.
However, uncertainties around proposed tax reforms and energy policies could hinder renewable growth in
Romania (Figure 06).
Poland is the most polluting country of the 10 post-communist EU countries, releasing the most
significant quantities of greenhouse gases in the atmosphere, as shown in the graph above. For this reason,
we have chosen to evaluate the dependency between renewable energy and emissions of ammonia, sodium
oxides, sulfur oxides, non-methane volatile organic compounds, which are expressed in CO2 equivalent.
Purpose of the Study
Air pollution processes frequently involve the analysis of the simultaneous influence of several
variables (in our case emissions of ammonia, sodium oxides, sulphur oxides, non-methane volatile organic
compounds, which are expressed in CO2 equivalent), apparently independent of one variable considered to
be (dependent) on their action (renewable energies).
The linear modelling of this multiple correlation is the simplest solution adopted in a preliminary study
phase. It is formally expressed through the equation y= 𝜶𝟎+𝜶𝟏𝒙𝟏+𝜶𝟐𝒙𝟐+…𝜶𝒏𝒙 𝒏+𝒆𝒊:
where:
tax- independent variable;
𝒙𝟏 … . 𝒙𝒏- factorial variables;
𝜶𝟎 … 𝜶𝒏.- model parameters;
Research Methods
A multiple regression model was used in order to study the dependence of renewable energies by
the four air pollution emissions (ammonia (NH3), non-methane volatile organic compounds (NMVOC),
nitrogen oxides (NOx), and sulphur oxide (SOx)), in Poland. Thus, following the estimation of the Minitab
(Figure 07) parameters for emissions of ammonia, nitrogen oxides, sulphur oxides and non-methane volatile
organic compounds, it was obtained a model that captures the dependence of the regenerative energy of
ammonia (NH3), nitrogen oxides (NOx) sulphur oxides (SOx) having the following equation:
Renewable energy = -6309.94 +0.026528 * NH3 +0.005375* NOx – 0.0032*Sox,
for which it has been obtained Coefficient of determination R2=0,947249.
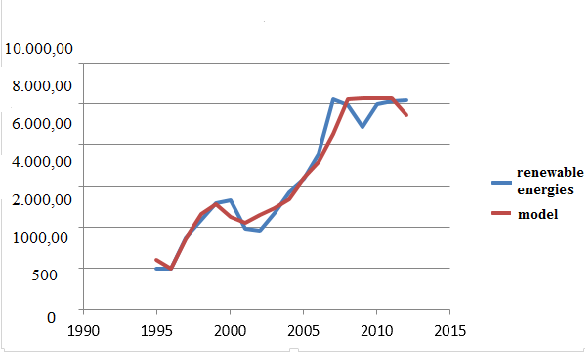
renewable energy obtained according to our model, in Poland, Multiple Regression Model, Eviews7
Given that the Coefficient of determination is close to 1, the correlation is strong, so the endogenous
variable (renewable energies) is strongly influenced by exogenous (gas emissions). It also shows what
percentage of renewable energy can be attributed to significant factors (NH3, NOX, SOX,). In our case,
about 94.72% of the increase in the amount of renewable energy is due to the variation in gas emissions
(expressed in tonnes of CO2 equivalent)
Findings
The calculation of the parameters is done by the least squares method and the resulting equations
are solved. It was checked the significance of the parameters and models as a whole and the models are
statistically correct. Also, the residues were checked and they are normal, independent and homoscedastic.
T-test significance values for the coefficients and p-values are given below. Since p-values are
smaller than 0.05, the coefficients are significant (table
To validate the model as a whole, it was used the ANOVA and Fisher (F) test to determine how
much of the variance of the dependent variable is explained by the estimated equation. If this coefficient is
close to 1, then the correlation is significant, so the endogenous variable is strongly influenced by the
exogenous ones. The results of the F test confirm that the model is significant overall because its value is
83.7998 and the p-value is 3,492 10-9< 0,01.
F = 83,7998, p-val = 3.492E-09
For the homoscedasticity analysis of the residues we used a series of tests: ” F” test that shows a normal distribution because the statistical test is 0.26 and the value of ”p” is 0.077 and Levene test, whose
statistic has a value of 1.68, corresponding to a p value of 0.213.
Conclusion
The transition to eco-bio-economy is expected
fossil resources by increasing production of our global energy needs from alternative energy sources: solar
energy, wind power and moving; increases in energy consumption, especially made through transition to
an affordable, reliable, and sustainable energy system; climate change and global warming made through a
substantial reduction in CO2 emissions achieved by changing existing energy generation technology with
renewable energy technologies. Those who will take a course in eco-bio-economy development and
renewable energy can be prepared to face this looming crisis. A study of renewable energy may reinforce
existing mathematical and analytical reasoning abilities. These classes often emphasize an interdisciplinary
approach that improves the understanding of economy, social and environmental sciences. Students may
develop an appreciation for the business aspect of the energy industry.
Greenhouse gas emissions reductions have been the result of a combination of policy measures.
National emissions reduction policies have led to the following important results in the period between
2011-2016 compared to 2010. The following main findings are widely based on the European Union
emission inventory report 1990–2016 under the UNECE Convention on Long-range Transboundary Air
Pollution (LRTAP). The pollutant with the greatest reduction in emissions across the 10 CEEC has been
SOx. Emissions of SOx in 2016 stood at 1.09 million tonnes compared to 2,24 million tonnes in 2008 . The
majority of SOx emissions were reduced in the energy production and distribution sector (Electricity, gas,
steam and air conditioning supply, 185.386 tonnes less). In Romania, emissions of SOx in 2015 stood at
147.219,27 tonnes compared to 520.743,47 tonnes in 2008. Over the last 27 years, EU-wide emissions of
NOx more than halved from 18.1 to 7.6 million tonnes. In the 10 CEEC, the largest reduction of NOx took
place in Poland, by roughly 15,33 %.
Over the period under review (2005-2016), among ten Central and Eastern European Countries
(Bulgaria, Czech Republic, Estonia, Hungary, Latvia, Lithuania, Poland, Romania, Slovenia, Slovakia),
Poland is the undisputed renewable growth leader, accounting for almost 83 million tonnes of oil equivalent
from primary production of biomass, hydropower, geothermal energy, wind and solar energy. Perhaps
surprisingly, Romania is the second-largest growth market for renewables with 64 million tonnes of oil
equivalent from primary production of biomass, hydropower, geothermal energy, wind and solar energy.
Poland is the most polluting country of the 10 post-communist EU countries, releasing the most
significant quantities of greenhouse gases in the atmosphere, as shown in the graph above. For this reason,
we have chosen to evaluate the dependency between renewable energy and emissions of ammonia, sodium
oxides, sulphur oxides, non-methane volatile organic compounds, which are expressed in CO2 equivalent.
We used a multiple regression model to study the dependence of renewable energies by the four air pollution
emissions (ammonia (NH3), non-methane volatile organic compounds (NMVOC), nitrogen oxides
(NOx),and sulphur oxide (SOx)), in Poland. Given that the Coefficient of determination is close to 1, the
correlation is strong, so the endogenous variable (renewable energies) is strongly influenced by exogenous
(gas emissions). It also shows us what percentage of renewable energy can be attributed to significant
factors (NH3, NOX, SOX,). In our case, about 94.72% of the increase in the amount of renewable energy
is due to the variation in gas emissions (expressed in tonnes of CO2 equivalent).
References
- Adoption of the Paris Agreement. (2015) United Nations Framework Convention on Climate
- Change (UNFCCC). Retrieved from https://unfccc.int/resource/docs/2015/cop21/eng/l09r01.pdf
- Brown, L. R. (2001). Eco-Economy: Building an Economy for the Earth,W. W. Norton & Co.,NY. Retrieved from http://library.uniteddiversity.coop/REconomy_Resource_Pack/More_Inspirational_Vidos_and_Us eful_Info/Eco-Economy.pdf Costanza, R. Daly, H.E. and Bartholomew, J. A. (1991). Goals Agenda and Policy Recommendations for Ecological Economics. In Costanza, R., Ecological Economics:New York: The Science and Management of Sustainability Columbia University Press.1-20. https://dx.doi.org/10.1.1.458.290.European Commission. (2014). An introduction to EU Cohesion Policy 2014-2020. Retrieved from https://ec.europa.eu/regional_policy/sources/docgener/informat/basic/basic_2014_en.pdf
- European Enviroment Agency. (2017). Air pollution. Enviromental Topics. Retrieved from
- http://www.eea.europa.eu/themes/air/intro
- European Union. (2013). The EU Emissions Trading System (EU ETS). https://dx.doi.org/1010.2834/5548
- Retrieved from http://ec.europa.eu/clima/publications/docs/factsheet_ets_en.pdf
- Kirch, P.V.( 2005). Archaeology and global change. Annual Review of Environment and Resources, 428,
- 409-440. https://dx.doi.org/10 10.1146/annurev.energy.29.102403.140700
- Ostrom, E. (2007). Sustainable Social-Ecological Systems: An Impossibility? SSRNElectronic Journal
- 01/2007, 2, 1-29. https://dx.doi.org/1010.2139/ssrn.997834
- Steffen W., Sanderson A., Tyson P., Jäger J., Matson P., Moore III B., Oldfield F., Richardson K.,
- Schellnhuber H.-J., Turner II B.L., Wasson R. (2004b), Global Change and the Earth System: A Planet Under Pressure, IGBP Global Change Series, New York: Springer-Verlag, Berlin Heidelburg.
- Stuart, T. & Sorenson, O. (2003). The Geography of Opportunity: Spatial Heterogeneity n Founding Rates and The Performance of Biotechnology Firms Research Policy, 32,(2).
- https://dx.doi.org/1010.1016/S0048-7333(02)00098-7
Copyright information

This work is licensed under a Creative Commons Attribution-NonCommercial-NoDerivatives 4.0 International License.
About this article
Publication Date
15 August 2019
Article Doi
eBook ISBN
978-1-80296-066-2
Publisher
Future Academy
Volume
67
Print ISBN (optional)
-
Edition Number
1st Edition
Pages
1-2235
Subjects
Educational strategies,teacher education, educational policy, organization of education, management of education, teacher training
Cite this article as:
Mascu*, S., & Simionescu, V. (2019). Eco-Bio-Economic Development And Emissions Reductions By Changing Technology. In E. Soare, & C. Langa (Eds.), Education Facing Contemporary World Issues, vol 67. European Proceedings of Social and Behavioural Sciences (pp. 1612-1620). Future Academy. https://doi.org/10.15405/epsbs.2019.08.03.197