
Traffic Management Training Via Dedicated Software

Abstract
Within the context of urban traffic intensification and current EU transportation planning provisions, higher education Master’s programmes have been challenged to constantly review and customize curricula in order to enhance students’ professional development to meet the demands of the contemporary labour market. Designed as a case study project for 2nd year Masters’ students, the research objective assigned to our students was the determining of the kinematic and dynamic parameters of a vehicle and a pedestrian involved in a road accident. By means of Virtual Crash software platforms we set out to train our students’ technical skills and critical thinking in the analysis of pedestrian-vehicle impacts. Hence, we aim at familiarising the students with the tools provided by the software and to assist them in the analysis of traffic accidents virtual modelings. Resorting to the application provided by Virtual Crash, students will learn how to determine the trajectory of vehicles, based on vehicle movements in the pre- and post-impact phase. To accomplish their assignment students will fulfill the following stages of the virtual vehicle - pedestrian impact modeling: to design the scenario of the traffic accident in the virtual environment, observing the traces and distances identified in the criminal field; to determine how the road accident was produced; to determine the speed of the vehicle at the impact and the projecting distance of the pedestrian; to identify the phases of the collision.
Keywords: Traffic engineeringaccident reconstructionvirtual modellingkinematic parameters
1.Introduction
Challenged by the constantly upgrading cutting-edge technological systems, the automotive industry
and traffic engineering researchers have joined forces to train specialists able to solve high-demanding tasks
on traffic safety. In what follows we shall carry out an integrated project, aimed at familiarising future
traffic engineers with dedicated software as to assist specialised activities focused on traffic accidents. Our
students will be instructed how to develop a multi-phased project in order to model and analyse a virtual
vehicle - pedestrian impact.
Rationale.
Accidentology has been introduced to Masters’ students as a technical discipline which, via
scientific methods, assists specialists to investigate traffic accidents and subsequent body injuries while
considering all circumstances and influences, in order to develop both effective and applicable solutions to
reduce the number of accidents and diminish their severity (Gaiginschi et al., 2006). In compliance with
the recently released EU traffic surveys, we seek to rise our students’ awareness and instruct them with
regard to one of the most alarming issues reported by road safety statistics, i.e. a significant increase in the
number of deaths among vulnerable users such as pedestrians and motorcyclists - despite a global reduction
in the number of fatal road accidents. Within our previous projects, we sought to familiarise our students
with most recent outcomes applied to decease accidents involving vulnerable road users, i.e. pedestrians or
cyclists. Hence, Serre et al. (2006) provides some in-depth accident investigations, numerical simulations
with multibody models and experimental reconstitution with PMHS subjects, in order to identify the
correlation between the velocity of the vehicle and the position of the victim position at the impact moment.
Han et al. (2001) put forward a method to express the relation between the speed, the distance travelled and
the time measured from the impact moment to the final position of the vehicle and the pedestrian.
Statistical data.
Current statistical data highlight the need for increased safety measures with regard to vulnerable
road users. At international level, considerable differences have been recorded in terms of death distribution
as related to road users and country (Brandstaetter, 2012). In Romania, almost half (40%) of the reported
deaths were among pedestrians, 20% drivers, 20% passengers, about 7% cyclists, while only 3% of the
registered deaths belong to the category of motorcyclists (Figure
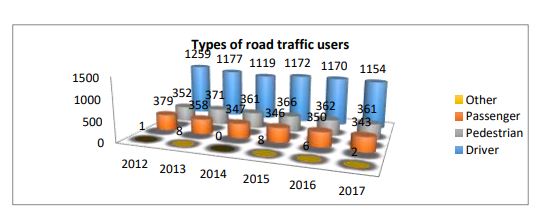
According to some statistical analyses concerning the category of traffic participants involved in
traffic accidents at regional level, Oțăt (2018) reported a considerable frequency rate of road traffic
accidents among drivers within Dolj County. Hence, we raised our students’ awareness that more than
1,100 victims belonging to the category of drivers were recorded annually, over the whole analysed period.
The second position was occupied by the number of the victims registered among pedestrians. Vehicle
passengers belong to the third group of victims registered during one calendar year (figure
2.Problem Statement
Our paper frames a computer-assisted project to train Master’s students’ critical thinking and
technological skills for the identification and analysis of the main factors that influence the dynamics of
vehicle-pedestrian accidents. To assist our students, kinematics and dynamic parameters were graphically
represented by means of the software options, such as charts and dynamic reports. At the same time, we
aimed at enhancing students’ self-reliance to accurately determine the collision parameters and develop
further critical analysis competences. After introducing our students, the initial stage of our project, to the
user-friendly interface of the software, they were challenged to resort to the software options as to export
and interpret topic-related diagrams and charts.
Preliminary input data for modelling and analysis vehicle – pedestrian impact.
To achieve the virtual modelling of the vehicle, students had to fulfil the following stages:
First, the students were assisted to set up the scenario of the traffic accident in the virtual
environment while observing the traces and the distances identified at the crime scene.
• Next, students had to establish how the traffic accident produces and to identify the collision
phases.
• During the last stage, students were asked to determine the speed of the vehicle at the time of the
impact and the projection distance of the pedestrian.
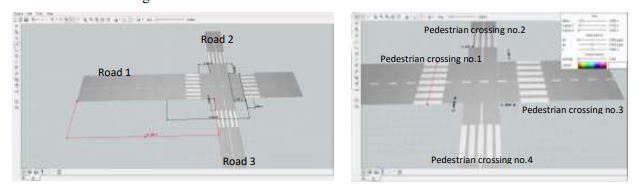
Computer-assisted road design.
Road 1: length 60 m, band width 3.5 m, 1 band by way, 2 ways of movement; longitudinal marking
consisting of: Line interrupted> Length 1 = 1.3 m, Length 2 = 1.5 m
Road 2: length 15 m, band width 2.5 m, 1 band by way, 2 ways of movement; longitudinal marking
consisting of: a continuous line interrupted at the intersection level
Road 3: length 15 m, band width 2.5 m, 1 band by way, 2 ways of movement; longitudinal marking
consisting of: a continuous line interrupted at the intersection level
Pedestrian crossing: width 4.0 m; length 1 = 0.7 m; length 2 = 0.4 m; distance from pedestrian
crossings to intersection = 3m.
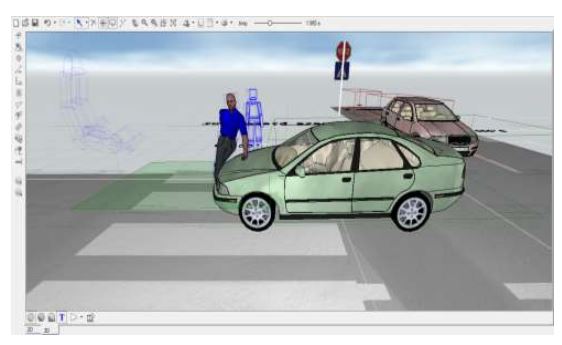
Vehicle input and setting the pre-collision parameters.
On road 3> a blue Škoda Fabia 1.4 TDI runs foreword. Just before reaching the junction, the
imminence of a danger is detected and the vehicle breaks with a deceleration of 6 m/s2, at a speed
of 15 km/h. The vehicle load is of 75 kg - the driver.
On road 1> a green Volvo S40 1.8 runs foreword at a speed of 80 km/h. Before reaching the
junction, the imminence of a danger is detected and the vehicle breaks with a deceleration of 6
m/s2, at a distance of 20 meters from the pedestrian crossing no. 3, on road 1. Vehicle load: driver
75 kg, 2 rear passengers and 100 kg in the trunk.
On pedestrian crossing no. 3 - road 1 (to the right of the junction)> a male pedestrian walks at a
speed of 4.5 km/h in a step right position. The pedestrian is positioned halfway on the pedestrian
crossing (2 m to the left and 2 m to the right).
Research Questions
After completing the stages described in the paper, the following will be established:
a. The complete road traffic accident scenario, with all necessary elements, input in the simulation
via the Virtual Crash software platform
b. The identification and presentation of the collision phases
c. The generating of the speed charts according to time and space and the determination of the
following parameters: the impact moment, the Volvo impact and post-impact speed, the speed of the
pedestrian before and after impact, the space travelled by the Volvo before and after the impact and the
projection distance of the pedestrian after the impact
The main advantage when choosing this software to model the dynamics of a road traffic accident
is the reduced time for processing the results. Furthermore, Virtual Crash software, as compared to other
specialised software, provides a user-friendly interface and intuitive interaction, hence enabling tutors to better instruct and build students’ active involvement. However, Virtual Crash software version 2.2, does
not allow users’ to analyse vehicle deformations in real time, based on computer simulation, but only in
numerical form, as this version does not include the modelling option using the finite element method.
Purpose of the Study
Designed as a case study project for 2nd year Masters’ students, we challenged and assigned our
students to determine the kinematic and dynamic parameters of a vehicle and a pedestrian involved in a
road accident. The hands-on approach adopted at this stage is aimed at familiarising students with the
toolbar, the predefined element library, and the editing option, hence assisting them to reconstruct a traffic
accident at a later phase of the project.
Research Methods
The first step in the reconstruction of a traffic accident scenario is to set up the infrastructure. For
that reason, it is necessary to design the road section considered, the road markings and the traffic signs as
to faithfully reproduce via our virtual simulation the real mode of the accident in question.
Road design.
The road design is accomplished by selecting the
working screen, students can set the desired dimensions of the road. For our project, they were asked to
consider three sections of the roadway and observe the dimensions required as input data (figure
Road markings set up.
The design of the road markings is completed by selecting the
this option is enabled, students can move a step forward in the working screen, which is positioned over
the road to reproduce the longitudinal markings (figure
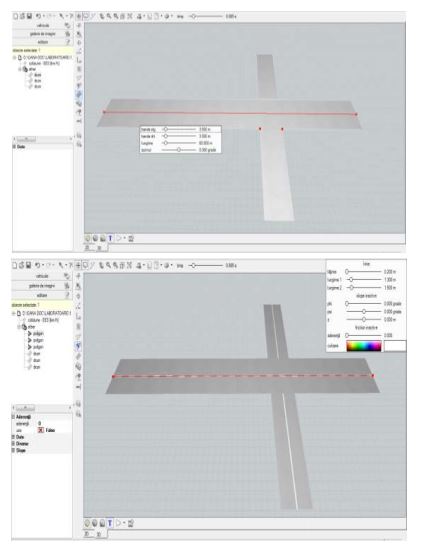
Dimensioning of the infrastructure elements.
To set the dimensions of the infrastructure elements, the students are asked to select the
Road section
A pre-set distance of 20 m until the pedestrian crossing no. 3
The determination of the pedestrian crossing no. 3 middle point, respectively 2 m to the left and 2 m to the right.
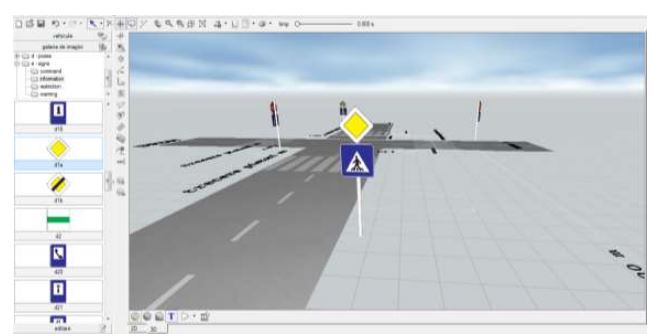
Traffic signs input.
The traffic signs are predefined in the platform library. In order to access and input them in the
traffic scenario, students are asked to enter the Image Gallery at the point
according to the category of the traffic signs (figure
students will select and hold the left mouse button (drag and drop).
Setting the pre-collision data for the traffic participants.
The Virtual Crash software provides the users with a wide library of vehicle models and categories.
To input the traffic participants, students are asked to enter the
the vehicle category needed for the simulation; the categories provided by the software encompass the
following: buses, vehicles, motorcycles, multi-bodies (pedestrians), trailers and trucks. After setting the
traffic participants into the traffic scenario, the students are assisted to set the pre-collision data for both
vehicles and the pedestrians. From the
whose data will be changed, and at the bottom of the edit menu, the window with the parameters to be input
opens: initial speed, vehicle dynamic state, acceleration value, turning angle. Also, from the Edit menu, the
students can change the geometric data, the load in the vehicle and its colour.

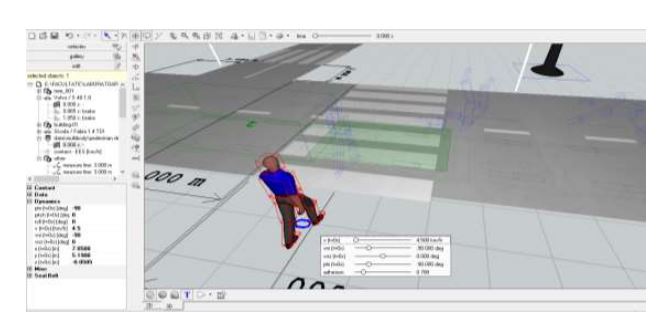
The students are taught how to set the geometric features, such as mass and height, for each
pedestrian model (figure
to be modified, and selecting the
Image Gallery - d - Poses, having identified the position, it overlaps the pedestrian that was previously
placed in the main window.
Findings
To create the simulation diagram, students are asked to click the
choose the
relationship) is illustrated. On the left side of the screen students are taught how to set the relationship as
to obtain the required values. Accordingly, they can hide or show the outputs of the two most important
comparison bases. On the horizontal axis of the diagram the outputs of time and/or space are displayed, and
on the vertical, the outputs compared to the unit display. The software automatically sets the steps, taking
the highest value as the basis. The colours of the illustrated functions are in accordance with the colours of
the corresponding vehicle. Users’ interventions on the motion parameters are signalled by the vertical lines
in the chart.
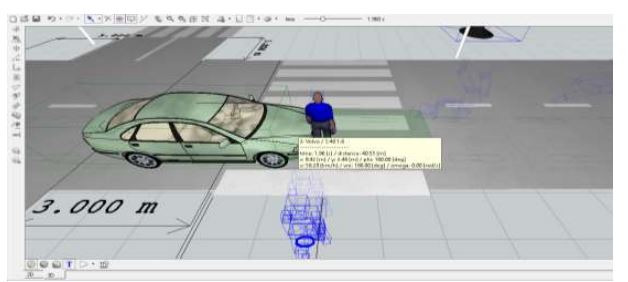
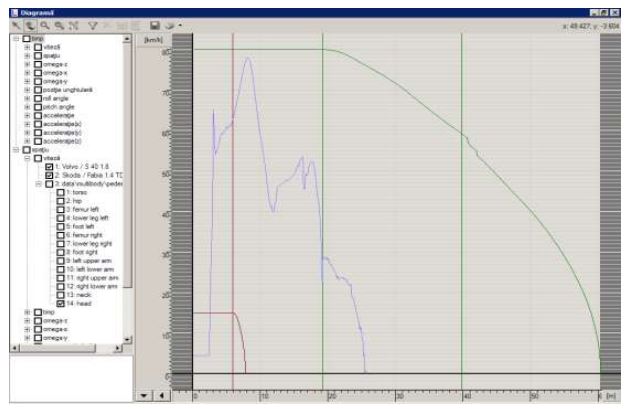
Determining the speed of the vehicle at the impact moment with the pedestrian.
To determine the vehicle’s speed when impacting the pedestrian, the Virtual Crash platform provides
users with various possibilities. The vehicle speed can be determined by means of the graphical method, by
sequentially navigating the crash phases while moving the mouse pointer over the time bar until the moment
when the first contact between the vehicle and the pedestrian occurs. Once the vehicle is selected, the
software will automatically generate a window with the vehicle parameters. As indicated in figure
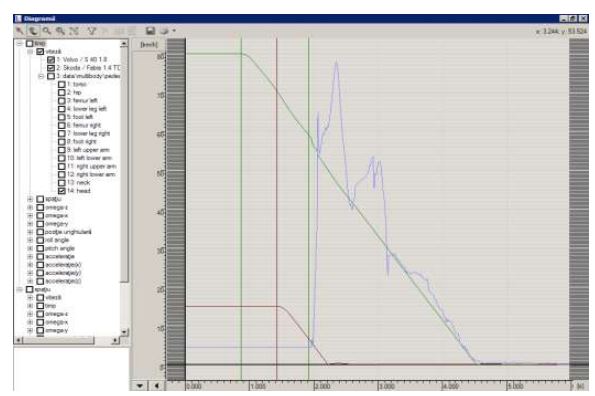
vehicle speed at the moment of impact with the pedestrian was 58.29 km/h. The second method to determine
the vehicle’s speed is by generating the speed chart over time. Once the phase of the first impact between
the vehicle and the pedestrian has been identified, the speed of the vehicle can be identified on the generated
diagram, i.e. approx. 58 km/h – figure
a multi-body. In order to generate a clearer and accessible chart, students are asked to take into consideration
only the speed in the dummy head area, see figure
The projection distance of the pedestrian following the impact.
As in the case of speed, students can resort to two variants in order to determine the pedestrian
projection distance. First, within the simulation, by selecting the dimension line option, the students can
establish the distance between the place where the first contact between the vehicle and the pedestrian
occurred and the final position, where the pedestrian was found. Appling this method, the students obtained
a pedestrian projection distance of about 22.5 m, see Figure
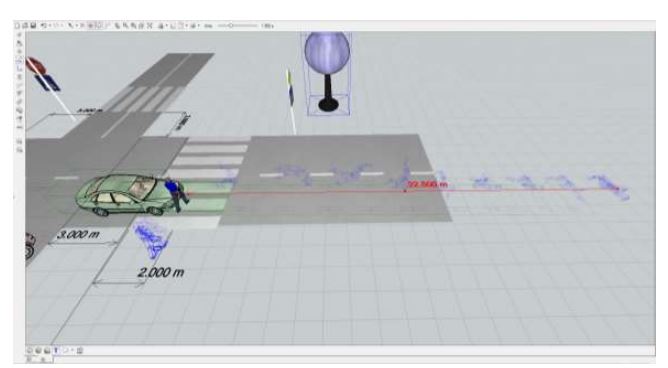
By generating the speed variation diagram according to the distance travelled, the software allowed
the students to determine the pedestrian projection distance. Figure
travelled 3 m at a constant speed until reached to the place where the accident occurred. The total space
that pedestrian travelled before and after the impact is 25.5 m. The pedestrian projection distance is obtained
by decreasing the space before the impact from the total travelled space, i.e. a distance of 22.5 m.
Subsequently, the students grew aware that the results obtained following the application of the two
methods were similar for both vehicle speed and pedestrian projection distance.
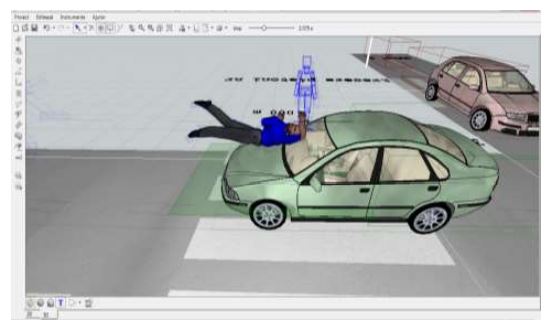
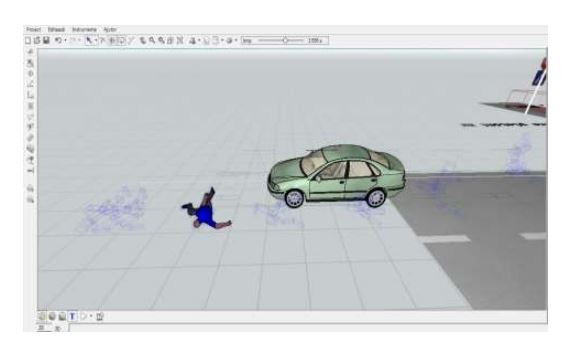
Identifying the collision phases.
Moment of impact: The first phase of the impact between the vehicle and the pedestrian is the first
contact between the traffic participants and the cause of the primary lesions suffered by the pedestrian
in the lower limbs - figure
Taking over and lifting the pedestrian: involves the taking over and lifting of the pedestrian on the
vehicle’s hood to the windscreen. Lifting the pedestrian on the road continues until the lower limbs
are lifted above the torso. The maximum point to which an adult pedestrian is lifted is located at the
boundary between the windscreen and the roof of the vehicle - figure
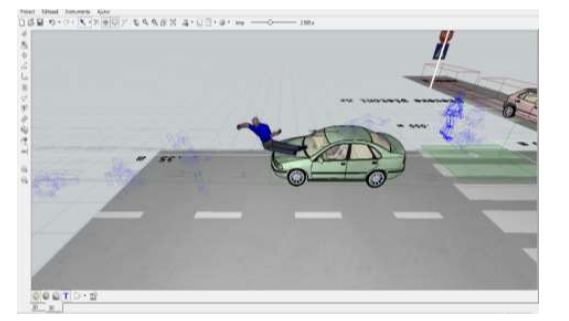
The flight phase: the pedestrian detaches from the contact with the vehicle and is projected forward -
figure
The projection of the pedestrian on the road: following the pedestrian flight phase on the vehicle’s hood,
the pedestrian is projected on the road.
The final pedestrian position: after being projected on the road, due to inertia, the pedestrian is subjected
to rotation movements on the road until it reaches the final position - figure
Conclusion
By means of the Virtual Crash software platforms we set out to train our students’ technical skills
and critical thinking in the analysis of road impacts. Adopting an inductive teaching method we aimed at
familiarising students with the Virtual Crash software features and effective outcomes. Moreover, in order
to enhance students’ self-reliance and critical thinking, we designed a series of hands-on assignments,
facing them with real-life traffic accidents situations to be solved via computer-assisted tools and virtual
modelling. At the same time, we sought to raise students’ awareness on the technological progress within
the field of accidentology, and motivate them keep-up with the latest developments, hence underpinning
long life learning and an effective professional development.
Resorting to Virtual Crash platform our students are guides to achieve a high degree of fidelity in
different scenarios of road traffic accidents. Aiming to develop students’ critical thinking and analysis,
special attention was paid to the main elements that influence the dynamics of the accident and the injuries
suffered by pedestrians, i.e. the impact speed of the vehicle, the vehicle front profile shape, the age, the
weight and height of the pedestrian
Students become familiarised with computer-assisted simulations and close connected methods as
to determine the impact and post - impact speeds for the two objects, in relation to the vehicle - pedestrian
collision model.
References
- Brandstaetter, C.Evgenikos, P.Yannis, G.Papantoniou, P.Argyropoulou , E.Broughton, J.Haddak, M. (2012). Annual Statistical Report, Deliverable of the EC FP7 project DaCoTA. European Road Safety Observatory. Loughborough University.. United Kingdom. , D3.9
- pdf Gaiginschi, R.Pintilei, M. (2006). Siguranţa circulaţiei rutiere [Road traffic safety]. Editura Tehnică, Bucureşti, Vol. II
- Oțăt, O. V. (2018). Modele dinamaice pentru analiza impactului la vehicule [Dynamic models to analyse the impact in vehicles]. Editura Universitaria.. Craiova.
- Serre , T.Masson , C.Perrin , C.Chalandon , S.Liari , M.Py , M.Cesari , D. (2007). Real accidents involving vulnerable road users: in-depth investigation, numerical simulation and experimental reconstitution with PMHS. International Journal of Crashworthiness, 3, 227-234
Copyright information

This work is licensed under a Creative Commons Attribution-NonCommercial-NoDerivatives 4.0 International License.
About this article
Publication Date
15 August 2019
Article Doi
eBook ISBN
978-1-80296-066-2
Publisher
Future Academy
Volume
67
Print ISBN (optional)
-
Edition Number
1st Edition
Pages
1-2235
Subjects
Educational strategies,teacher education, educational policy, organization of education, management of education, teacher training
Cite this article as:
Oțăt*, O. V. (2019). Traffic Management Training Via Dedicated Software. In E. Soare, & C. Langa (Eds.), Education Facing Contemporary World Issues, vol 67. European Proceedings of Social and Behavioural Sciences (pp. 1498-1510). Future Academy. https://doi.org/10.15405/epsbs.2019.08.03.184