
Regional Geography And Graphic Organisers. Geography-Specific And Didactic Competences In University


Abstract
Quality training to become a teacher is a prerequisite for a good start in the educational system. Therefore, assessing the quality of this training and improving the future teachers’ both scientific and didactic competence levels is crucial. Our research started from the observation that Geography university students at the Faculty of Geography, in Babeș-Bolyai University, from Cluj-Napoca, Romania, who train during the Psychological and Pedagogical module in order to become teachers, have difficulties in approaching Regional Geography topics. To identify the differences between their competence levels, we analysed the graphic organisers realised by these students at diverse specialisations by means of an assessment tool. Students elaborated the graphic organisers as homework. Each of these students had to realise a graphic organiser for another country. Their products were analysed according to a series of criteria: included information, data correctness, the criteria they used to classify or systemise information, etc. Findings showed the challenges these students had to cope with and their competence level in elaborating cluster-type GOs for Regional Geography topics during their university studies.
Keywords: Regional Geographyassessmentheuristic strategiesGeography teachers
Introduction
Quality training to become a teacher is a prerequisite for a good start in the educational system and institutional marketing about the provided educational services is important in attracting motivated students (Precup & Chiș, 2017). Therefore, assessing the quality of this training and improving the future teachers’ scientific and didactic competence levels is crucial (Catalano & Chiș, 2016; Chiș & Grec, 2017). In Geography, the information discovered daily increases exponentially, which is why it is necessary to develop the competence to select and organise it according to logical criteria. In the last two decades, in the Romanian geographical pre-university education system, an interest was shown in organising Regional Geography information into graphic organisers of different types (tables, clusters, tree, Venn diagram, etc.) (Dulamă, 2010) and also in representing space within map sketches (Bagoly-Simó, Dulamă, Ilovan, Kosinszki, & Răcășan, 2016).
The formation and development of the competences to process and organise information take place both in pre-university education, during Geography classes, and in Geography university courses as well. In this context, organising information is useful to showing specificity in Regional Geography and Regional Geography studies underlined that specificity is very important for understanding the territorial features and the development of regions (Ilovan, Jordan, Havadi-Nagy, & Zametter 2016b, 2016c; Scridon & Ilovan, 2016). In addition, recent research showed that feed-forward in Geography university education is crucial for improving students’ competence level (Dulamă, Ilovan, & Buş 2016a; Dulamă, Vana, & Ilovan, 2016b; Dulamă & Ilovan, 2016; Ilovan, Dulamă, Boțan, & Buș, 2016a; Ilovan et al., 2017).
Moreover, scientific literature recommends using the heuristic schemes method to record and create ideas (Buzan & Buzan, 2012, p. 20). Heuristic schemes are considered to be an effective tool that helps organise thinking, sketch and refine ideas on a topic, visualise links between them, and assemble a clear, comprehensive and meaningful structure about a certain topic (Buzan & Buzan, 2012, p. 21).
Finally, in scientific knowledge, data mining techniques are well-known knowledge discovery tools (Taniar, Dahayu, Lee, & Daly, 2008; Williams, Soares, & Gilbert, 2012). Clustering is one of them that is defined as a method in which data are divided into groups according to certain criteria and observing the similarity principle (i.e. objects in each group share more similarity than with other objects in other groups) (Havens, Bezdek, & Palaniswami, 2013). Clustering is an essential data mining and tool for analysing big data (Shirkhorshidi, Aghabozorgi, Wah, & Herawan, 2014). Considering all these, our research fills in a gap related to how university students organise information in Regional Geography.
Problem Statement
Our research started from the observation that Geography university students at the Faculty of Geography, in Babeș-Bolyai University, from Cluj-Napoca, Romania, who train during the Psychological and Pedagogical module in order to become teachers, have difficulties in approaching Regional Geography topics and in organising information employing graphics. Our hypothesis was that these difficulties were determined by the fact that these university students had trained within different specialisations in this faculty and then they had to work as a group to train for becoming teachers.
Research Questions
The research questions were: How can we establish the Geography university students’ competence level in elaborating cluster-type graphic organizers (GOs) at Regional Geography classes? What are the pieces of information about a country that university students represent when they elaborate a cluster-type GO? How do students systemize information about a country using GOs?
Purpose of the Study
The aim was to establish the Geography university students’ competence level in elaborating cluster-type GOs for Regional Geography topics.
Research Methods
Participants.
In this research, 90 students were involved. They studied at the Faculty of Geography, Babeş-Bolyai University, Cluj-Napoca: 25 students from Geography specialisation (G), 44 students from Geography of Tourism (GT), 9 students from Cartography (C), 7 students from Territorial Planning (TP), and 5 students from Hydrology-Meteorology (HM). These students have optionally attended the Psychological and Pedagogical Studies Programme, level I (single specialisation).
Assessment tool.
In order to achieve the research objectives, we analysed the cluster-type GOs made by these students, through an assessment tool (Table
Findings
In Table
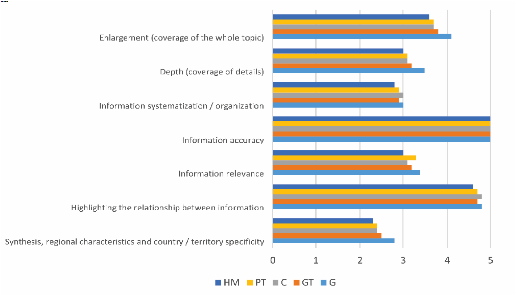
Content analysis represented in GOs
In Switzerland, from the key word “tourism” there were ramifications to the terms Events, Winter Sports, Cities and Culture without the details being included for them. Resources mentions as resources salt and timber. With Croatia, at Types of tourism, there are several categories stated (mountain, sports, summer, weekend, extreme sports, cultural, adventure), but without including details. The Cultivation of crops referred to agricultural crops (wheat, corn, citrus, sugar beet, barley, potato, vines, olive trees), but these would have been relevant if they had been cultivated extensively in Croatia, if it produced a large amount, if a particular crop had a big share in the country, if the country were a big producer in Europe or worldwide. All categories of transport (road, rail, air, naval) were mentioned for Brazil, but without details on their characteristics and specificity.
Regarding the regional characteristics and the specificity of the countries, we noticed that, in most GOs, these were not presented. However, some GOs included only the country’s regional characteristics (Iceland: the country’s territory - basalt plateaus, ≈ 100 volcanic cones, plains - restricted areas on the seaside, etc.). In other GOs, regional characteristics were mixed among detailed information (short water streams in Finland, narrow coastal plains in Japan, etc.). After analysing these GOs, other didactic activities carried out with these students insisted on the identification of the regional characteristics and the specificity of the countries. The importance of awareness and promotion of cultural diversity through the use of effective educational strategies was emphasized (Cuc, 2013a, b, Cuc, 2014).
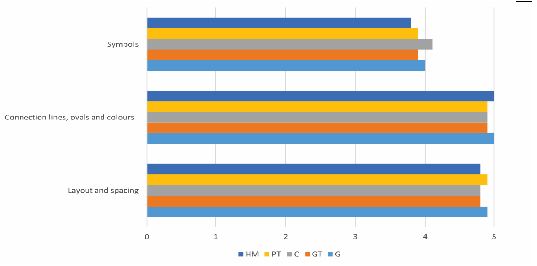
Use of mental heuristic strategies
There was a requirement for a word or phrase to be included in a circle, but not all students met this requirement. In 7% of the GOs, more information was included in a text box, indicating a lower synthesis capacity and a lack of knowledge concerning the rules, which made it more difficult to understand. At most GOs, the writing was horizontal, only at some GOs the writing was slightly oblique (even vertical), making it more difficult to read. Some GOs did not use abbreviations of cardinal points (N - North). Some GOs used abbreviations: km2, GDP, $, %, ‰. The GOs did not include any symbols other than those mentioned, especially since the use of drawings in their realisation had not been indicated. If students had used different designs, then the GOs would have been more difficult to understand by other people.
General View
Competence level
We ranked the GOs into competence categories: average of 1-2 - low competence level; average of 2.1-4.5 - medium competence level; average of 4.5-5 – high competence level.
Conclusion
Judging from the average analysis, it was noted that there were no significant differences between the students of the five specialisations/study programmes, although they had not attended the Geography of the continents / countries courses. Individual differences were explained by their general level of knowledge that they had acquired by training throughout schooling, in Geography and by differences in the quality of documentation. The results of each specialisation showed us an average competence level for the students in the achievement of a cluster-type GO concerning a country.
With regard to
Concerning
In conclusion, the clustering is an essential technique in exploring Regional Geography data about a country, by analytical methods, but also by synthetic methods of representing this data in a systematised structure based on logical criteria, observing the principles of similarity
Acknowledgments
The authors gratefully acknowledge the students’ contribution of realising the cluster-type graphic organisers.
References
- Bagoly-Simó, P., Dulamă, M.E., Ilovan, O.-R., Kosinszki, S.-A. & Răcășan, B.S. (2016). Exploring map drawing skills of Geography teacher training students. 4th ERD Conference, European Proceedings of Social and Behavioural Sciences, 18, 41-47.
- Buzan, T. & Buzan, B. (2012). Hărți mentale [Mental Maps]. Bucharest: Curtea Veche Publishing.
- Catalano, C. & Chiș, O. (2016). Comparative study between students’ teaching practice activities in Hungary and Romania. 4th ERD Conference, European Proceedings of Social and Behavioural Sciences, 18, 74-78.
- Chiș, O. & Grec, C. (2017). Valuing student’s learning styles in the development of professional skills. 5th ERD Conference, European Proceedings of Social and Behavioural Sciences, XLI, 81-85.
- Cuc, M.C. (2013a). Educational strategies to promote cultural diversity. Lumen 3rd International Conference on Logos Universality Mentality Education Novelty (LUMEN) - Current Paradigms in Social Sciences, Procedia Social and Behavioral Sciences, 92, 220-224.
- Cuc, M.C. (2013b). Ways to streamline didactic communication. Lumen 3rd International Conference on Logos Universality Mentality Education Novelty (LUMEN) - Current Paradigms in Social Sciences, Procedia Social and Behavioral Sciences, 92, 225-230.
- Cuc, M.C. (2014). Development of a communication system for capitalizing cultural diversity. 3rd Cyprus International Conference on Educational Research (CY-ICER), Procedia Social and Behavioral Sciences, 143, 63-67.
- Dulamă, M.E. & Ilovan, O.-R. (2016). How powerful is feedforward in university education? A case study in Romanian geography education on increasing learning efficiency. Educational Sciences-Theory & Practice, 16(3), 827-848.
- Dulamă, M.E. (2010). Didactică axată pe competenţe [Competence-based didactics]. Cluj-Napoca: Presa Universitară Clujeană.
- Dulamă, M.E., Ilovan, O.-R. & Buş, R.-M. (2016a). Cultural landscapes and geography university students’ learning on Facebook discussion groups. In: M. Vlada et al. (eds.), Proceedings of the 11th ICVL (pp. 50-57). Bucharest: Editura Universităţii Bucureşti.
- Dulamă, M.E., Vana, V.M. & Ilovan, O.-R. (2016b). Assessing territorial planning M.Sc. Students using Facebook. In: M. Vlada et al. (eds.), Proceedings of the 11th ICVL (pp. 66-74). Bucharest: Editura Universităţii Bucureşti.
- Havens, T.C., Bezdek, J.C. & Palaniswami, M. (2013). Scalable single linkage hierarchical clustering for big data. Intelligent Sensors, Sensor Networks and Information Processing, 2013 IEEE Eighth International Conference, 396-401.
- Ilovan, O.-R., Dulamă, M.E., Boțan, C.N. & Buș, R.M. (2016a). Using GIS in initial professional training for territorial planning during Geography university studies. In: M. Vlada et al. (eds.), Proceedings of the 11th ICVL (pp. 58-65). Bucharest: Editura Universităţii Bucureşti.
- Ilovan, O.-R., Dulamă, M.E., Boţan, C.N., Ciascai, L., Fonogea, S.-F. & Rus, G.M. (2017). Meaningful learning: Case studies on the territorial identity of historical urban centres. 5th ERD Conference, European Proceedings of Social and Behavioural Sciences, XLI, 413-421.
- Ilovan, O.-R., Jordan, P., Havadi-Nagy, K.X. & Zametter, T. (2016b). Identity matters for development: Austrian and Romanian experiences. Transylvanian Review, 25 (Supplement: 1), 261-276.
- Ilovan, O.-R., Scridon, I., Havadi-Nagy, K.X. & Huciu, D. (2016c). Tracing the Military Frontier District of Năsăud. Territorial identity and regional development. Mitteilungen der Osterreichischen Geographischen Gesellschaft, 158, 215-244.
- Precup, A. & Chiș, O. (2017). Educational marketing – academic action and identity. 5th ERD Conference, European Proceedings of Social and Behavioural Sciences, XLI, 685-691.
- Scridon, I. & Ilovan, O.-R. (2016). Approaching the Other in the Zipser community. Identity issues and methodological insights into geographical cross-cultural research. Transylvanian Review, 25(1), 55-73.
- Shirkhorshidi, A.S., Aghabozorgi, S., Wah, T.Y. & Herawan, T. (2014). Big data clustering: A review. ICCSA International Conference on Computational Science and Its Applications, 8583, 707-720.
- Taniar, D., Rahayu, W., Lee, V.C.S. & Daly, O. (2008). Exception rules in association rule mining. Appl. Math. Comput., 205(2), 735-750.
- Williams, P., Soares, C. & Gilbert, J.E. (2012). A clustering rule based approach for classification problems. Int. J. Data Warehous. Min., 8(1), 1-23.
Copyright information

This work is licensed under a Creative Commons Attribution-NonCommercial-NoDerivatives 4.0 International License.
About this article
Publication Date
25 June 2019
Article Doi
eBook ISBN
978-1-80296-062-4
Publisher
Future Academy
Volume
63
Print ISBN (optional)
-
Edition Number
1st Edition
Pages
1-613
Subjects
Teacher, teacher training, teaching skills, teaching techniques, special education, children with special needs
Cite this article as:
Koszinski, S. A., Dulamă, M. E., Ilovan, O., Scridon, I., Toderaş, A., & Popa, A. R. (2019). Regional Geography And Graphic Organisers. Geography-Specific And Didactic Competences In University. In V. Chis, & I. Albulescu (Eds.), Education, Reflection, Development – ERD 2018, vol 63. European Proceedings of Social and Behavioural Sciences (pp. 389-397). Future Academy. https://doi.org/10.15405/epsbs.2019.06.48