
Mapping Flood Prone Areas Using Sentinel-1 Satellite Imagery In Northern Kelantan, Malaysia

Abstract
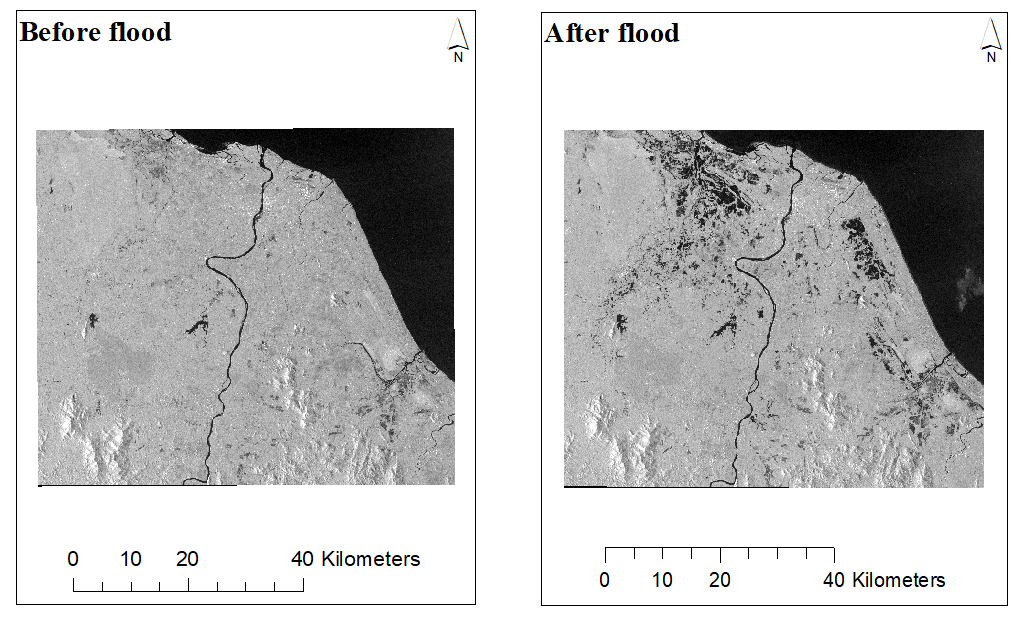
Natural hazards including landslides, flash floods, earthquakes and hurricanes have been constituted a significant problem in many countries. The most considerable natural hazard in Malaysia is flood, which mostly triggered by heavy rainfall. The recent flood in November 26, 2017 has induced many problems in northern part of Kelantan. This paper aims to map flooded areas in the region by using RADAR imagery of SENTINEL-1 without using any automated classifier. A total number of two satellite imageries of SENTINEL-1 for the dates 18/11/2017 (Before event) and 30/11/2017 (After event), were collected. However, using SENTINEL application platform (SNAP) software the images were corrected, stacked and combined in order to map flooded areas. Results indicate that this kind of flood mapping is precise, fast and easy to use. Furthermore, using confusion matrix and a hundred ground control points (GCPs) the final map was validated. The overall accuracy and Kappa coefficient was 94.5023% and 0.9189, respectively. This paper can be helpful to policy and decision makers in order to map flooded areas immediately, especially when we need quick action for settling camps for evacuees.
Keywords: Remote sensingsatellite imageryfloodKelantanMalaysia
Introduction
Natural disasters like flash floods, landslides, earthquakes, and hurricanes result in a considerable threat to human life and loss of property not only in Malaysia but also in many parts of the Globe ( Lawal, Matori, Hashim, Wan Yusof, & Chandio, 2012; Khan, Shaari, Bahar, Baten, & Nazaruddin, 2014; Rahman & Di, 2017). In Malaysia flash flood has been reported since 1800s (Adnan & Atkinson, 2011; Basarudin, Adnan, Latif, Tahir, & Syafiqah, 2014).
Flood is a very common disaster in Malaysia (Lawal et al., 2012). However, identifying the flood prone areas is highly essential for decision and policy makers for sustainable development. Because of the all-weather capability and sensitivity to the structure of flooded surface, RADAR remote sensing has made notable contribution in flood studies, (Martinez & Le Toan, 2007; Haq, Akhtar, Muhammad, Paras, & Rahmatullah, 2012; Tehrany, Pradhan, & Jebur, 2014; Dronova, Gong, Wang, & Zhong, 2015; Rosser, Leibovici, & Jackson, 2017). This study is significant in a number of ways (1), availability of SENTINEL-1 imagery online for free, (2) without using any classification algorithms we distinguished flooded areas precisely, and (3) this model rarely used by other researchers.
Many studies have been conducted using different methods and models for mapping flood susceptible areas, including analytical neural network (Pradhan & Buchroithner, 2010), analytic hierarchy process (Lawal et al., 2012), support vector machine (Tehrany et al., 2014; Tehrany, Pradhan, Mansor, & Ahmad, 2015), fuzzy logic (Jiang, Deng, Chen, Wu, & Li, 2009; Perera & Lahat, 2015), frequency ratio (Lee, Kang, & Jeon, 2012; Tehrany et al., 2015), random forest classifier (Feng, Liu, & Gong, 2015), logistic regression (Pradhan, 2010) and Neural Network Algorithm (Li, Xu, & Chen, 2016).
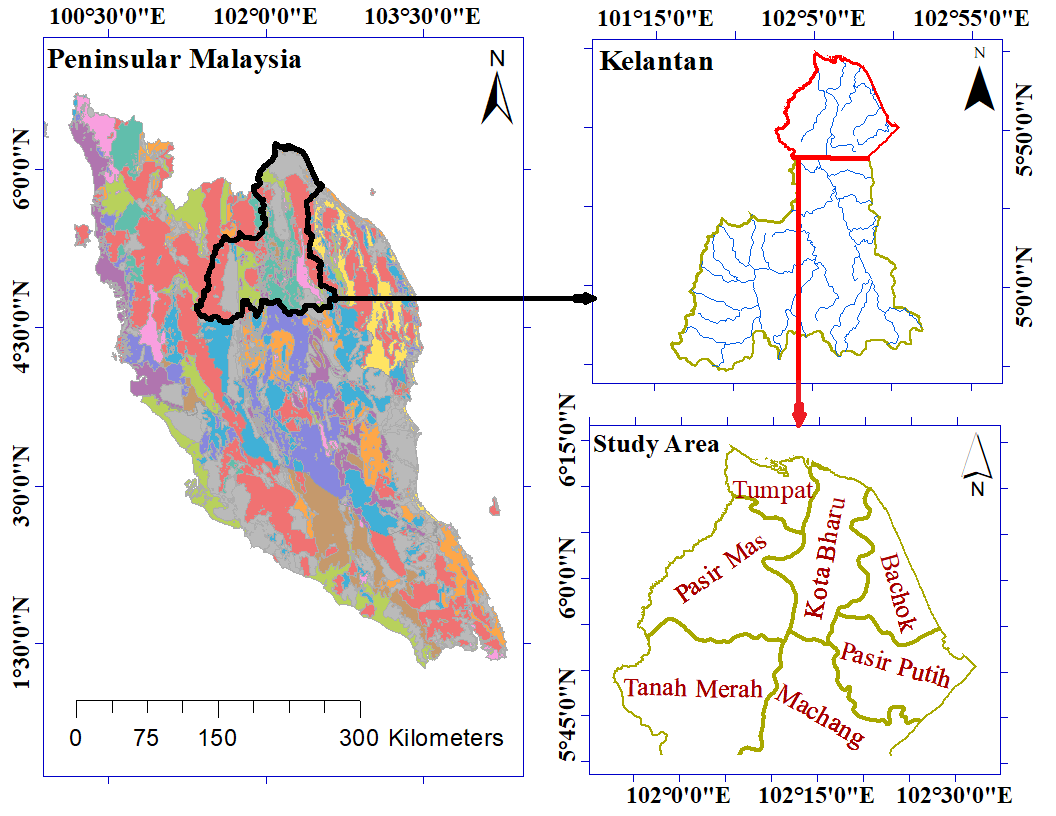
However, the main objective of the current study was to employ RADAR imagery of SENTINEL-1 to map flooded areas in northern Kelantan, Malaysia during recent heavy monsoonal rainfall in November 26, 2017. The study area with 2992.845 km2 is carried out in northern part of Kelantan, with Longitudes 101˚ 53’ 00” E to 102˚ 32’ 00’’E and Latitudes 5˚ 41’ 00’’ N to 6˚ 15’ 00’’ N. After heavy rainfall in 26th November 2017 the Kelantan faced destructive flood, therefore this area was selected as study area (Figure
Problem Statement
Flood is one of the common phenomenon in most of Malaysian urban and surrounding areas, which normally happened from November to March (Malczewski, 2004; Tehrany et al., 2014). Kelantan has been faced flooding almost every year, which is seen as common natural disaster in the region. Most recent one occurred in November 26, 2017 and continued for almost three days, which caused evacuation of around 11,880 people during flooding days and millions of dollars damage to properties (https://www.thestar.com.my, 2017). However, these problems can be addressed, provided that effective planning and detailed studies are taken.
Research Questions
Concern with many limitations and problems of flood susceptibility mapping and the research objective described in the introduction section, this study endeavored to investigate the following research question.
Is it possible to use remotely sensed RADAR data of SENTINEL-1 (In C-band with 5.7 centimeter wavelength), to derive areas prone to flood in the cloudy regions like Kelantan, Malaysia?
Purpose of the Study
Generally, there are many reports on destructive flooding in Malaysia. Malaysia has seen major floods in the recent decades (Kia et al., 2012). Most recent one occurred in November 26, 2017 in Kelantan, which severely affected locals. Fully control of these kind of floods in Malaysia is a challenging task to a great extent (Pradhan & Youssef, 2011; Kia et al., 2012). On the other hand, flooding occurs every year in many parts of the country, including Kelantan. Despite this fact that flood events are generally unavoidable (Pradhan & Youssef, 2011), however, policy and decision makers should not be easy-going on this matter and try to reduce the fatalities and damages from such events in near and remote future.
The first action is mapping areas prone to flood, where policy makers can do preventive actions, including to settle lifeguards in high susceptible areas, to act against unlicensed housing in high susceptible regions, and to build shields on high sensitive river banks. Therefore, in order to prevent such future disasters there is highly a need to develop an accurate technique to map areas prone to flood. However, in this study by using RADAR imagery of SENTINEL-1 areas prone to flood were mapped, which can be valuable for authorities to consider it in the preventive actions in the study area
Research Methods
Database and Data Acquisition
SENTINEL-1 satellite data with sun-synchronized and 12 days repeat cycle as well as capability of imaging in C-band, was successfully launched in April 2014 ( Geudtner, Torres, Snoeij, Davidson, & Rommen, 2014). In this study based on the occurred flood we acquired a pair of SENTINEL-1 satellite images for the study area (One before and one after the event). Both data were downloaded through scihub.copernicus.eu website. Table
Data Pre-processing and Processing
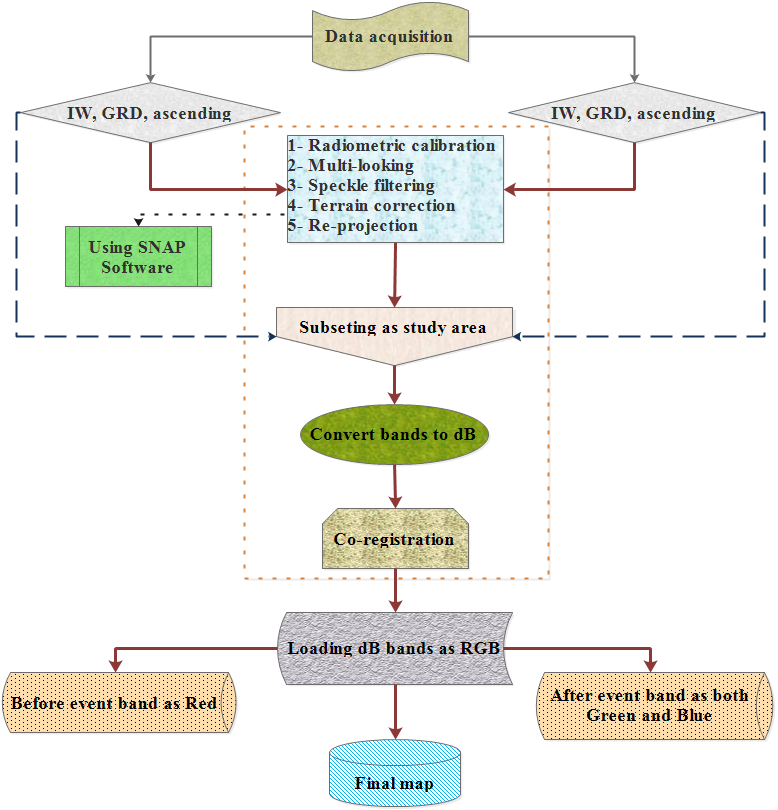
In order to extract the accurate information, once satellite imageries have been collected then pre-processing must be applied on them (Jensen & Lulla, 1987). However, using SNAP software either images were radiometrically corrected, multi-looked and filtered. Moreover, before projected to Universal Transverse Mercator (UTM) coordinate system, they were geo-referenced (Figure
After correction process, for saving time it is better to clip imageries as the study area. In order to place the maximum accuracy we loaded either imageries in decibels (dB). Furthermore, for combining bands of both satellite images they must be stacked. Therefore, we can separate flooded area by selecting dB band of before event imagery as Red and dB band of after event image for both Green and Blue in RGB band combination (Figure
Validation
Confusion matrix as an acceptable method (Fitzgerald & Lees, 1994), was utilized to validate statistical classification of the current research. Therefore 100 ground control points (GCPs) were extracted from field survey and used for validation. The overall accuracy was calculated according to the Smith et al. (1999) equation.
(1)
Where: OA = Total accuracy, N = Total test pixels, and

Equation 2 the Kappa coefficient.
(2)
Where: k is kappa coefficient and q is unclassified pixels.
Findings
Figure
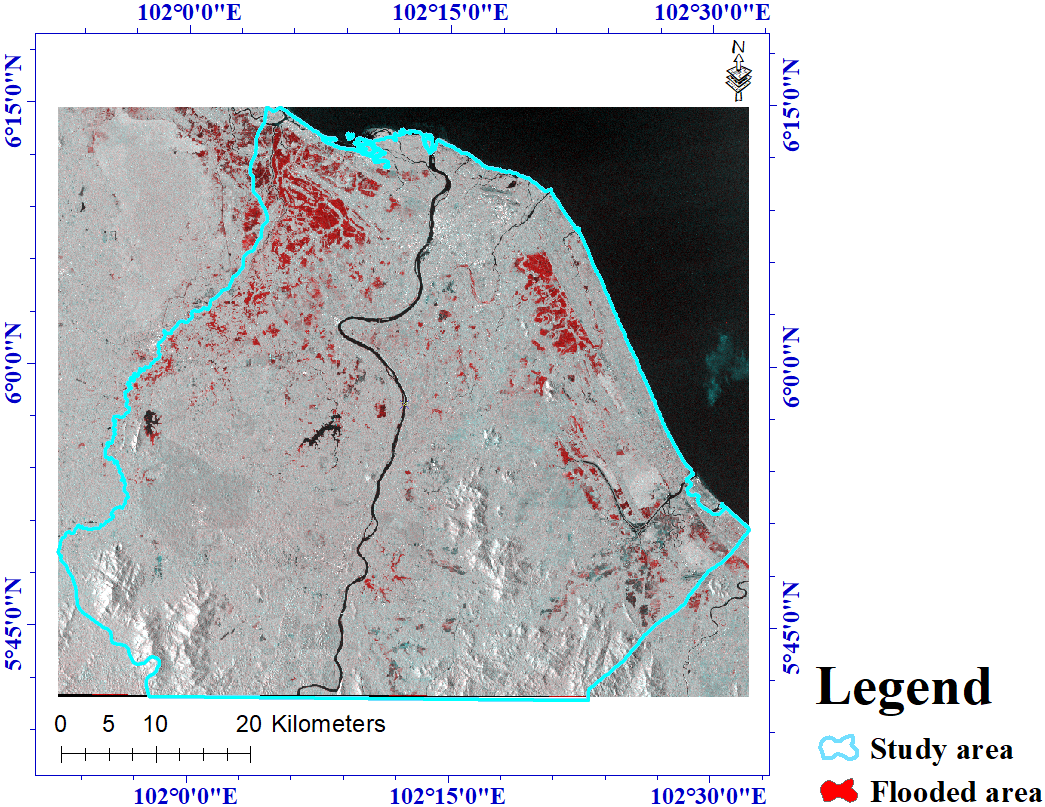
The overall accuracy and Kappa coefficient prove that this model is reliable for mapping flooded areas, especially when we need quick reactions to address the problem and settle the evacuees. Table
Conclusion
The most common disaster in the entire of Malaysia is flooding, which mostly induced by heavy rainfall. The recent flood in November 26, 2017 have resulted in many problems in northern part of Kelantan. In this paper we have shown how to map flooded areas in the region by using RADAR imagery of SENTINEL-1 without using any automated classifier. Two RADAR satellite imagery of SENTINEL-1 for the dates 18/11/2017 (Before event) and 30/11/2017 (After event), were collected through scihub.copernicus.eu website. These data through SNAP software were corrected, stacked and combined in order to map flooded areas.
Then the imageries were clipped as the study area. For obtaining the maximum accuracy we loaded either imageries in decibels (dB). Furthermore, for combining either satellite images they were stacked and in order to map flooded areas they were loaded in RGB combination. Moreover, this kind of flood mapping is precise, fast and easy to use. Especially when we need to map flooded area immediately to settle evacuees in safer places. Eventually, using confusion matrix and 100 GCPs the final map was validated, where, overall accuracy and Kappa coefficient was 94.5023% and 0.9189, respectively.
Acknowledgments
The authors wish to express their sincere thanks to Universiti Teknologi Malaysia (UTM) based on Research University Grant (Q.J130000.2527.17H84) for their financial supports.
References
- Adnan, N. A., & Atkinson, P. M. (2011). Exploring the impact of climate and land use changes on streamflow trends in a monsoon catchment. International journal of climatology, 31(6), 815-831.
- Basarudin, Z., Adnan, N. A., Latif, A. R. A., Tahir, W., & Syafiqah, N. (2014). Event-based rainfall-runoff modelling of the Kelantan River Basin. Paper presented at the IOP conference series: earth and environmental science.
- Dronova, I., Gong, P., Wang, L., & Zhong, L. (2015). Mapping dynamic cover types in a large seasonally flooded wetland using extended principal component analysis and object-based classification. Remote Sensing of Environment, 158, 193-206.
- Feng, Q., Liu, J., & Gong, J. (2015). Urban flood mapping based on unmanned aerial vehicle remote sensing and random forest classifier—A case of Yuyao, China. Water, 7(4), 1437-1455.
- Fitzgerald, R., & Lees, B. (1994). Assessing the classification accuracy of multisource remote sensing data. Remote Sensing of Environment, 47(3), 362-368.
- Geudtner, D., Torres, R., Snoeij, P., Davidson, M., & Rommen, B. (2014). Sentinel-1 system capabilities and applications. Paper presented at the Geoscience and Remote Sensing Symposium (IGARSS), 2014 IEEE International.
- Haq, M., Akhtar, M., Muhammad, S., Paras, S., & Rahmatullah, J. (2012). Techniques of Remote Sensing and GIS for flood monitoring and damage assessment: A case study of Sindh province, Pakistan. The Egyptian Journal of Remote Sensing and Space Science, 15(2), 135-141.
- https://www.thestar.com.my. (2017). Floods getting worse in Kelantan and Terengganu the star online.
- Jensen, J. R., & Lulla, K. (1987). Introductory digital image processing: a remote sensing perspective.
- Jiang, W., Deng, L., Chen, L., Wu, J., & Li, J. (2009). Risk assessment and validation of flood disaster based on fuzzy mathematics. Progress in Natural Science, 19(10), 1419-1425.
- Khan, M. M. A., Shaari, N. A. B., Bahar, A. M. A., Baten, M. A., & Nazaruddin, D. A. B. (2014). Flood impact assessment in Kota Bharu, Malaysia: a statistical analysis. World Applied Sciences Journal, 32(4), 626-634.
- Kia, M. B., Pirasteh, S., Pradhan, B., Mahmud, A. R., Sulaiman, W. N. A., & Moradi, A. (2012). An artificial neural network model for flood simulation using GIS: Johor River Basin, Malaysia. Environmental Earth Sciences, 67(1), 251-264.
- Lawal, D. U., Matori, A. N., Hashim, A. M., Wan Yusof, K., & Chandio, I. A. (2012). Detecting flood susceptible areas using GIS-based analytic hierarchy process.
- Lee, M.-J., Kang, J.-e., & Jeon, S. (2012). Application of frequency ratio model and validation for predictive flooded area susceptibility mapping using GIS. Paper presented at the Geoscience and Remote Sensing Symposium (IGARSS), 2012 IEEE International.
- Li, L., Xu, T., & Chen, Y. (2016). Improved urban flooding mapping from remote sensing images using generalized regression neural network-based super-resolution algorithm. Remote Sensing, 8(8), 625.
- Malczewski, J. (2004). GIS-based land-use suitability analysis: a critical overview. Progress in planning, 62(1), 3-65.
- Martinez, J.-M., & Le Toan, T. (2007). Mapping of flood dynamics and spatial distribution of vegetation in the Amazon floodplain using multitemporal SAR data. Remote Sensing of Environment, 108(3), 209-223.
- Oliver, C., & Quegan, S. (2004). Understanding synthetic aperture radar images: SciTech Publishing.
- Perera, E. D. P., & Lahat, L. (2015). Fuzzy logic based flood forecasting model for the Kelantan River basin, Malaysia. Journal of Hydro-environment Research, 9(4), 542-553.
- Pradhan, B. (2010). Flood susceptible mapping and risk area delineation using logistic regression, GIS and remote sensing. Journal of Spatial Hydrology, 9(2).
- Pradhan, B., & Buchroithner, M. F. (2010). Comparison and validation of landslide susceptibility maps using an artificial neural network model for three test areas in Malaysia. Environmental & Engineering Geoscience, 16(2), 107-126.
- Pradhan, B., & Youssef, A. (2011). A 100‐year maximum flood susceptibility mapping using integrated hydrological and hydrodynamic models: Kelantan River Corridor, Malaysia. Journal of Flood Risk Management, 4(3), 189-202.
- Rahman, M. S., & Di, L. (2017). The state of the art of spaceborne remote sensing in flood management. Natural Hazards, 85(2), 1223-1248.
- Rosser, J. F., Leibovici, D., & Jackson, M. (2017). Rapid flood inundation mapping using social media, remote sensing and topographic data. Natural Hazards, 87(1), 103-120.
- Tehrany, M. S., Pradhan, B., & Jebur, M. N. (2014). Flood susceptibility mapping using a novel ensemble weights-of-evidence and support vector machine models in GIS. Journal of hydrology, 512, 332-343.
- Tehrany, M. S., Pradhan, B., Mansor, S., & Ahmad, N. (2015). Flood susceptibility assessment using GIS-based support vector machine model with different kernel types. Catena, 125, 91-101.
Copyright information

This work is licensed under a Creative Commons Attribution-NonCommercial-NoDerivatives 4.0 International License.
About this article
Publication Date
17 May 2019
Article Doi
eBook ISBN
978-1-80296-061-7
Publisher
Future Academy
Volume
62
Print ISBN (optional)
-
Edition Number
1st Edition
Pages
1-539
Subjects
Business, innovation, sustainability, environment, green business, environmental issues
Cite this article as:
Shahabi, H., Bin Ahmad, B., & Mohammadi *, A. (2019). Mapping Flood Prone Areas Using Sentinel-1 Satellite Imagery In Northern Kelantan, Malaysia. In M. Imran Qureshi (Ed.), Technology & Society: A Multidisciplinary Pathway for Sustainable Development, vol 62. European Proceedings of Social and Behavioural Sciences (pp. 508-514). Future Academy. https://doi.org/10.15405/epsbs.2019.05.02.50