
Enhanced Radon Transform Skew Estimation And Correctıon Algorithm For Scanned Multiple-Choice Forms

Abstract
As an extension of our previous work this paper presents an enhanced skew estimation and correction algorithm for multiple-choice (MC) forms. It involves a synergy of the Radon Transform with high precision hit-and-miss algorithm in determining the amount of skew in MC form images, prior to optical mark recognition (OMR) which require properly aligned text lines and edges. As other existing Radon transform based techniques resolve to determining skew angles based on only a single peak regardless of its efficacy, the proposed algorithm first detects the nature of the form (either standard OMR or customized design) and then automatically optimize the selection process for the number of peaks necessary for the estimation of the correct skew. Skew in this context refers to the tilt or in-alignment of edges in degree which is neither parallel nor at right angles to a specified or implied boarder. It is therefore essential to detect and correct the skew at the pre-processing stage in order to avoid perturbation of skew during further processing and extraction of answers. Experiments on various form designs were conducted and an overall accuracy of 98.9% across all experiments has been achieved which shows the superiority of the proposed algorithm. Furthermore, a comparative analysis with other reported algorithms has been made to prove the efficacy of the proposed technique. This technique works well in correcting the skew even with lower resolution images and on those with background variations such as blurring, thus in-line with the future use of phone camera images.
Keywords: Skew DetectionRadon TransformOptical Mark RecognitionMultiple-Choice
Introduction
With the advent of the Optical Mark Recognition (OMR) software packages (FORMRETURN, 2018) that produce and mark multiple-choice based (MCB) test forms, various designs, formats and patterns of such forms exist and are widely been used for assessments in various institutions like schools and in survey. Images of the completed forms are normally acquired through scanning or by using handheld cameras. Pre-processing as prior stage to the OMR is tasked with enhancing the quality of the acquired images to boost the answer extraction process and also to ensure the accuracy of the OMR answer extraction technique (Abdu & Mokji, 2012). In this stage, the process of attenuating the undesirable attributes such as the skew from the input image takes place, and this paves way to an errorless result at the output. The common pre-processing algorithms include the Hough transform approach (Gari, Khaissidi, Mrabti, Chenouni, & El Yacoubi, 2017), projection profile based (Jain & Borah, 2014), regression analysis, bounding box approach (Shafii & Sid-Ahmed, 2015), and connected component analysis (Sarfraz, Mahmoud, & Rasheed, 2007).
Document Skew
To begin the literature, document skew is an undesirable tilt or offset from the centre-line by a certain degree of a scanned document image observed after capture. It had been broadly classified into three groups; global skew, multiple skew, and non-uniform text line skew (Abdu, 2013). Variation of the degree of skew however, plus the orientation, size and nature of the objects in the document image play a vital role in the choice of technique or method employed and its accuracy. A detailed survey of over 50 various skew detection algorithms was given in (Hull, 1998). These classes largely include projection profile analysis (Papandreou & Gatos, 2011), the connected component analysis (Sarfraz et al., 2007), and more recently Radon and Hough transform methods (Gari et al., 2017; Rajput, Som, & Kar, 2016).
Related Literature
The traditional projection profile analysis was among the earliest method where the input image is rotated through a range of angles (Jain & Borah, 2014; Papandreou & Gatos, 2011). At each angle, the projection profile features of objects in the image are evaluated using a criterion function (Jain & Borah, 2014). The function would then reach its maximum value when the projection profile is evaluated at the correct skew angle. The skew angle can easily be determined by analysing the maximum of the function. The projection profile technique is one of the most effective approaches to skew estimation but is often subject to low performance and accuracy when the document image contains noise, graphics, and or the amount of text objects is sparse (Gaofeng, Chunhong, Nanning, & Chen, 2010).
The nearest neighbour clustering based method (Konya, Eickeler, & Seibert, 2010) is similar to the connected component analysis technique as it also involves connected components (objects). In this method, for each identified object, the direction of its nearest neighbour is estimated and accumulated in a histogram. The angle corresponding to the maximum peak of the histogram is extracted as the relevant image skew. This kind of process is generally slow however, explicitly when the time it takes for labelling the objects in the binary image is determined by O(n^2 ), where n is the number of objects (Gaofeng et al., 2010). Moreover, to avoid the extraction of a false peak graphic objects must first be filtered out from the image (Konya et al., 2010).
Principal connected component analysis on the other hand is solemnly based on finding the orientation along which the largest variation of objects occurs (Sarfraz et al., 2007). The objects can be labelled depending on the connectivity of the pixels that make up an object or inform of their enclosing bounding boxes. Once an object has been classified as a connected component, each object's orientation is estimated through computation by getting the angle between the x-axis and the major ellipse that has the same second moments as the object. A skew detection algorithm that uses this method starts by first dilating the input binarized image as in the case of the projection profile technique and then getting the orientation of each object (Dhandra, Malemath, Mallikarjun, & Hegadi, 2006). The final skew angle is determined by taking the average of all the orientations. In this method, however, ambiguities may arise in the case of non-uniform text line or if the input image contains graphics of varying shapes and sizes not to mention different orientations. Therefore, considering the average of all the objects' orientation does not seem to be a suitable approach as some MC forms contain no text objects while others may have the text, but not significant enough to provide the correct orientation or with a different orientation with the main concerned answer regions. Other methods employ the use of trigonometric formulae, histograms processing and the concept of Euclidean distance all applied to the bounding box enclosing a defined area in the input image (Sarfraz et al., 2007; Shafii & Sid-Ahmed, 2015). The calculated slope between extreme opposite corners of the bounding box was used to get the resulting skew variation.
The Radon transform can transform images with lines into a space range (or Radon space) of potential line quantities, with each line giving a peak or a valley in the space (Toft, 1996). Bright lines give peaks while dark lines give valleys. It is also found to be less sensitive to noise compared to other techniques such as the Hough transform as the noise tends to be attenuated during the process of integration. The compactness of the Radon transform had led to many line detection algorithms (Qiaoping & Couloigner, 2007; Rajput et al., 2016; Ramandi, Faez, & Ardekani, 2012; Sari, Suksmono, & Iwut, 2011). However, the Radon transform does not always produce suitable peaks (Qiaoping & Couloigner, 2007). Some of the techniques e.g. (Ramandi et al., 2012) that use this method apply dilation first on the binarized document image to make the text objects into a single line before taking its radon transform, while others (e.g. (Aithal, Rajesh, Siddalingaswamy, & Acharya, 2011)) detect the edges and rotation (Rajput et al., 2016). Each line in the image would give a peak in the case of a bright line which can then be extracted to determine the skew. The current traditional Radon transform methods such as the ones in (Rajput et al., 2016; Ramandi et al., 2012) rely on this phenomenon and resolve to directly extracting a single maximum peak and set its corresponding angle as the basis for the correct skew. Thus, inaccurate peaks may be extracted, especially in cases where there are no or non-uniform text in the input image such as that of a MCB form and this will eventually lead to non-determination of the correct skew. However, the typical Radon transform does not always produce suitable peaks especially when the image contains linear features of short extent, or when the linear features that have a long span exhibit curvature features (Gaofeng et al., 2010).
In our previous method, the problem of peak selection was solved by extracting the peaks and their corresponding angles based on two scenarios: for a MC form that contains a significant amount of straight line parameters (long linear features) the Radon peak value extracted will be high, and on the other hand if there is no presence of the line parameters or the amount is insignificant then the peak would be low (Abdu, 2013). If the first case holds true, it would mean that the form is a standard OMR based design and that the first extracted peak would be enough to determine the skew. However, if the later holds true, the form would be categorized as a customized (custom) OMR based. A threshold value is set to extract the correct peak and angle in either case. When the maximum peak value is greater than the threshold, it is extracted as the correct peak and used for the determination of the skew; but when the maximum radon peak is less than the threshold value, two more peaks are taken, and an interpolation is performed between the three peaks to determine the correct skew. The MC form image can then be corrected using the estimated skew as the amount and direction of rotation in degree.
The rest of the paper is organized as follows: Section
Problem Statement
The image acquiring devices such as scanners and hand-held phones are known to be prone to image variations such as skew (Gaofeng et al., 2010) and blur. The acquiring process, especially when many forms are involved, usually acquire the use of automatic document feeder (ADF) scanner. This makes the subsequent number of operations at an instant large which nonetheless leads to unavoidable amount of skew (Abdu & Mokji, 2012). Even greater skew would be realized in the case of a flatbed scanner and phone cameras. It is then obvious that these errors from the image acquisition stage if not treated will cascade to subsequent processes and will drastically affect the performance of the OMR (Abdu, 2013).
Existing methods
There are a different variety of techniques that have been proposed as reviewed in literature for the estimation and correction of skew in scanned document images (Aithal et al., 2011; Boukharouba, 2017; Dhandra et al., 2006; Gaofeng et al., 2010; Gari et al., 2017; Haji, James, & Chandran, 2016; Wagdy, Faye, & Rohaya, 2014). However, these approaches mainly focus on document images; specifically, images that contain a significant amount of text characters with the assumption that the text direction is the same as that of the border line. Moreover, it is assumed that the text orientation determines the orientation of the whole document. A notion that was found to not always be true in the case of MC forms. While this may be true for MC test or survey forms having text with orientation the same as the answer regions, it would not be the case for forms having independent text and answer regions orientations such as those that are customize for specific use. Hence these algorithms performed poorly in such case and would not be suitable for MCB forms.
Previous method
Our previously proposed work using Radon transform overcame the limitation of using a single extracted peak for detection of the skew but did not restrict the domain for which other relevant peaks would be extracted. Due to this the other peaks can be randomly extracted from any domain when the first maximum radon peak is less than the threshold value as it was not fine-tuned for camera images. This greatly limits the inherent capacity of the algorithm to accurately give the correct skew.
Research Questions
General Concept
The idea is to use simplified algorithms capable of performing the task at hand with less complexity. What algorithm would be suitable for application?
Towards Current and Future Applications
In this era of enhance mobile smart phones equipped with high-end cameras assessing MC forms on a mobile can be as easily as snapping a picture provided errors from capture are reduced to the barest minimum. What simplified way would be to reduce assessment error?
Purpose of the Study
This paper presents the enhanced high precision Radon transform based skew estimation and correction technique specifically fine-tuned for camera phone captured MC form images to simplify assessment on mobile phones and towards future use. This proposed technique is an enhanced version of the earlier reported work in (Abdu, 2013) aimed at reducing complexity while maintain high inherent capacity. The problem of extracting other random peaks not related to the centralized peaks has been solved through a hit-and-miss algorithm implementation that ensures that each extracted peak belongs within the centralized domain. A deburring filter has also been implemented after the normalization stage for better edge detection. It showed to be fast and more accurate in calculating the exact skew having been fine-tuned to handle low resolution images such as those captured using mobile phone cameras.
Research Methods

Two MC form designs were used for all the experiments, the tagged standard OMR design contains line grids or border lines enclosing answer bubbles with dark markers on either edge of the form (see Figure
Pre-processing
The MC forms images were acquired using ADF scanner and phone cameras. Hence, it is assumed here that the skew in the resulting images would not vary by more than ±6º and may contain some degree of blur. Phone camera images particularly were first manually cropped to remove the background. Normalization is the first step, resizing the images into specific ratio; this is necessary because images captured may vary in sizes especially when they are captured at different resolutions. A fixed value was chosen for the column size (W) while the row size (L) is automatically calculated to fit normal A4 size. Hence the column size is fixed at 750 and the scaling ratio between the horizontal and vertical dimensions is maintained at (1:1.3). Experiments in this perspective also showed that the larger the image size the less sharp it will be and this reduces the edge detection as compared to a smaller sized image. Smaller size images also make the processing faster. Larger images are down-scaled while smaller sized images are up-scaled. The un-sharp masking is used to counter the blur effect and sharpens the MC form image by amplifying the border and edge pixels. Sharpening is achieved by first smoothening the input image using a Gaussian, which results in a further smoothed image . The result is then subtracted from the input image itself to get a filter mask . The mask is then finally added back to the original input image resulting in a de-blurred image . This expression is given by (Abdu, 2013):
(1) (2)
This method also effectively increases the contrast along the edges without much computation compare to other sharpening methods. The de-blurred image is then binarized using Otsu's thresholding method (OTSU, 1979) applied locally, after which the edges are detected using an edge detection algorithm. There are several techniques of edge detection in existence (Basu, 2002), but for this paper, Canny (1986) edge detector was used. It is pertinent to minimize computation complexities while maintaining robustness and thus, simple basic algorithms were employed to achieve the desired pre-processing results.
Radon Transform and Peaks Extraction
The Radon transform of the 2-D normalized image represented as a function in Euclidean space can be defined by (Qiaoping & Couloigner, 2007):
(3)
and represented in discrete form as:
(4)
where is a Dirac function that will result in a nonfinite value when the statement is zero and a zero for all other statements (it integrates to one).
The term in the Dirac function in equation (3) & (4) forces the integration of along the line defined by equation (5).
(5)
Therefore,
yields the projections across
at varying orientations
and offsets
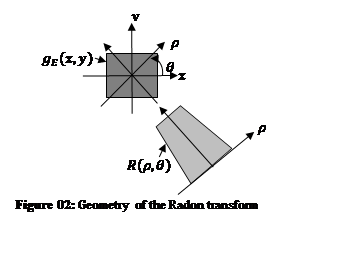
along parallel paths or beams. The parallel beams are spaced 1-pixel unit apart with the source of rotation around the centre of the image. The geometry of the radon transform is illustrated in Figure
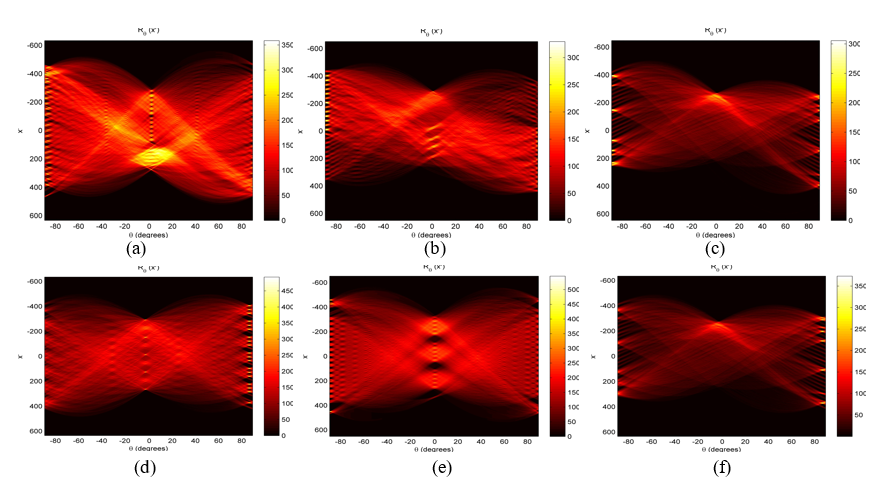
The Radon transform would then contain a peak corresponding to every line in the image that is brighter than its surroundings and a valley for dark lines. Thus, detecting the lines would simply mean to detect the peaks and valleys in the space, which can easily be done by setting up a threshold that will extract the maximum peak. For this experiment and given the nature of the normalized MC form image the Radon transform was then taken across an angle range of 180º (-90:89) sufficient for .
Figure
A threshold value “ ” based on experiments on the number of pixels contained in a single straight line was used to distinguish between the two designs of MC form (standard and customized). This threshold value was fixed, since the image has already been normalized to fixed pixel dimensions. If the detection of the first (standard OMR) design fails, such that , the same scenario used in our previous work is applied here for the other two peaks but from the center domain in terms of their magnitude. That is, both peaks must be centralized peaks having similar magnitude. The final skew angle is then calculated using the three angles corresponding to the three extracted peaks such that (Abdu, 2013).
While the condition for extracting the relevant peaks was restricted to magnitude weight, however, the domain selection became prone to variability. Relevant peaks with smaller magnitudes from the centralized domain get ignored for others with larger magnitude like from other domains. The algorithm often selects these peaks not related to the centralized peaks, resulting in a false .
Hit-and-miss Algorithm
Adding the hit-and-miss algorithm enhances the skew detection algorithm by constraining the peak selection to only the centralized domain of the Radon space. Two criteria were set such that each of the two additional peaks must be tested to satisfy as a relevant peak. Peaks that do not fulfill are discarded and the process repeats until the relevance is achieved. The first measure is the magnitude, where each extracted peak must satisfy the threshold condition for the custom OMR form. This can be interpreted as . The second measure is the domain, such that where is the centralized Radon space domain. The correction procedure is whereby the image border line is rotated by degree of the amount of skew estimated. The boundary of the image is further adjusted to maintain its original size.
Results and Findings
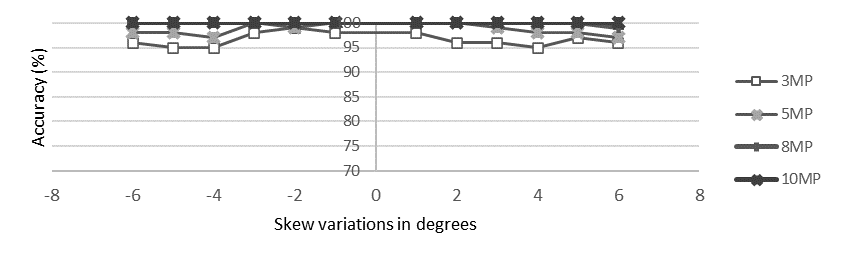
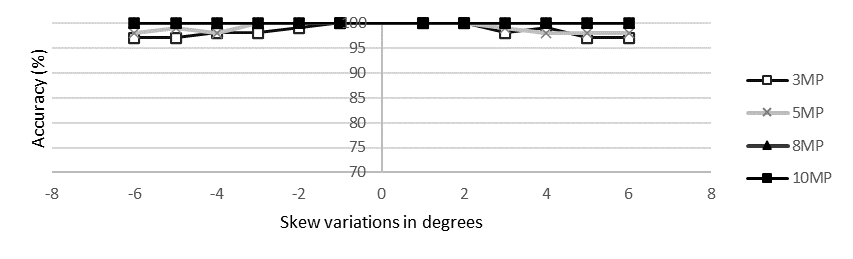
The proposed algorithm was tested on a total of 400 sample images (300 with ADF scanner and 150 with phone camera). Six (6) different types of MC form designs (3 custom and 3 standard OMR) were acquired. Each sample form was scanned at four (4) different resolutions, and each resolution with twelve (12) skew variations
. The graphs in Figures
Please replace this text with context of your paper.
Please replace this text with context of your paper.
Please replace this text with context of your paper.
Please replace this text with context of your paper.
Please replace this text with context of your paper.
Please replace this text with context of your paper.
Most of the reported works were tuned for document images, and thus the basis for comparison can be trivial. Regardless, the most common methods based on traditional Radon transform (Aithal et al., 2011; Rajput et al., 2016; Ramandi et al., 2012) and bounding box algorithms have been replicated in this research paper and compared with the proposed enhanced algorithm. The results are shown in Table
Results showed an excellent overall performance of the proposed enhanced algorithm at 98.9%. The least accuracy was 95% (in the case of phone camera images at 3MP). One observed reason is in the case of custom OMR based forms which have fewer line patterns, this makes the result slightly prone to error. Another reason is that when additional peaks need to be extracted as in the case of lower resolution images, the degree of blur becomes significantly higher affecting the edge detection algorithm leading to higher amount of biased and un-sharp peaks. Although, it is very unlikely that 3MP resolution setting be used since mobile phones come equipped with 5MP and higher resolution cameras. Thus, this limitation can be considered insignificant to the robustness of the proposed method with an average accuracy of 98.83% at 5MP, 99.98% at 8MP, and 100% at 10MP for both ADF and phone camera images.
The Bounding box algorithm performed the least with 53%. A logical reason for this is that for the correct orientation to be determined, the formed bounding box must be a trapezoid (two opposite sides parallel). The algorithm uses the concept of parallel lines theorem to form an equiangular rectangle from the formed bounding box. With most of the MC form images containing graphics (answer bubbles) as the only and or dominant objects, a trapezoid could not always be formed. The normal Radon transform approach uses a similar technique as that of (Aithal et al., 2011) as the image is first dilated prior to applying the transform. Taking the transform in this sense ultimately gives un-sharp and large peaks which are cumbersome. Hence extracting a single large peak that corresponds to the correct skew lead to low accuracy.
Conclusion
In this paper, an enhanced Radon based high precision skew estimation and correction algorithm is proposed. It is an extension of our earlier work which incorporates the addition of a hit-and-miss algorithm for accurate relevant peaks extraction and a de-blurring filter. As other existing methods resolve to determining skew angles based on a single maximum peak value, the proposed algorithm uses a predetermined threshold for simplicity and automatically determined the nature of the form and select the best relevant peaks necessary for the estimation of the correct skew. Other than that, the algorithm is fine tuned to focus on the now trending customized OMR based MC forms and phone camera images. This special focus enables the algorithm to be robust in its application. The algorithm works over a range of skew angles between ±6° which are common in scanned forms and have been extensively tested on various types of MC form designs with two separate capturing devices. An overall rounded accuracy of 98% has been achieved. Comparisons have also been made with some of the reported skew detection methods, and the experimental results prove the efficacy of the proposed algorithm within this context.
References
- Abdu, A. M. (2013). Generic Optical Answer Extraction for Multiple-choice Forms Based on Image Processing. Universiti Teknologi Malaysia,
- Abdu, A. M., & Mokji, M. M. (2012). A novel approach to a dynamic template generation algorithm for multiple-choice forms. Paper presented at the Control System, Computing and Engineering (ICCSCE), 2012 IEEE International Conference on.
- Aithal, P. K., Rajesh, G., Siddalingaswamy, P. C., & Acharya, D. U. (2011, 5-8 Dec. 2011). A novel skew estimation approach using radon transform. Paper presented at the Hybrid Intelligent Systems (HIS), 2011 11th International Conference on.
- Basu, M. (2002). Gaussian-based edge-detection methods-a survey. IEEE Transactions on Systems, Man, and Cybernetics, Part C (Applications and Reviews), 32(3), 252-260.
- Boukharouba, A. (2017). A new algorithm for skew correction and baseline detection based on the randomized Hough Transform. Journal of King Saud University-Computer and Information Sciences, 29(1), 29-38.
- Canny, J. (1986). A computational approach to edge detection. IEEE Transactions on Pattern Analysis and Machine Intelligence(6), 679-698.
- Dhandra, B. V., Malemath, V. S., Mallikarjun, H., & Hegadi, R. (2006, 0-0 0). Skew Detection in Binary Image Documents Based on Image Dilation and Region labeling Approach. Paper presented at the Pattern Recognition, 2006. ICPR 2006. 18th International Conference on.
- FORMRETURN. (2018). OMR User guide. Retrieved from Online publication: https://www.formreturn.com/
- Gaofeng, M., Chunhong, P., Nanning, Z., & Chen, S. (2010). Skew Estimation of Document Images Using Bagging. Image Processing, IEEE Transactions on, 19(7), 1837-1846. doi:
- Gari, A., Khaissidi, G., Mrabti, M., Chenouni, D., & El Yacoubi, M. (2017). Skew detection and correction based on Hough transform and Harris corners. Paper presented at the Wireless Technologies, Embedded and Intelligent Systems (WITS), 2017 International Conference on.
- Haji, S. A. B., James, A., & Chandran, S. (2016). A Novel Segmentation and Skew Correction Approach for Handwritten Malayalam Documents. Procedia Technology, 24, 1341-1348. doi:
- Jain, B., & Borah, M. (2014). A comparison paper on skew detection of scanned document images based on horizontal and vertical projection profile analysis. International Journal of Scientific and Research Publications, 4(6).
- Konya, I. V., Eickeler, S., & Seibert, C. (2010). Fast seamless skew and orientation detection in document images. Paper presented at the 2010 International Conference on Pattern Recognition.
- Otsu, N. (1979). A Threshold Selection Method from Gray-Level Histograms. Systems, Man and Cybernetics, IEEE Transactions on, 9(1), 62-66. doi:
- Papandreou, A., & Gatos, B. (2011). A novel skew detection technique based on vertical projections. Paper presented at the Document Analysis and Recognition (ICDAR), 2011 International Conference on.
- Qiaoping, Z., & Couloigner, I. (2007). Accurate Centerline Detection and Line Width Estimation of Thick Lines Using the Radon Transform. Image Processing, IEEE Transactions on, 16(2), 310-316. doi:
- Rajput, H., Som, T., & Kar, S. (2016). Using Radon Transform to Recognize Skewed Images of Vehicular License Plates. Computer, 49(1), 59-65. doi:
- Ramandi, H. Y., Faez, K., & Ardekani, M. H. (2012). A novel approach of skew estimation and correction in persian manuscript text using radon transform. Paper presented at the Computers & Informatics (ISCI), 2012 IEEE Symposium on.
- Sarfraz, M., Mahmoud, S., & Rasheed, Z. (2007). On skew estimation and correction of text. Paper presented at the Computer Graphics, Imaging and Visualisation, 2007. CGIV'07.
- Sari, M. I., Suksmono, A. B., & Iwut, T. I. (2011). Detection and reconstruction of geometric object based on line detection using radon transform. Paper presented at the Electrical Engineering and Informatics (ICEEI), 2011 International Conference on.
- Shafii, M., & Sid-Ahmed, M. (2015). Skew detection and correction based on an axes-parallel bounding box. International Journal on Document Analysis and Recognition (IJDAR), 18(1), 59-71.
- Toft, P. (1996). The Radon Transform—Theory and Implementation. (Ph.D. dissertation Ph.D. dissertation), Tech. Univ. Denmark, Lyngby,
- Wagdy, M., Faye, I., & Rohaya, D. (2014). Document image skew detection and correction method based on extreme points. Paper presented at the Computer and Information Sciences (ICCOINS), 2014 International Conference on.
Copyright information

This work is licensed under a Creative Commons Attribution-NonCommercial-NoDerivatives 4.0 International License.
About this article
Publication Date
17 May 2019
Article Doi
eBook ISBN
978-1-80296-061-7
Publisher
Future Academy
Volume
62
Print ISBN (optional)
-
Edition Number
1st Edition
Pages
1-539
Subjects
Business, innovation, sustainability, environment, green business, environmental issues
Cite this article as:
Iliyasu, A. Y., Sheikh, U. U., Mohd Mokji, M., & Muhammad Abdu*, A. (2019). Enhanced Radon Transform Skew Estimation And Correctıon Algorithm For Scanned Multiple-Choice Forms. In M. Imran Qureshi (Ed.), Technology & Society: A Multidisciplinary Pathway for Sustainable Development, vol 62. European Proceedings of Social and Behavioural Sciences (pp. 444-454). Future Academy. https://doi.org/10.15405/epsbs.2019.05.02.44