
Structures & Basin Setting Of Semanggol Formatıon, Bukit Merah Using Gravity Data

Abstract
Geophysical investigations have been widely used in studying geology and subsurface structures. A study on the application of gravity survey covering the Semanggol area has been acquired and analysed. The aim of this survey is to study the basin setting and subsurface structures such as fractures and faults. The survey is conducted by using the Scintrex model CG-5 gravimeter. There are total of 171 gravity stations established during the survey with a 500 m to 1 km spacing. In order to generate a corrected gravity data, the raw data were corrected for drift, latitude, free-air, terrain and Bouguer corrections. The corrected data were processed and analysed to produce Bouguer, regional and residual gravity anomaly maps for qualitative and quantitative interpretations. Techniques of regional-residual separation was applied to study the deep-seated and shallow-seated geologic features. The Bouguer and regional gravity values decreased towards the eastern part in the map, indicating the thickening of basement depth. The rose diagram for residual gravity and DEM maps reveal that the dominant orientation for gravity lineaments is in NE-SW direction. Also, the 2-D modelling was established by the A-A’ profile from Bouguer gravity map to study the basin setting
Keywords: Semanggolgravity anomalyanomaly map2D modelling
Introduction
Geophysical methods such as gravity and magnetic methods are the most widely used in delineating the geology such as lithology and subsurface structures. Both methods are the oldest geophysical surveys. They do not rely on any controlled sources, but they discover the natural occurrence of variations in the earth’s gravity and magnetic field.
Gravity method measures the variations of the Earth’s gravitational field which are caused by the differences density of subsurface rock. The significant in exploration work is to associate variations with differences in the distribution of densities and hence rock types (Sheriff, 1994). There is a wide range in density between different rock types. Different rock densities produce some sort of density contrast, resulting gravity anomalies. Therefore, when a buried denser body across the target area is found, the gravitational attraction is increased. And this gravity behaviour is known as gravity anomaly. The gravity anomaly can be interpreted qualitatively and quantitatively. Generally, geophysicists indicate the tectonic features and subsurface structures such as faults, fractures and contacts based on the lineaments.
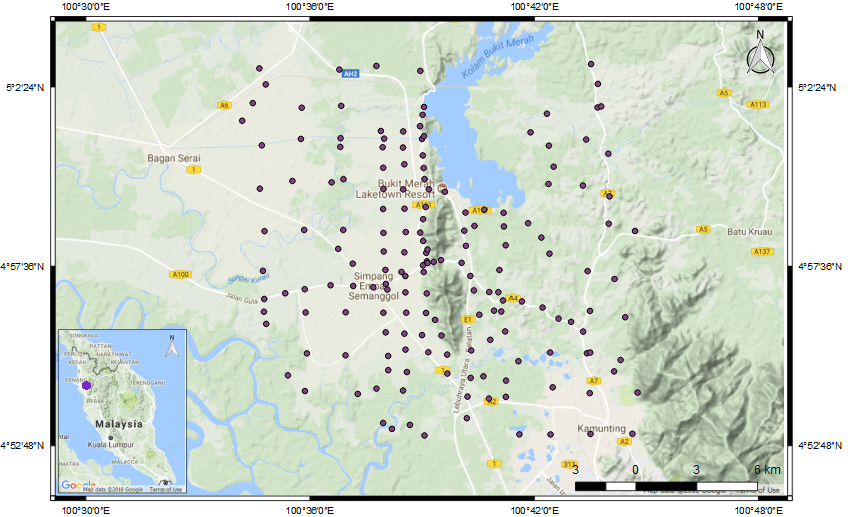
Semanggol area, Bukit Merah is part of the Semanggol Formation that stretch from the northern border of Kedah southwards to north of Perak. The formation is named after Gunung Semanggol, Bukit Merah. In this study, the study area only focuses on the Semanggol Formation in north of Perak. It is located at the Kerian distinct, north of Perak Darul Rizuan, Malaysia which covers around 40 km2 (Figure
Problem Statement
Semanggol Formation has been studied widely and published by many, yet, just covering areas of the northern and southeast Kedah. Limited data have been studied and published on Perak area, especially Gunung Semanggol, Bukit Merah.
Research Questions
-
What are the subsurface conditions of the Semanggol Formation?
-
How deep is the formation depth?
Purpose of Study
The purpose for this study is to delineate the subsurface structure and basin setting over Semanggol and the surrounding area.
Geology of Study Area
Semanggol Formation was introduced firstly by (Alexandar, 1959) to define the Middle Triassic argillaceous-arenaceous rocks that are exposed in the Semanggol range, north Perak. Burton (1970) and Courtier (1974) have extended the formation to north and south Kedah. The usage of the name is informal as there was no statement to designate a formal unit or description of the type area (Burton, 1988). It is believed to be named as Semanggol Formation after Gunung Semanggol.
The Semanggol Formation is located at the three-separate fault-displaced areas in Padang Terap (north Kedah), Kulim-Baling (south Kedah) and Gunung Semanggol (north Perak) (Jasin & Harun, 2007; Jasin, 2008; Hutchison & Tan, 2009). According to Foo (1990), the formation at Gunung Semanggol does not represent a complete succession of Semanggol Formation due to the absence of top and bottom of the formation. Burton (1973a) divided Semanggol Formation into three informal members namely as chert, rhythmite and conglomerate members. Burton (1973a) suggested that Semanggol Formation young towards the east or southeast, which states that the Chert members as the oldest rocks and the Conglomerate Members as the youngest rocks. In Gunung Semanggol, Foo (1990) described that the rocks as comprising of two dominant facies which are a rudaceous-arenaceous facies of intraformational conglomerate and sandstone, and an argillo-arenacous facies of rhythmically bedded sandstone and shale. Yet, in this present day, it is surrounded by recent alluvium and paddy fields.
Semanggol Formation is a fore-deep basin developed corresponding to the collision between Sibumasu tectonic block and Indochina-East Malaya blocks (Metcalfe, 2000). The 3 members of Semanggol formation was initially thought deposited in succession, yet few evidences in subsequent studies reject the idea (Abdullah, 2009; Metcalfe, 2013). Instead, tectonic activities were suggested to have preceed the deposition of Rhythmite and Conglomerate members. Referring to Abdullah (2009) and Metcalfe (2013), the Chert member was deposited in Paleo-Tethys below carbon compensation depth in a foredeep basin. The ocean basin became part of the accretionary wedges during Sibumasu-Indochina collision, during which the S-type granitoids intrusion coincides.
Methodology
Data Acquisition
In this study, Scintrex CG-5 gravimeter was used to measure the relative changes in g between 2 locations. This instrument is very sensitive in measuring as the density variations are very tiny and uniform as compared to others gravimeter model. The sensitivity of instrument is up to 0.01mGal precision in about 5 minutes.
The gravity survey was acquired by loop technique along Gunung Semanggol and its surrounding area. A main base station was set up before and after data acquisition which consist few base stations. A total of 171 gravity stations had been established with the interval approximately 0.5 to 1 km spacing.
Data Corrections
Before compiling the acquired gravity data into contour map, the readings have to be corrected for certain effects which is known as data reduction as gravimeter does not provide direct measurements of gravity. Therefore, in order to generate corrected Bouguer data for the study area, the raw gravity data was processed for drift, latitude, free-air, terrain and Bouguer corrections.
Results & Discussion
The obtained results were used to study the subsurface structures and basin setting of Semanggol area. The gravity data was gridded and plotted as contour map by using Geosoft Oasis Montaj software after the corrections were established. The pattern of anomalies shown in contour map were observed and interpreted qualitatively and quantitatively.
Qualitative Interpretation
Bouguer Gravity
The Bouguer gravity map indicates the horizontal changes in the Earth’s gravity field. Generally, these gravity anomalies are used to study some subsurface structures of the study area. Bouguer anomaly map comprises two types of gravimetric field, which are regional field and residual field. A Bouguer gravity anomaly map that was interpolated using Oasis Montaj software is shown in Fig.
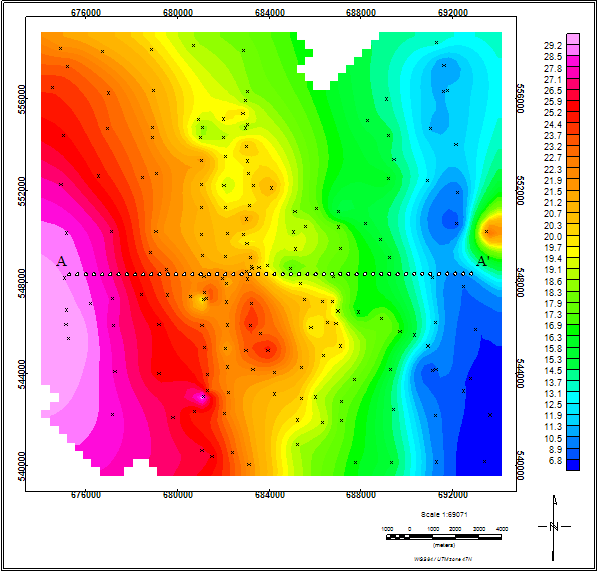
Qualitatively, the Bouguer gravity map as shown in Fig.
Regional Anomaly Map
The regional magnetic intensity map of the study area (Fig. 3a) was produced using Oasis Montaj software. It was generated after applying the low pass filter that enhanced the data from Bouguer gravity map where only the low frequency anomalies that reflects the deep-seated bodies.
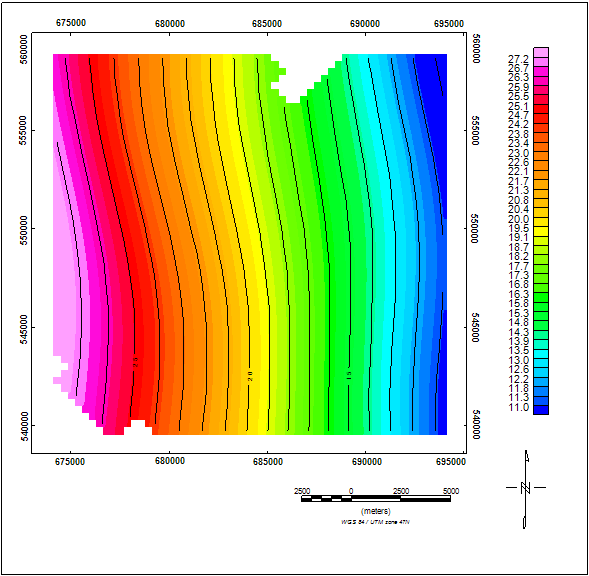
The gravity values range as shown in Fig. 3a from 11mGal to 27mGal with an effective cutoff wavelength of 0.0025cycle/unit which reveals the trend of west to east. The trend of the regional map is in North-South direction. The low gravity anomalies are due to the deep seated bodies. Hence, it indicates that there is a huge depth of basement rocks in the east part of the study area. The map shows a steady decrease of gravity values towards the eastern part of the study area, indicating that the basement is thickening towards the eastern part. This might reflect that the basement extends to the Main Range granite in the east which has thicker crustal. This also results that Semanggol area has thinner filled sediment compared to Main Range. The regional gravity trend direction is in coincidence with the trend of Bouguer gravity map. Hence, regional gravity map agrees with the Bouguer gravity map of the study area well.
Residual Anomaly Map
Figure below illustrates residual gravity map of the study area. The map was produced after high-pass filtering enhanced the data by isolating the shallow depth anomalies (high frequency) from Bouguer gravity map. The subsequent qualitative approach in interpreting residual anomalies generally involves the inspections of contours variation in terms of its amplitude, wavelength, gradient and directional trend (Bird, 1997). Generally, residual map has been used by geophysicists to bring into focus local features of the field (Hinze, et.al., 2013). It shows the sudden changes in the gravity field where accompany the shallow-seated geologic features. The residual gravity is commonly established to study the depth, density and geometry of the anomaly bodies. Therefore, in order to produce a residual anomaly map (Fig. 3b), the regional field was removed from the Bouguer gravity map.
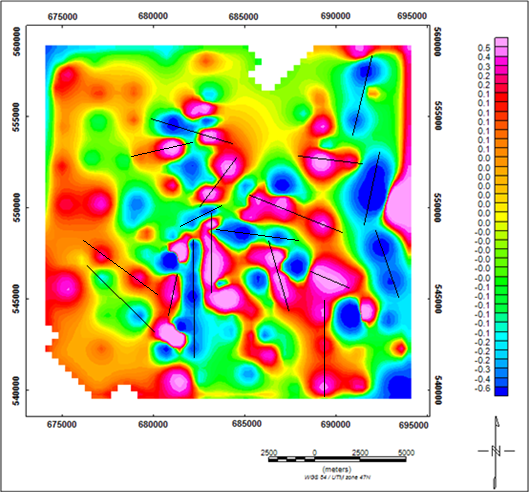
The high-pass filtered gravity anomaly map is shown in fig.
Quantitative Interpretation
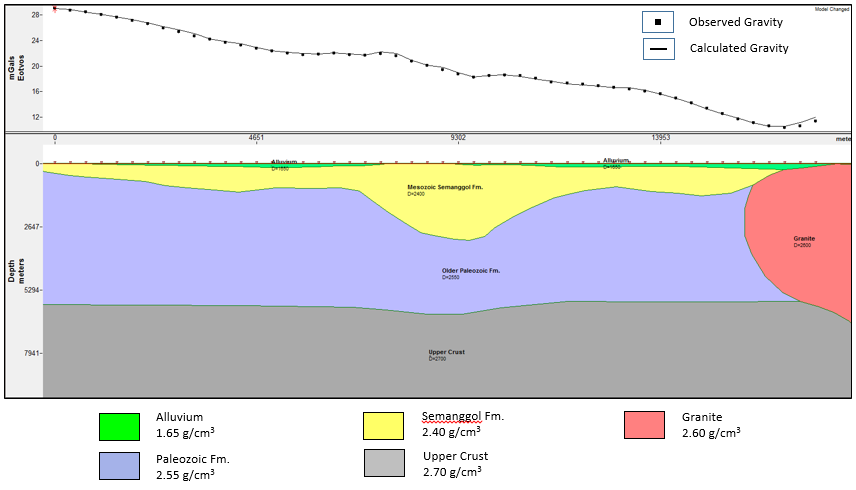
A 2-D gravity modelling (Fig. 5) was applied on profiles (A-A’) in East-West direction based on the Bouguer anomaly map in the study area (Fig. 3) to quantify the basement parameters, depth, composition and the bodies shape using Oasis Montaj GM-SYS program.
The figure above shows a best fit between the observed and calculated curves. The profile A-A’ covers about 18 km long and cut across the study area in W-E direction. The total depth of this crustal model is approximately 10 km. It consists of the lithology of the study area and basement. Semanggol Formation aged from early Permian to Triassic was overlain by the Paleozoic metasediment. As shown in Fig.
Conclusion
With the obtained results, this study can be concluded that the Bouguer anomaly map showed a relatively low gravity value in the eastern part of the study area, indicating a gradual increase in the thickness of the crust. This might be due to the Main Range granite batholiths based on the isostatic condition. And there is coincidence between the trends of Bouguer gravity and regional trends. This supports the increasing of basement depth from western to eastern part of study area. Besides, the majority orientation of residual gravity is in NE-SW direction is similar with the geological structure element of the study area that is shown in DEM map.
Acknowledgments
The authors would like to express my utmost gratitude to those who were involved in this project especially to Sean Lee Cheong Heng and Ngui Jia Qi for the help in gravity data acquisition. In addition, a great thanks to Universiti Teknologi PETRONAS for the opportunity and support in this project. Special credit to the YUTP (0153AA-E80-1) for the finance support too.
References
- Abdullah, N. T. (2009). Mesozoic Stratigraphy. In C.S. Hutchison & D.N.K. Tan (Eds.), Geology of Peninsular Malaysia (87-132). Kuala Lumpur, Malaysia: The University of Malaya and The Geological Society of Malaysia.
- Alexandar, J. B. (1959). Pre-Tertiary Stratigraphic Succession in Malaya. Nature, 183, 230-231.
- Bird, D. (1997). Interpreting magnetic data: Geophysical corner, EXPLORER, AAPG and SEG, May, 1997.
- Burton, C. (1973). Chapter 5: Mesozoic. In D.J. Hutchison, Geology of Malay Peninsula (pp.97-141).
- Burton, C. K. (1970). The Geology and Mineral Resources of the Baling Area, Kedah and Perak. Geological Survey District Memoir, 12, 46-58.
- Burton, C. K. (1988). The Geology and Mineral Resources of the Bedung Area, Kedah, West Malaysia. Geological Survey Map Bulletin, 7, 40-54.
- Courtier, D. B. (1974). Geology and Mineral Resources of the Neighbourhood of Kulim, Kedah. Geological Survey Map Bulletin, 3, 19-39.
- Foo, K. Y. (1990). Geology and Mineral Resources of the Taiping-Kuala Kangsar Area, Perak Darul Ridzuan. Geological Survey Malaysia Map Report, 1, 13-36.
- Hinze, W.J., Von Frese, R.R., & Saad, A. H. (2013). Gravity and magnetic exploration: Principles, practices, and applications. Cambridge University Press.
- Hutchison, C. S., & Tan, D. N. K. (Eds.). (2009). Mesozoic. Geology of Peninsular Malaysia. Kuala Lumpur: Universiti of Malaya & Geological Society of Malaysia.
- Jasin, B. (2008). Some Permian Radiolarians from Bukit Yoi, Pokok Sena, Kedah. Bulletin of the Geological Society of Malaysia, 54, 53-58.
- Jasin,B. & Harun, Z. (2007). Stratigraphy and sedimentology of the chert unit of the Semanggol Formation. Geological Society of Malaysia, 53, 103-109.
- Loke, M. H., Lee, C.Y., & Klinken, G. V. (1983). Interpretation of Regional Gravity and Magnetic Data in Peninsular Malaysia. Geological Society Malaysia Bulletin, 16, 1-21.
- Metcalfe, I., (2000). The Bentong-Raub Suture Zone. Journal of Asian Earth Sciences, 18, 691-712.
- Metcalfe, I., (2013). Tectonic evolution of the Malay Peninsula. Journal of Asian Earth Sciences, 76, 195-213. doi: org/10.1016/j.jseaes.2012.12.011
- Sheriff, R. (1994). Encyclopaedic dictionary of exploration geophysics (3rd Edition). SEG Society of Exploration Geophysics.
Copyright information

This work is licensed under a Creative Commons Attribution-NonCommercial-NoDerivatives 4.0 International License.
About this article
Publication Date
17 May 2019
Article Doi
eBook ISBN
978-1-80296-061-7
Publisher
Future Academy
Volume
62
Print ISBN (optional)
-
Edition Number
1st Edition
Pages
1-539
Subjects
Business, innovation, sustainability, environment, green business, environmental issues
Cite this article as:
Mohamed, M. A., Md Rafek, A. G., Chee Meng, C., Amin Zakariah, M. N., & Wei Chian*, O. (2019). Structures & Basin Setting Of Semanggol Formatıon, Bukit Merah Using Gravity Data. In M. Imran Qureshi (Ed.), Technology & Society: A Multidisciplinary Pathway for Sustainable Development, vol 62. European Proceedings of Social and Behavioural Sciences (pp. 247-254). Future Academy. https://doi.org/10.15405/epsbs.2019.05.02.24