
Gravity Modelling Of The Crystalline Basement At Pekan, Pahang River Delta

Abstract
Quaternary Pekan river delta sediments have been proven to overlain granitic basement through studies from boreholes and seismic. The geometry of the granitic basement was found to be deepening towards Pekan coastline with its deepest part over 100 m. However, gravity exploration in this area showed two distinct gravity highs at the northern and southern part of Pekan. The density contrasts between the Quaternary alluvium and granite basement are low in this region which implies that few intrusions of a higher density mafic structure are present. Subsequently, Pekan are strategically located between the extensional Penyu basin and the subduction zone of the Indochina terrane which could subject to the fracturing of the mainland. These fractures could provide as main channel for mafic intrusion underneath. Supported by the additional information such as depth of basement, sediment thickness, density contrast and wavelength filtering of the Bouguer gravity, a useful method derived along the profile A-A’ from the Bouguer gravity anomaly map to create a gravity model was done to detect the distribution, shape and geometry of the granite basement and pinpointing accurate location of the higher density material underneath.
Keywords: “Pekan”“Basement”“Bouguer Gravity”“Mafic Intrusion”
Introduction
Gravity exploration is an efficient geophysical instrument for the study of geologic structures of the crustal. Land gravity provides high precision primary data, but it is inconvenient to cover a very large area. A breakthrough is the topographic and gravity mapping based on orbital perturbation analyses of artificial satellites.
At the present, there are many databanks for satellite-derived gravity data. Among them, the complete Bouguer gravity satellite data of EGM 2008 from Bureau Gravimetrique International is preferred for this research paper. The data are useful for structural studies of large-scale and low accessibility regions such as in Pekan. Gravity exploration is mainly focused on anomalies due to density variations in the subsurface. These anomalies can be obtained by considering the effects of latitude, elevation and topography of the surrounding area and excess rock slab mass from the observed gravity.
Geology of Peninsular Malaysia and Pekan, Pahang
Pekan is located at the Eastern Belt of Peninsular Malaysia and adjacent to the offshore Penyu Basin. This belt was formed as a result of collision between two blocks, namely Sibumasu and the Indochina terrane. The Indochina arc terrane of Peninsular Malaysia was derived from South China or Indochina during the Carboniferous period. Subsequently, the collision between these two blocks marked the closure of the Tethys Ocean during the lower Permian to middle Triassic (Metcalfe, 2017). However, the resulting subduction of the Paleo-Tethys Ocean formed a suture called Bentong-Raub suture which was identified as a separation zone between the two blocks and represents the main Devonian to Middle Triassic Paleo-Tethys Ocean.
The Eastern Belt of Peninsular Malaysia is also largely dominated by a series of basaltic dykes. The dykes are found abundantly at the north-eastern part and in the south-eastern part of the belt. It is possible that the stress resulted from the subduction of the Palaeo-Tethys ocean and the evolution of the two offshore basins (Penyu Basin and Malay Basin) east of Peninsular Malaysia fractures the mainland and served as main conduit for mafic dyke emplacement (Ghani, Lo, & Chung, 2013). According to Khairul (2007), basalts are also present in Pekan which has intruded the sedimentary, metamorphic rocks and the granite basement in the area. In addition, the presence of basalts in Pekan were formed as a direct result of the expansion of the Kuantan region (Tjia, 1999). The N–S and E–W trends also coincide with the major trends of Malay and Penyu Basins basement east coast off Peninsular Malaysia.
Generally, Pekan area is covered by unconsolidated Quaternary alluvium which is overlying the volcanic and Permian metasediment basement (Che Aziz, 2001). He also stated that the Quaternary alluvium is classified into two sedimentary sequence, with marine sand and clay sections of Holocene period and continental river sediments of Pleistocene period. The accumulation of sediments only made up of a thickness ranging from 30 to 35 meters. Nevertheless, seismic reflection and drilling projects suggested the sediments overlain a granite and metasediment basement at a depth between 90 to 200 meters (Hamzah, 2001; Hamzah, Samsudin, Rafek, & Noraini, 1995).
Problem Statement
This paper will discuss the application of available information to create the gravity model of Pekan vicinity. Thickness of the Quaternary sediment, surface of the granite and metasediment bedrock as well as their specific densities serves as vital information in producing a model that honours the observed data. The reprocessing of available land gravity stations to generate Bouguer anomaly map, in addition to the satellite derived Bouguer gravity and previous literatures provided supporting evidences to the hypotheses. This equate for better mapping and illumination of the crystalline basement underneath Pekan.
Research Questions
A preliminary knowledge of geologic aspects of the Pekan crystalline basement should be obtained to generate research questions that can be considered for this study. Based on previous literatures, three research questions that should be tackled are identified as follows:
What is the basement geometry including sediment thickness and the length and width of the basement rocks in Pekan?
What is the type of basement, depths and sediment density that were penetrated from the boreholes?
Can gravity method (Bouguer map, wavelength filtering, 2D model) able to locate previously unrecognized high-density intrusion in the subsurface?
Lithological Cross Sections and Interpreted Seismic Sections
Lithological sections were produced in the Pekan area across profiles P1 and P3 (Figure
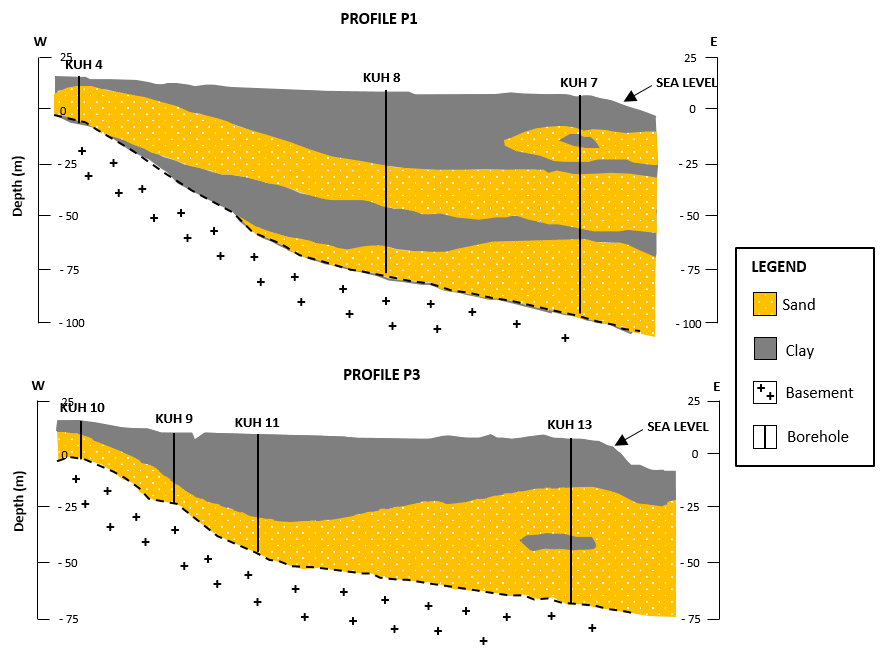
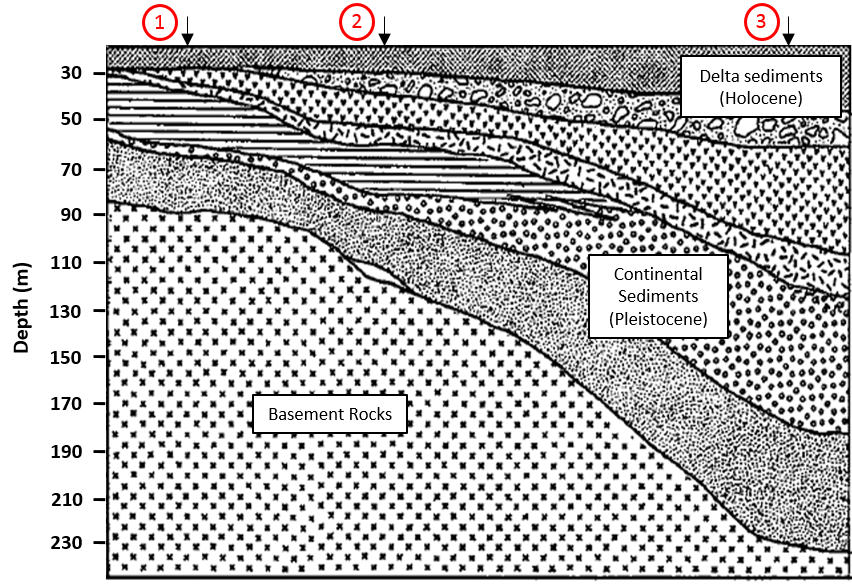
Seismic studies were also done in the Pekan vicinity (Che Aziz, 2001; Hamzah, 2001; Hamzah et al., 1995; Huat, Hamzah, Jantan, Che Aziz, & Abdullah, 2000). However, the interpreted seismic section by Che Aziz provided the clearest delineation of the subsurface features in Pekan. His work also complemented the boreholes and lithological sections with similar results being shown whereby the basement rocks are deepening towards the East (Figure
Onshore Boreholes Data
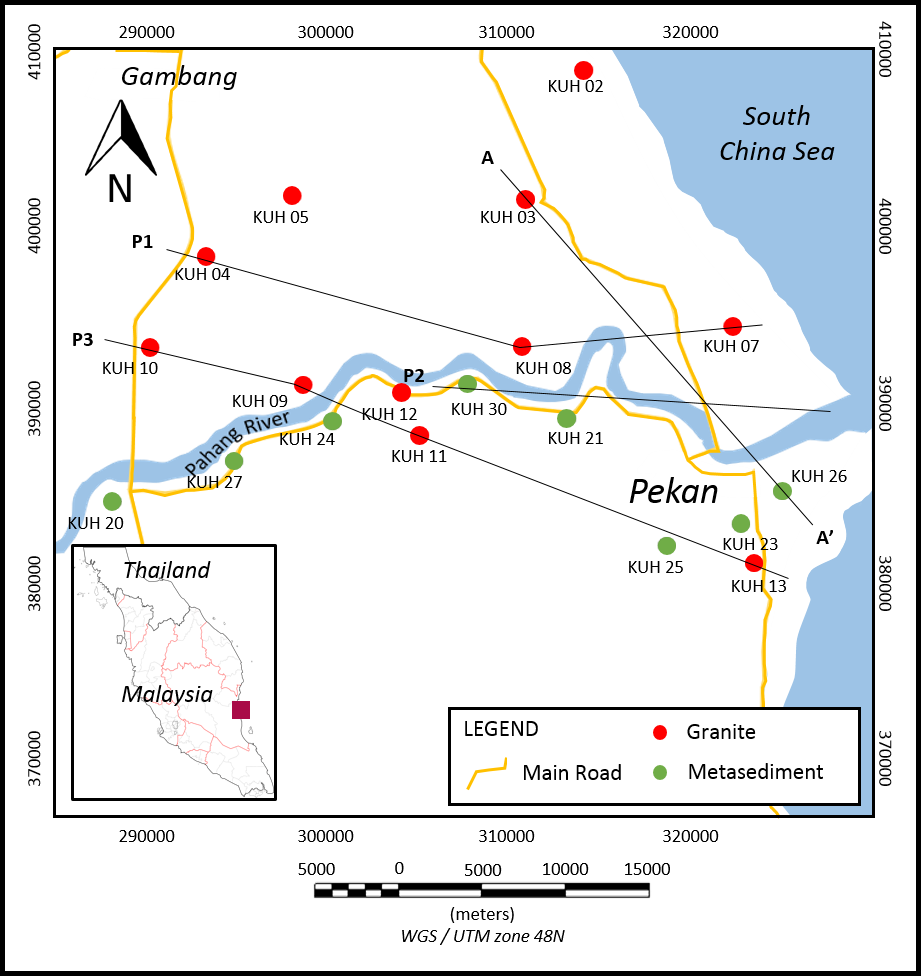
Thirty drilled wells can provide useful subsurface properties as a basis of interpretation to delineate the presence of metasediment and granite in the vicinity of Pekan (Figure
Purpose of the Study
Since the geometry and distribution of the basement and sediments are already known in Pekan, a 2D gravity model profile A-A’ with few controlling parameters such as borehole information, lithological sections will be created. This model will show the effectiveness of this method to identify different anomalies in the subsurface and possible previously unrecognised intrusion in Pekan.
Research Methods
Data Sets
The data for this research consists of a reprocessing of 403 land gravity stations data in the vicinity of Pekan, Pahang and the satellite-derived Bouguer gravity data of EGM 2008 which covers the whole of Pekan between 3° N and 5° N. It is worth noting that the data available for reprocessing were sparse and not spatially distributed, thus additional 184 new gravity stations were acquired for processing.
Data Reductions and Corrections
Gravimeters do not give direct measurements of gravity. Rather, a meter reading is taken which is then multiplied by an instrumental calibration factor to produce a value of observed gravity (Gobs). The correction process is known as gravity data reduction or reduction to the geoid. There are several corrections that can be applied to the measurements made before proceeding with data interpretation.
The first step before proceeding with the reductions is to correct the drift of the gravity observations at one location which yielded different values for the gravitational acceleration. The key to making effective corrections for these factors is to note that drift alter the observed gravity field as slowly varying functions of time. The first correction comes from the fact that the earth is not a perfect sphere but is rather an oblate spheroid. The formula adopted by the International Association of Geodesy in 1967 is used for latitude correction (Gn) where it considers for Earth's elliptical shape and rotation.
The next correction accounts for gravity variations caused by elevation differences in the observation locations. This correction, known as the free air correction, assuming all material that may exist between sea level and the point where the gravity station is located is to be air. Assuming all these corrections have been accounted accurately for the variations in gravitational acceleration they were intended to account for, any remaining variations in the gravitational acceleration associated with the Terrain Corrected Bouguer Gravity (Gt) can be assumed to be caused by a geologic structure.
Gt = Gobs – Gn + 0.3086h – 0.04193ρh + TC (mGal)
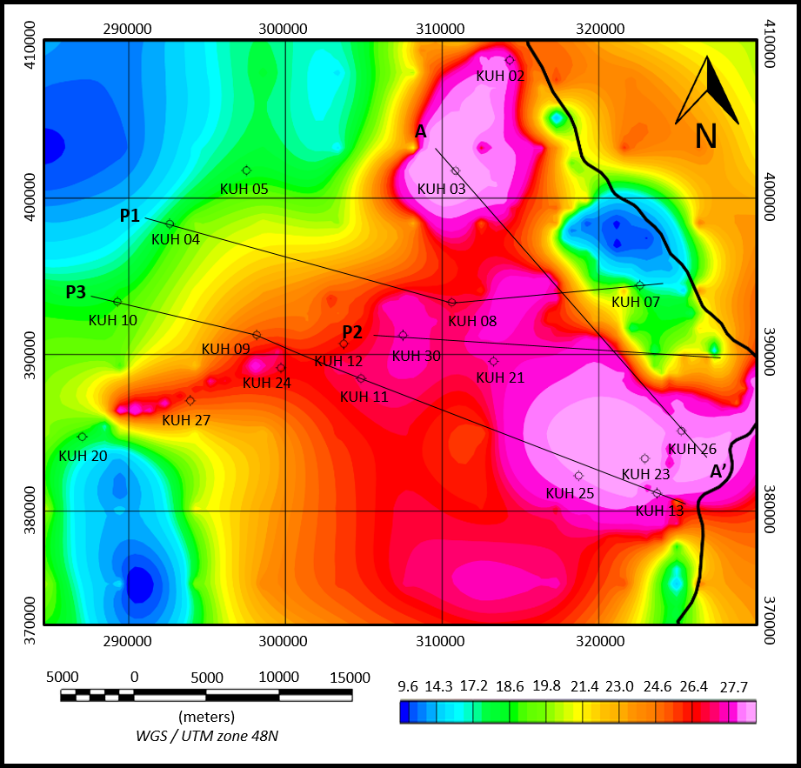
The Bouguer map (Figure
Wavelength Filtering and Radial Spectrum Analysis
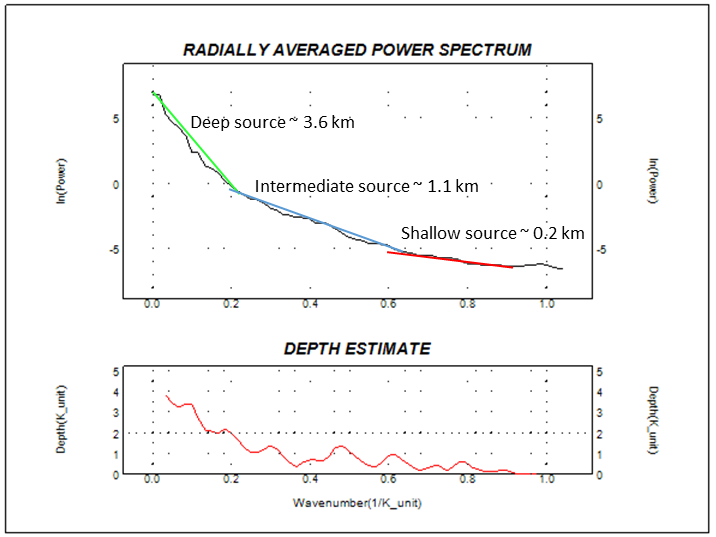
In order to separate the fine scale (shorter wavelength) gravity effects of shallow structures in Pekan from the broader scale (longer wavelength) effects arising from the depth to the granitic basement, a Fourier transform were used to analyse the spectrum of the Bouguer gravity anomalies (Figure
Long wavelengths: mostly deeper than 3.6 km
Intermediate wavelengths: from about 200 m to 3.6km
Short wavelengths: shallower than 200 m
Gravity Model of Pekan
The data used for modelling are a Bouguer gravity anomaly across the profile A-A', which is located from North to South of Pekan as indicated on Figure
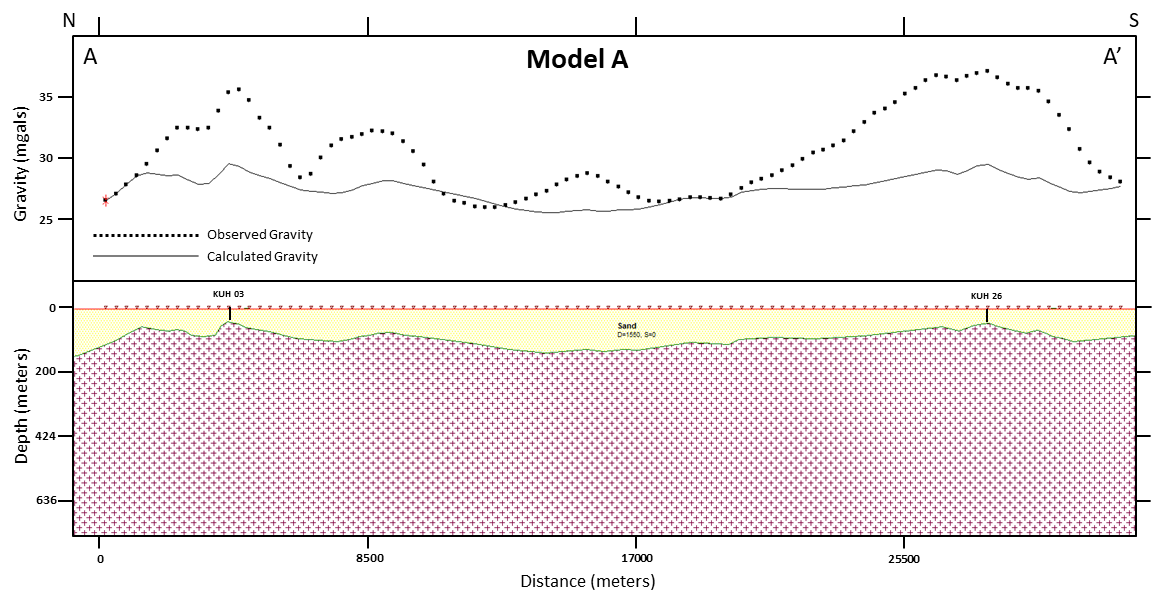
The modelling process started with the knowledge of sediment thickness and top of basement depth in Pekan (Che Aziz, 2001; Hamzah, 2001; Hamzah et al., 1995). The first model, model A, has a single density contrast for the entire sedimentary basin fill. The density of loose sand and clay was set at 1550 kg/m3 with the granite body being given a value of 2650 kg/m3. The resulting model A does not fit the anomaly reasonably well (Figure
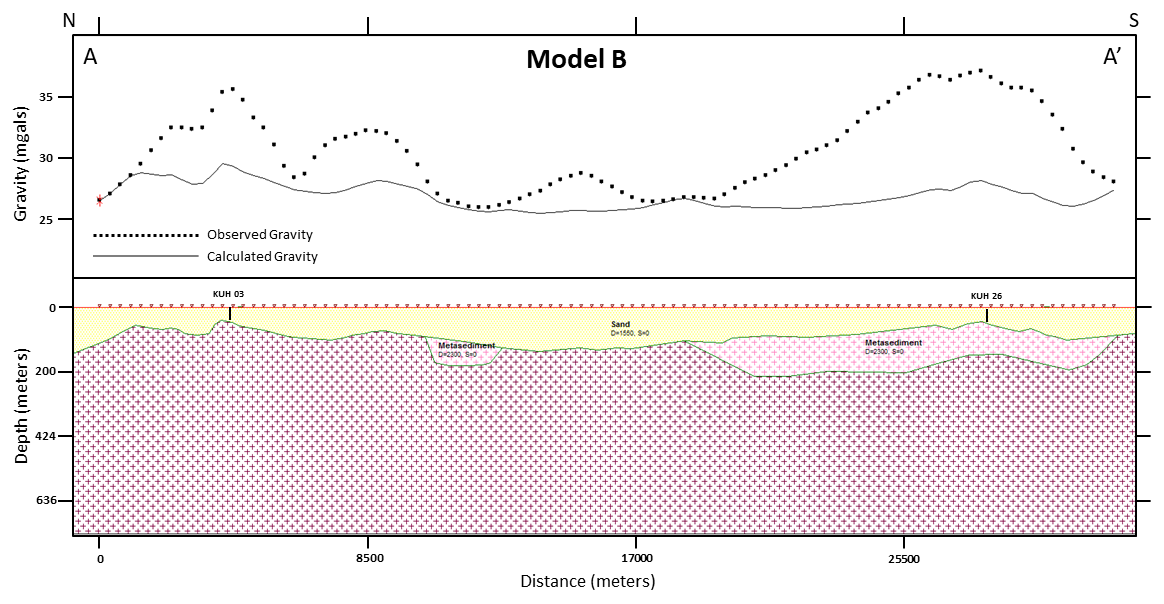
The problem faced in model A and model B is that the use of available information which constrains the model. Thus, a logical solution would be an inclusion of a high density compensating body below the granite body. However, this high-density body needs to achieve isostatic balance with the low-density sediments in the upper layer. Since no seismic studies have been able to distinguish the exact location of this large intrusion, it appears to be a few possible locations for the high-density body, which are as follows: in the upper crust just below the sediments, in the middle crust at the upper-lower crustal discontinuity, or in the lower crust as an intrusion from the mantle.
However, considering the fact using spectrum analysis and the understanding of a failed rift arm of Penyu basin, the only suitable location for the mafic intrusion would be in the range of 1.1 km to 3.6 km and below. The distance between the sediments resulted in good density contrast and is able to amplify the Bouguer gravity at different parts of the profile to achieve the desired model (Harder, Mauri, & Marshall-Arrazola, 1993). The remaining unknown is the choice of density contrast to use for the mafic intrusion.
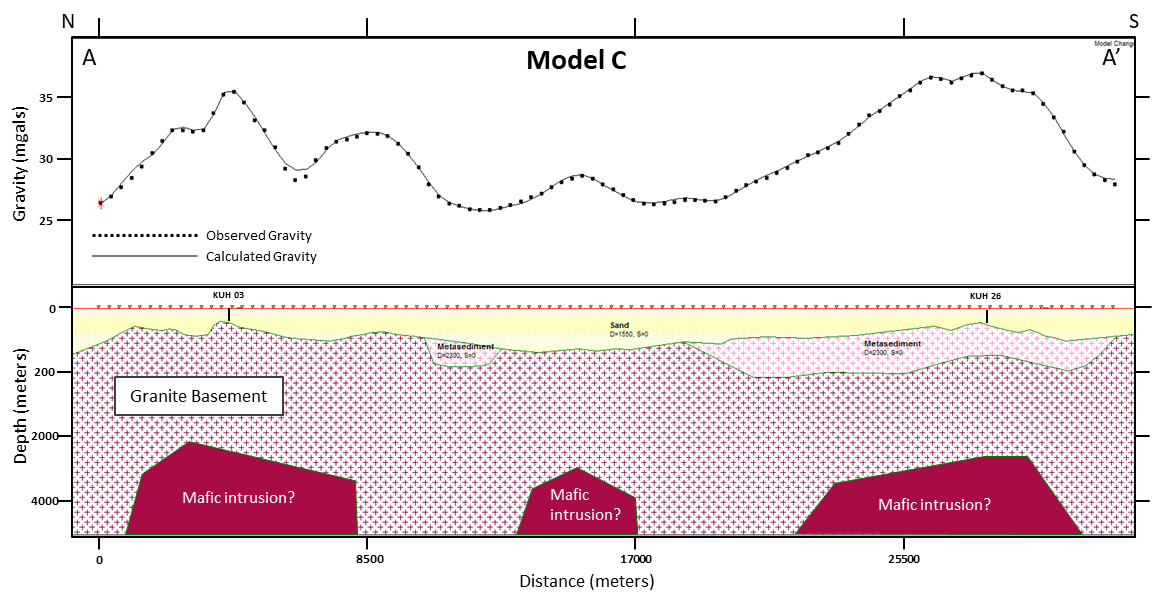
The well data of this area suggested the different anomalies were produced by different kind of basement rock. Granite on the northern side and metasediment on the southern side. However, Pekan area is dominated by granite basement rock with basaltic intrusions (Tjia, 1999). The basalt intrusions presumably resulted from an expansion from the Kuantan region. Nevertheless, all three different basement rocks are present in this area and is consistent with all the claims and this contributed to the rise of the different gravity anomalies of Pekan (Khairul, 2007). If we assume the lower crust has the composition of basalt, a density of 3100 kg/m3 is appropriate. Therefore, a crustal intrusion model with a basalt density in model C (Figure
Findings
Modelling of potential field data is generally considered to be an exercise in dealing with an infinite number of possible models that fit the observed field. However, with the additional information such as borehole data, lithological and seismic sections provided necessary control to the gravity modelling process, the variations of possible models were reduced to a single simple model C. This model is composed of a Quaternary sand and clay and its crystalline basement with geologically reasonable density contrasts and an intrusion of mantle 2 km below the sediments. The need to introduce the large intrusion can be justified from the results found in model B. This high-density body is needed to produce isostatic balance and compensate with the low-density sediments overlying the basement rocks.
The findings have also demonstrated that this area can be modelled without crustal intrusion, but the density contrasts required between sediments and crystalline basement are unrealistically high. Previous studies which suggested the basement rocks in the Pekan vicinity are deepening into the shelf edge are proven to be correct based on the gravity model. By producing a model which cuts across three different profiles, it can be confirmed that the deepest section of the basement is in the central of profile A-A’.
Conclusion
The above discussion portrays gravity modelling as an exercise from which geological knowledge is very crucial. With the use of a different information regarding crystalline basement geometry and densities for sediments, an accurate gravity model was produced along the profile A-A’ in Pekan. The final model is composed of a Quaternary sand and clay and its crystalline basement intruded by a higher density material around 2 km to 4 km below the sediments. As a recommendation for future works, new crustal model profiles should be done parallel to the profile A-A’ to understand the trend and distribution of the basement and further proves the effectiveness of this method for large scale studies.
Acknowledgement
The authors wish to thank Universiti Teknologi PETRONAS for providing the research fund under
The Yayasan UTP and the technicians for their help in the data acquisitions process.
References
- Baharuddin, S. (1992). Hidrogeologi dan prospek air tanah kawasan aluvium Kuantan Pekan, Pahang. Kuala Lumpur.
- Baharuddin, S. (1993). Hidrogeologi dan prospek air tanah kawasan aluvium Pekan Nenasi, Pahang. Kuala Lumpur.
- Che Aziz, A. (2001). Evolusi Delta Sungai Pahang: Bukti-bukti permukaan dan bawah tanah. Warta Geologi, 27(3), 27–32.
- Ghani, A. A., Lo, C. H., & Chung, S. L. (2013). Basaltic dykes of the Eastern Belt of Peninsular Malaysia: The effects of the difference in crustal thickness of Sibumasu and Indochina. Journal of Asian Earth Sciences, 77, 127–139.
- Hamzah, U. (2001). Penganggaran sekitaran sedimen di delta Pahang dengan teknik seismos pantulan. Warta Geologi, 27, 88–90.
- Hamzah, U., Samsudin, A. R., Rafek, A. G., & Noraini, S. (1995). Reflection seismics case studies in Quaternary deposits of east coast Peninsular Malaysia. Bulletin of The Geological Society of Malaysia, 38, 135–140.
- Harder, S. H., Mauri, S. J., & Marshall-Arrazola, S. (1993). Gravity modelling of extensional basins in Southeast Asia. Bulletin of the Geological Society of Malaysia, 33, 153–162.
- Huat, L. B., Hamzah, U., Jantan, A., Che Aziz, A., & Abdullah, I. (2000). Penggunaan seismik pantulan cetek dalam kajian enapan Kuaterner di delta Sungai Pahang, Pekan, Pahang. Bulletin of the Geological Society of Malaysia, (44), 59–67.
- Khairul, M. N. (2007). Analisis Data Graviti dan Magnet bagi mengesan struktur batuan dasar di Delta Sungai Pahang. Universiti Sains Malaysia, Pulau Pinang.
- Metcalfe, I. (2017). Tectonic evolution of Sundaland. Bulletin of the Geological Society of Malaysia, 63(June), 27–60.
- Mohamad, I. C., Samsudin, A. R., Rafek, A. G., & Abdul Rahman, M. T. (2002). Perubahan fasies hidrokimia dalam akuifer aluvium pantai: Kajian kes di kawasan Pekan-Nenasi, Pahang. Bulletin of the Geological Society of Malaysia, 45, 23–30.
- Tjia, H. D. (1999). Geological Setting of Peninsular Malaysia. In In P. N. (PETRONAS). In The Petroleum Geology and Resources of Malaysia (pp. 141–169). Kuala Lumpur: (PETRONAS): Petroliam Nasional Berhad.
Copyright information

This work is licensed under a Creative Commons Attribution-NonCommercial-NoDerivatives 4.0 International License.
About this article
Publication Date
17 May 2019
Article Doi
eBook ISBN
978-1-80296-061-7
Publisher
Future Academy
Volume
62
Print ISBN (optional)
-
Edition Number
1st Edition
Pages
1-539
Subjects
Business, innovation, sustainability, environment, green business, environmental issues
Cite this article as:
Bin Zakariah, M. N. A., Yoong, A. A., Bin Md Rafek, A. G., Bin Mohd Noh, K. A., & Bin Mohd Mazlan*, M. R. (2019). Gravity Modelling Of The Crystalline Basement At Pekan, Pahang River Delta. In M. Imran Qureshi (Ed.), Technology & Society: A Multidisciplinary Pathway for Sustainable Development, vol 62. European Proceedings of Social and Behavioural Sciences (pp. 237-246). Future Academy. https://doi.org/10.15405/epsbs.2019.05.02.23