Abstract
In the article presented the perspectives of the Silk Road countries development in the aspect of their integration within the framework of the One-Belt and One-Way Initiative, covering a set of countries with a significant variability in the parameters of economic development. The emphasis of the research on the energy aspect of cooperation determined the assessment of the level of national production energy intensity, the energy consumption of countries, etc. The list of these criteria is supplemented by indicators related to the states' commitment to the concept of sustainable development – it concerns emissions of CO2, the state and prospects of alternative energy development and etc. Authors used several different indexes, such as: energy use, CO2 emissions, energy use per $1,000 GDP, and adjusted savings: mineral depletion. The state of the relationship between the economic, environmental and energy components of development was determined based on material from countries geographically adjacent to the initiator of the revival of cooperation within in the project “One Belt-One Road” – China, Russia and Mongolia. Authors considered the key cooperation areas of countries in the sphere of energy in the frame of present research. The focus and specificity of the countries' participation in the framework of energy cooperation was examined including with the participation of international organizations. Special attention is paid to assessing the place and role of the Russian Federation. The authors used factual material on such countries as China, Russia, Mongolia, as well as others to illustrate the provisions submitted for discussion.
Keywords: Energy- intensitypower engineeringSilk Road Economic Belt
Introduction
In the article presented the perspectives of the Silk Road countries development in the aspect of their integration within the framework of the One-Belt and One-Way Initiative, covering a set of countries with a significant variability in the parameters of economic development. The emphasis of the research on the energy aspect of cooperation determined the assessment of the level of national production energy intensity, the energy consumption of countries, the country's energy supply, etc. The list of these criteria is supplemented by indicators related to the states' commitment to the concept of sustainable development – it concerns emissions of CO2, the state and prospects of alternative energy development and etc.
The possible range of cooperation directions of the countries in the power engineering within the framework of this initiative, including the development of the corresponding infrastructure, is considered. The focus and specificity of the countries participation in the framework of energy cooperation was considered, including with the participation of international organizations, highlighted the main provisions. Particular attention is paid to assessing the place and role of the Russian Federation.
Integration processes, being a distinctive feature of the development of contemporary global economic ties, create additional incentives for intensifying the development of national economies, including based on the synergistic effect obtained through the exchange / sharing of production resources. Especially significant are projects based on increasing the effectiveness of non-renewable resources. That is why the initiative “One Belt and One Road”, which unites the countries of the Eurasian Economic Union and the Silk Road Economic Belt (SREB), is of undoubted interest. From a wide range of areas of cooperation, it is the energy sector that acquires a carcass-forming status, as it sets the dynamics of the national economies development of the participating countries (Matugina et al., 2016).
The works of many scientists are devoted to the study of energy efficiency of economies problem in sectoral and territorial specificity (Kraft and Kraft, 1978; Liu, Chen, & Yin, 2016; Stern, 2000; Zhang, Cheng, Yuan, & Gao, 2011; Marias, Martinez, & De Miguel, 2006; Khademvatani & Gordon, 2013; Chien & Hu, 2007). The ultimate restrictive condition is the orientation of countries towards sustainable development, involving an economic (energy) and environmental components (Mardani, Zavadskas, Streimikiene, Juson, & Khoshnoudi, 2017; Zhang et al., 2011; Fang & Chen, 2017).
Problem Statement
It is precisely the interest in the triad of components that ensure the sustainability of the development of states that served as the basis for studying their comparison on the material of countries geographically adjacent to the initiator of the revival of cooperation within the Silk Road – China, Russia and Mongolia. This will not only reveal the bottlenecks, but also identify directions of tripartite cooperation. Special attention is paid to the energy component as forming the dynamics of economic growth and directly correlating with the environmental component.
Research Questions
This determined the formulation of the following research questions, which reflect the state of the energy sector in selected countries, as well as its relationship with the economic and environmental spheres:
assess the changes of energy consumption per person;
compare the dynamics of the above indicator with the changes of CO2 emissions per capital;
to evaluate the dynamics of the energy intensity of GDP as one of the most significant criteria for the efficiency of energy consumption;
consider the state of alternative energy as a tool to reduce the energy intensity of national economies.
Purpose of the Study
The purpose of this study is to compare the development parameters of the economic, environmental and energy spheres, taking into account the assessment of the prospects for cooperation between the countries participating in the Silk Road Economic Belt.
Research Methods
In the framework of this study, a systematic method was used to study the totality of interactions of countries arising in the process of implementing the initiative under consideration; methods of observation and comparison in terms of comparing the parameters of the considered areas; methods of analysis and synthesis. The factual base of the research is based on statistical material.
Findings
In the framework of this study, a systematic method was used to study the totality of interactions of countries arising in the process of implementing the initiative under consideration; methods of observation and comparison in terms of comparing the parameters of the considered areas; methods of analysis and synthesis. The factual base of the research is based on statistical material (Figure
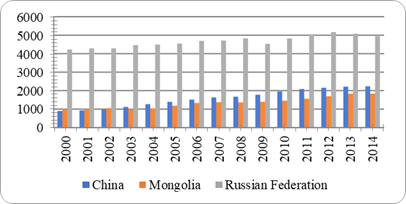
The same dynamics is demonstrated by per capita CO2 emissions, while in Mongolia there is a significant jump in the indicator in 2013-2014.
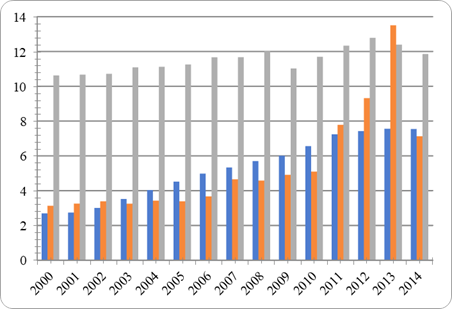
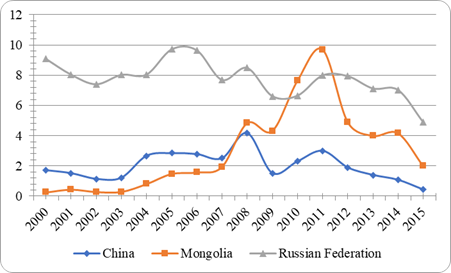
Despite the increase in average per capita consumption, the energy intensity of GDP in all countries is falling, the most significant reduction in the indicator for the periods under review is demonstrated by Russia, as well as with respect to CO2 emissions (Figure
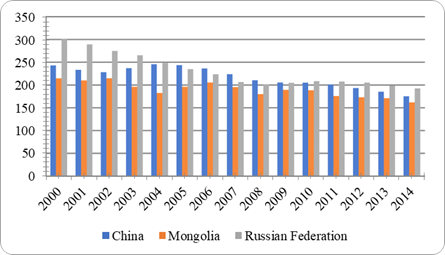
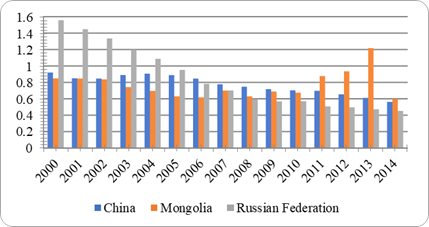
Estimating the structure of carbon dioxide emissions, it should be noted that in China, manufacturing and construction account for about 30-35% of the total; in Russia, this indicator is relatively stable (about 10%), in Mongolia, growth has occurred since 2005 (from 5% to 10 ... 15%). The contribution of transport to emissions is most significant in Russia (12 ... 16%), the minimum for China is about 8% (Carbon Dioxide Information Analysis Center, n.d.).
Each country faces the problem of depletion of energy resources against the backdrop of population growth and per capita energy consumption (Figure
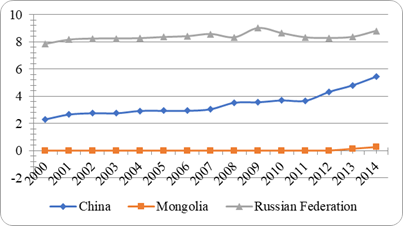
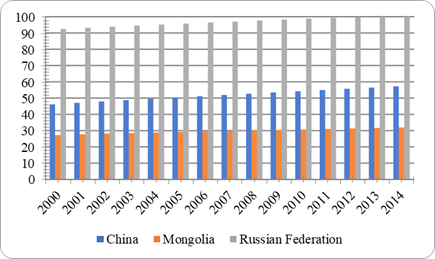
However, this direction certainly has prospects for development, as evidenced by the level of access to clean fuels (Figure
Within the framework of the considered cooperation, SREB and EEU are supposed (Matveev, 2017):
Creation of new capacities (in the Republic of Armenia – construction of the Meghri hydropower plant (the first stage of work was started in 2012), also power plants near Lari-Berd and Shnokh cities; Belarus – construction of the BelAPS; in Kazakhstan – construction RES power plants with a total capacity of more than 3 GW, according to the state plan for the development of renewable energy; construction of the Kambar-Aty-1, Verkhne-Narynsky cascade of hydroelectric power stations, the tunnel HPS on the Kokomeren river in Kyrgyzstan, the North-South ETL; etc.)
Infrastructure development (development of the grid economy of the Republic of, Belarus preparation of the national EES for the connection of BelAPS according to the “Comprehensive plan for the development of the electric power industry up to 2025 by the introduction of the Belarusian nuclear power plant”
At the same time, there is an expansion of the energy cooperation between the countries through the expansion of the capacity of the Iran-Armenia gas pipeline system, the construction of the ETL Armenia-Georgia, Armenia-Iran, the power transmission capacity of Belorussia-Poland, Belarus-Ukraine, the synchronization of the EES of Kazakhstan with the EES of China, countries of central Asia
Russia's participation is associated with such projects as the GPS “Power of Siberia-1” (the eastern route); “Force of Siberia-2” (western route); “The Power of Siberia-3”: Sakhalin – Khabarovsk – Vladivostok – China (the third route of gas supplies to China); construction of a plant for the production of LNG on the Yamal Peninsula, etc.
Conclusion
This study shows the prospects of cooperation between countries in the framework of the initiative “One Belt and One Road” This is due to the increase in per capita energy consumption. The growth in average per capita CO2 emissions amid a reduction in the energy intensity of GDP indicates prospects for cooperation not only in the field of energy, but also in the development and implementation of energy-saving technologies, as well as alternative energy.
References
- Carbon Dioxide Information Analysis Center (n.d.). Environmental Sciences Division, Oak Ridge National Laboratory, Tennessee, United States. Received September 11, 2018, from http://cdiac.ess-dive.lbl.gov/.
- Chien, T., & Hu, J.L. (2007). Renew able energy and macroeconomic efficiency of OECD and non OECD economies. EnergyPolicy, 35, 3606-3615.
- Fang, Z., & Chen, Y. (2017). Human capital and energy in economic growth – Evidence from Chinese provincial data. Energy Economics, 68, 340-358. DOI:
- IEA Statistics © OECD/IEA. (2014). Received August 07, 2018, from http://www.iea.org/stats/index.asp, subject to https://www.iea.org/t&c/termsandconditions/
- Khademvatani, A., & Gordon, D.V. (2013). A Marginal measure of energy efficiency: The shadow value. EnergyEcon, 38, 153-159.
- Kraft, J., & Kraft, A. (1978). On the relationship between energy and GNP. Journal of Energy and Development, 3, 401-403.
- Liu, L., Chen, T. and Yin, Y. (2016). Energy Consumption and Quality of Life: Energy Efficiency Index. Energy Procedia, 88, 224-229.
- Mardani, A., Zavadskas, E.K., Streimikiene, D., Juson, A., Khoshnoudi, M. (2017). A comprehensivere view of data envelopment analysis (DEA) approach in energy efficiency. Renewable & Sustainable Energy Reviews, 70, 1298-1322.
- Marias P., Martinez F., De Miguel C. (2006). An economic well being index for the Spanish provinces: a Data Envelopment Analysis approach. Social Indicators Research, 77(3), 395-417.
- Matugina, E.G., Pogharnitskaya, O.V., Dmitrieva, N.V., Grinkevich, L.S., Selenchuk, J.O., Strelnikova, A.B. (2016). Evaluating perspectives of economy “decarbonation” – environmental aspect. IOP Conf. Series: Earth and Environmental Science, 43(1), 012042 Received August 07, 2018, from http://iopscience.iop.org/article/
- Matveev, I. (2017). Energy track of conjugation of the Eurasian Economic Union and the Silk Road Economic Belt. Drilling and oil, 5. Received September 11, 2018, from https://burneft.ru/archive/issues/2017-05/8.
- Stern, D.I. (2000). A multi variate cointegration analysis of the role of energy in the US macroeconomy. EnergyEconomics, 22, 267-283.
- World Bank, Sustainable Energy for All (n.d.) Received September 07, 2018, from https://datacatalog.worldbank.org/dataset/sustainable-energy-all
- World Bank staff estimates based on sources and methods in World Bank's (n.d.). «The Changing Wealth of Nations: Measuring Sustainable Development in the New Millennium» Received September 01, 2018, from https://openknowledge.worldbank.org/handle/10986/2252
- Zhang, X.P., Cheng, X.M., Yuan, J.H., Gao, X.J. (2011). Total-factor energy efficiency in developing countries. EnergyPolicy, 39 (2), 644-650.
Copyright information

This work is licensed under a Creative Commons Attribution-NonCommercial-NoDerivatives 4.0 International License.
About this article
Publication Date
02 April 2019
Article Doi
eBook ISBN
978-1-80296-058-7
Publisher
Future Academy
Volume
59
Print ISBN (optional)
-
Edition Number
1st Edition
Pages
1-1083
Subjects
Business, innovation, science, technology, society, organizational theory,organizational behaviour
Cite this article as:
Pogharnitskaya, O., Matyugina, E., Radionova, E., & Babaeva, F. (2019). One Energy Zone, One Way Of Sustainable Development (The Silk Road Countries). In V. A. Trifonov (Ed.), Contemporary Issues of Economic Development of Russia: Challenges and Opportunities, vol 59. European Proceedings of Social and Behavioural Sciences (pp. 173-180). Future Academy. https://doi.org/10.15405/epsbs.2019.04.20

