Transaction Costs And Their Impact On The Development Of The Fisheries Cluster
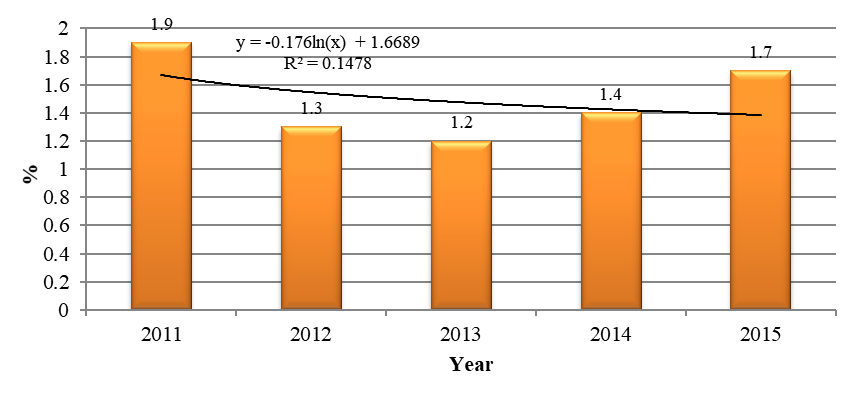
Figure 2: Dynamics of the gross added value of the Kaliningrad region for 2011-2015, percentage, Note: Source: complied by the author according to Rosstat (http://www.gks.ru/).