
Building Strategies For The Control Of Activities On Suburban Trains – Theoretical Foundation


Abstract
The article deals with the theoretical grounds for the practical organization of the control activities of the services of suburban passenger companies (SPC) for the payment of fare in suburban railway service. Proceeding from the probabilistic approach to interpreting contacts between passengers and inspectors in electric trains, models of expected payment of fare at different control intensities are built up, estimates of passengers' savings in paying fare with their evasion from payment, and dependencies of incomes and losses in the collection of payment of fare on commuter trains are given. The suburban transportation complex of Russian Federation faces great financial difficulties. Estimates of the likelihood of transportation rules violation are individual; they are deduced from experience situations in numerous trips. The staffing of the inspecting teams should correspond to the optimal ratio of costs for maintaining the control and losses from lost profits. As the simplest tool for identifying these "disguised" fare-beaters an analysis of the departure of passengers from arrival stations in the opposite direction can be applied. Daily correspondence of passengers between stations, because of the transportation of these passengers, goes beyond the limits of random. These deviations indicate distortions of statistically stable characteristics of passengers’ trips between the corresponding points. The discrepancy between the number of tickets, their departure points and destination points – in the forward and backward directions, do not match with the logic of unexplained statistical discrepancies. And require the use of special methods to identify the "hidden" free-riders.
Keywords: Commuter trainsticketsfareinspectionincomesmake-out
Introduction
Suburban rail passenger transportation is widespread worldwide today. In Russia, about 1 billion passengers use electric commuter trains per year. Suburban transportation has a special social significance in our time. It contributes to the mobility of a workforce, from which the indicators of the economic development of the terrain grow. The popularity of this kind of transportation is high, and not only in regions where it is non-alternative (in areas with poor roads like Eastern Siberia and the Far East), but also in large megalopolises such as Moscow, St. Petersburg, other cities with populations from several hundred thousands to over million people. The conveyance of population with the help of suburban railway transport can solve the problem of "traffic jams" and significantly improve the ecological situation in a region. For many millions of people, the demand for rail transportation over time not only does not decrease, but, on the contrary, increases, despite the seemingly evolving infrastructure of motor transport. The explanation for this is that suburban transportation by electric trains is more convenient for passengers and requires lower costs (Markina, 2017).
Problem Statement
However, the suburban transportation complex of Russian Federation faces great financial difficulties. According to Kobzeva (2013), the total revenue from transportation activities is 64.7 billion rubles. Total revenues of transport companies in 69 regions (excluding the cities of Moscow and St. Petersburg, Moscow and Leningrad regions) from transportation by passenger companies in suburban traffic amount to 15.7 billion rubles. That is, the total amount of revenues in 69 peripheral regions account for about 32%, and 68% (49 billion rubles) of total revenues are received in the central megalopolises. The total cost of companies for suburban passenger transportation amounted to 98 billion rubles. Of these, 44 billion accounted for megalopolis companies and 54 billion rubles for companies in other regions.
Obviously, the income received is not enough to cover all expenses. The overall deficit is 34% (1-64.7/98). The main reason for the high losses of suburban railroad transportation is the small number of passengers filling the trains (Sil’chenkov, 2011). There is a problem of finding ways to increase incomes. In this connection in a series of other important top-priority measures called for a reduction in the loss of revenue from free (fare-evading) transportation of passengers (Ali, Eliasson, & Warg, 2017; Robenek, Azadeh, Maknoon, de Lapparent, & Bierlaire, 2018; Bouleta, Zargayounabd, Leurentcd, Kabalanc, & Ksontinia, 2017).
The estimation of the scale of fare-beaters’ transportation was impressive (40-60%), which led to widespread, urgent and systematic measures to suppress the free-riding of passengers in electric trains (Zarubina, 2012). The use of turnstile passes of passengers to electric trains and inspecting escorts of electric trains showed their high efficiency. The payback period of the turnstile equipment was 1.1 years, and the profitability of costs for car escort by inspectors was 1.1. However, it is economically expedient for mass passenger transportation and relates to suburban transportation of passengers in the vicinity of megalopolises: with an intensity of 2.5 thousand passengers per hour for a turnstile pass to the trains to board; and with a high occupation of cars and intensive rotation of passengers on the routes of traffic – for the presence of inspectors-conductors in each car. In all the remaining regions of the country serviced passenger traffics are significantly – several times – lower. To assess, the company's percentage in suburban passenger traffic at the Moscow railway junction in 2017 was more than 91%.
According to the director of sales of the company (Passenger transportation of Russian Railways, 2018; Prospects for the development of suburban railway traffic, 2018) today about 15% of passengers use the company's trains daily without paying the fare. That indicates, on the one hand, the success in the work to reduce the fare-beating at the Central SPC – to more than 3 times, and on the other hand – for still a large number of free-riders – about 12 million (TASS, 2017).
Research Questions
In all countries, work is underway to prevent this negative social and economic phenomenon – fare-beating or free-riding.
The motive of a fare-beater is the desire to save money with free-ride on public transport. When developing a decision on such a trip, the offender evaluates the probability of meeting the inspectors (Gurník, 2016; Ellison, Ellison, Greaves, & Sampaio, 2017; Xu, Jia, Ghiasi, & Li, 2017). Reasoning about probability estimates is subconsciously built on the statistical characteristics of observations of the experience of daily participation in the transport life of suburban trips.
Purpose of the Study
Estimates of the likelihood of transportation rules violation are individual; they are deduced from experience situations in numerous trips. Hence, the probability of buying a travel ticket (pT) by the risking passenger is a dynamic, situational statistical function depending on probability assessment of the penalty (pP) with fine SF in conjunction with the payment of the ticket price ST. The punishment for a fare-beater is connected with the probability estimation (pP), depending on the experience of regularity of his meetings with inspectors. The less frequent the meetings are, the higher the passenger's confidence in the possibility of a free trip, and the lower his assessment of the probability of punishment (pP). The process of checking passengers by ticket inspectors is well described in terms of queuing system (QS), applicable to QS with limited waiting time requirements.
Research Methods
The key indicator of the effectiveness of such a QS is the efficiency factor γ=λ/μ (the ratio of the rate of arrival of the requirements λ to the capacity of the service station μ). Hence, the probability (pP) is proper to be represented by a function of γ, (pP (γ)), and pT(pP).
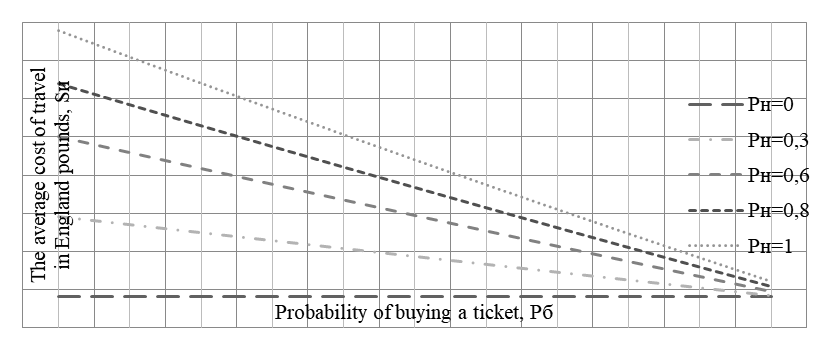
Having determined the set of probabilistic characteristics, we can represent the model record for determining the economic motive of the fare-beater – (SE) (Davydov, Kablukova, & Godyaev, 2016; Zhang, Qin, Meng, Wang, & Zhu, 2016; Gestreliusa, Aronssona, & Petersonb, 2017). The average value of expected costs for the fare for a risking passenger (SE), after not complicated conversions, will look like:

Taking the cost of the ticket ST = 1 £, the probability of meeting with an inspector pP(γ) = 0; 0.3; 0.6; 0.8; 1.0, and the rate of fine SF = 35 £ (for example, for a London passenger), we get the average cost of a passenger's expenses for different values of the ticket purchase probability pT(γ) in the range from 0 to 1.0 (Diagram 1). The passenger who saves on paying for the trip, chooses a free-ride version of the trip only in case of "hitting" his ratings in the win zone, that is, ST-SE ≥0.
Russian free-riders, in fact, do not expose themselves to danger of fines. For them, a fine is more compulsion to pay the fare ST and the service payment SS for purchasing a ticket on the train. Replacing the values (SF) with values of (SS), we can build similar diagrams for the Russian conditions.
The formula for the cost of a trip (1) will have the form (2). The role of the fine is played by the service fee (SS):

Without the use of fines (SF = 0) to a free-rider (pT = 0) and without charging for ticket sale services in cars (SS = 0), the dependence of the average cost of a fare-beater’s expenses (SE) will be:

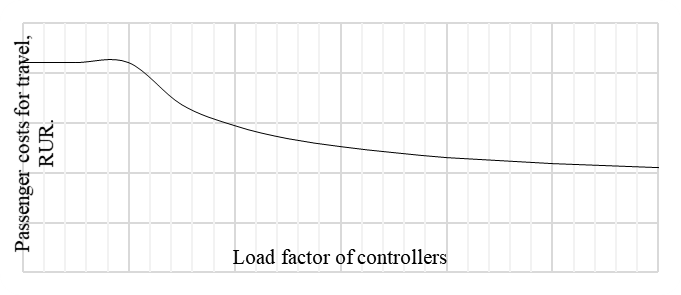
The change in a passenger’s average expenses SE with probability of a free trip at the level of 0.5 and different values of an inspector’s efficiency factor can be seen in the Diagram 2. Boarded passengers A are distributed among k inspectors, λ = A/k; the performance of each inspector is the same and equals to μ. Average expenses for all passengers boarding the train will be:
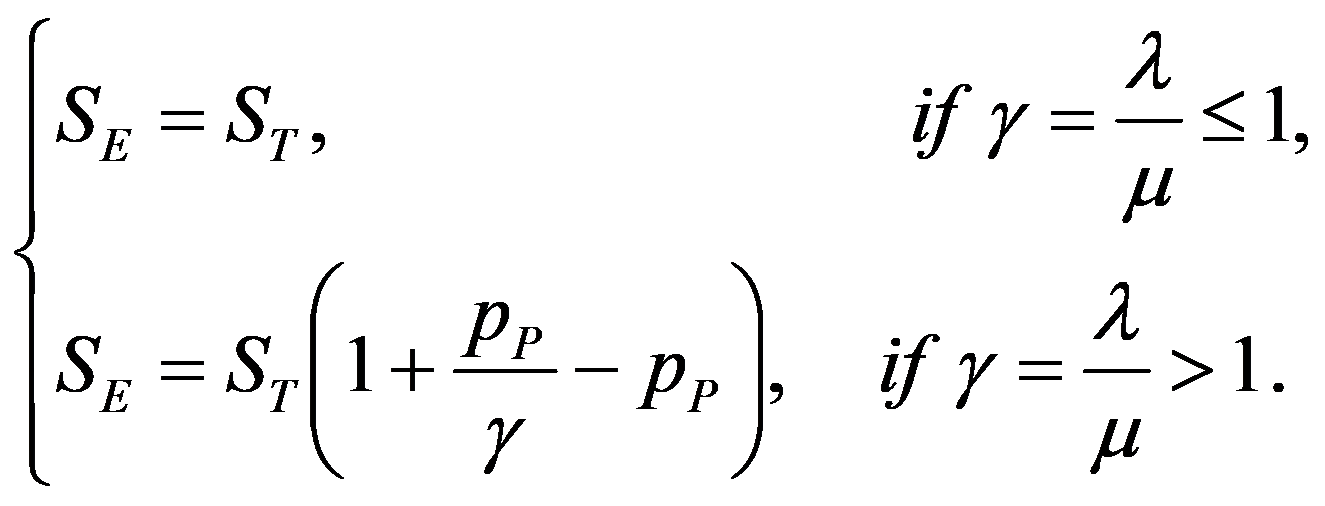
Expressions (4) show that for γ = 0..1 the entire passenger traffic was theoretically inspected and all of them received tickets at the cost of ST. At γ = λ/μ > 1, the number of passengers μ will be with tickets, and (γ-μ) passengers will not be checked, and of these 50% are free-riders. Then the average payment for all passengers SE will decrease. With increasing γ, SE will decrease, as the proportion of fare-beaters will increase. Therefore, on the routes of electric trains with intensive mass rotation of passengers, it is necessary to monitor the value of γ, compiling teams of inspectors to meet the following condition:
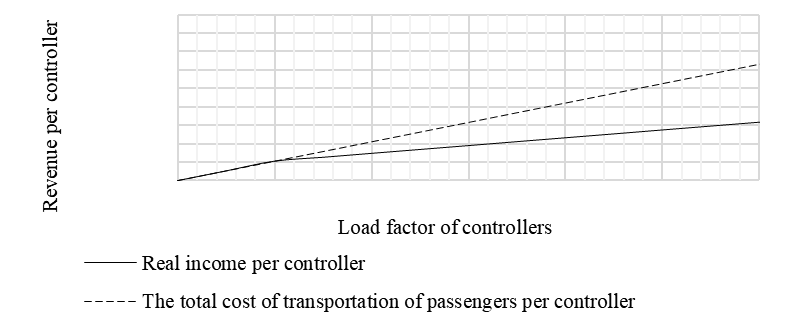
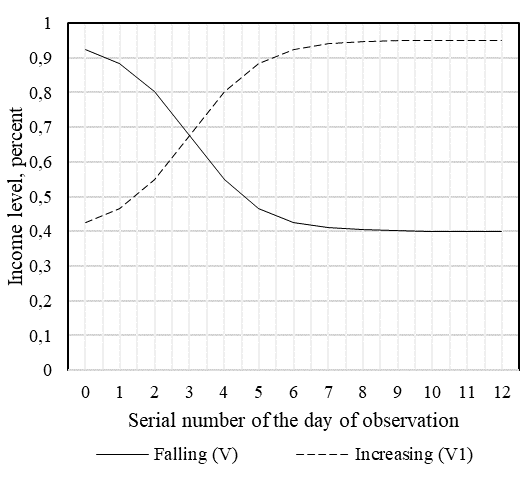
The revenue of SPC from the sale of tickets to passengers, in the case of a small portion of fare-evading (for example, 5%) corresponds to the 95% possible income of the company. On the Diagram 4 this is a horizontal line at the level of 95%. In the case of long-term operation of an electric train on a route in the absence of inspectors, all potential fare-beaters become real ones. Then the level of income on the diagram will fall to the minimum value (fare payment by conscientious passengers and passengers-exempts). If this part of passengers is 40% of the total number of passengers carried, the minimum income line will be at this percentage level. In the range between the lines (M) and (M) there are fluctuations in paid fare when implementing ways to control free-riding with different regularities. Graphs of falling incomes from level (M) to level (M) 1, and growing incomes from (M) to (M) – 1' are described by the lines of logistic functions (V) and (V1).


Findings
From the chart of combining the graphs of falling and growth of the revenue during the break in inspector’s control, you can see irreplaceable losses in the revenue of SPC (up to 40% of the possible amount of fare). Breaks in the control are acceptable, if at all, only at the shortest intervals, which do not allow a deep drop in revenue (up to (m)). The staffing of the inspecting teams should correspond to the optimal ratio of costs for maintaining the control and losses from lost profits. On sections of routes of electric trains with intensive mass rotation of passengers it is necessary to monitor the value of
Conclusion
In addition to the obvious losses from the ticketless travel of pure fare-beaters, there is also a transportation of passengers paying for their fare partly. Actions of SPC against fare-evading have forced most of the free-riders into the group of “partially bona fide" passengers. Of course, they remained the same in the internal mood, forced into the group of minimum payers. And today this is perhaps the most numerous part of free-riders. Their identification requires a fairly painstaking analytical and operational work of the control and inspecting services of the SPC.
As the simplest tool for identifying these "disguised" fare-beaters an analysis of the departure of passengers from arrival stations in the opposite direction can be applied. Daily correspondence of passengers between stations, because of the transportation of these passengers, goes beyond the limits of random. These deviations indicate distortions of statistically stable characteristics of passengers’ trips between the corresponding points. The discrepancy between the number of tickets, their departure points and destination points – in the forward and backward directions, do not match with the logic of unexplained statistical discrepancies. And require the use of special methods to identify the "hidden" free-riders.
References
- Ali, А.А., Eliasson, J., & Warg, J. (2017). Measuring the socio-economic benefits of train timetables application to commuter train services in Stockholm. Transportation Research Procedia, 27(2017), 849-856. DOI:
- Bouleta, X., Zargayounabd, M., Leurentcd, F., Kabalanc, B., & Ksontinia, F. (2017). A dynamic multiagent simulation of mobility in a train station. Transportation Research Procedia, 27(2017) 744-751. DOI:
- Davydov, B., Kablukova, K., & Godyaev, A. (2016). Prediction of the train traffic in a transport corridor. Procedia Engineering, 165(2016), 1430-1436. DOI:
- Ellison, R.B., Ellison, A.B., Greaves, S.P., & Sampaio, B. (2017). Electronic ticketing systems as a mechanism for travel behaviour change? Evidence from Sydney’s Opal card. Transportation Research Part A: Policy and Practice, 99(May 2017) 80-93. DOI:
- Gestreliusa, S., Aronssona, M., & Petersonb, A. (2017). A MILP-based heuristic for a commercial train timetabling problem. Transportation Research Procedia. 27(2017), 569-576. DOI:
- Gurník, P. (2016). Next generation train control (NGTC): More effective railways through the convergence of main-line and urban train control systems. Transportation Research Procedia, 14(2016) 1855-1864. DOI:
- Kobzeva, M. (2013). Train: death is just around the corner [Ehlektrichki: smert' ne za gorami]. RBK. URL: https://www.rbc.ru/economics/15/05/2013/5704086d9a7947fcbd448d5c. Accessed: 01.02.2018. [in Rus.].
- Markina, I. (2017). The fare in electric trains will be raised from January 1 [Stoimost' proezda v ehlektrichkah podnimut s 1 yanvarya]. Novosti regionov Rossii. URL: http://skoronovosti.ru/news/2017/12/27/689486-stoimost-proezda-v-elektrichkakh-podnimut-s-1-yanvarya.html. Accessed: 01.02.2018. [in Rus.].
- Passenger transportation of Russian Railways [Passazhirskie perevozki RZHD] (2018). URL: http://provodim24.ru/passazhirskie-perevozki-rzhd.html. Accessed: 01.02.2018. [in Rus.].
- Prospects for the development of suburban railway traffic [Perspektivy razvitiya prigorodnogo zheleznodorozhnogo dvizheniya] (2015). URL: http://www.informio.ru/publications/id1171/Perspektivy-razvitija-prigorodnogo-zheleznodorozhnogo-dvizhenija. Accessed: 01.02.2018. [in Rus.].
- Robenek, T., Azadeh, S.S., Maknoon, Y., de Lapparent, M., & Bierlaire, M. (2018). Train timetable design under elastic passenger demand. Transportation Research Part B: Methodological, 111, 19-38. DOI:
- Sil'chenkov, I.A. (2011). Suburban rail transport: transportation organization and tariff policy [Prigorodnyj zheleznodorozhnyj transport: organizaciya perevozok i tarifnaya politika]. Transport Rossijskoj Federacii, 6(37), 46-49. [in Rus.].
- TASS (2017). More than 12 thousand stowaways were fined in electric trains in Moscow in 2017 [Bolee 12 tyc. bezbiletnikov oshtrafovali v ehlektrichkah Moskvy v 2017 godu]. TASS: Informacionnoe agentstvo Rossii. URL: http://tass.ru/moskva/4972043 (in Rissian). Accessed: 01.02.2018. [in Rus.].
- Xu, Y., Jia, B., Ghiasi, A., & Li, X. (2017). Train routing and timetabling problem for heterogeneous train traffic with switchable scheduling rules. Transportation Research Part C: Emerging Technologies, 84(November 2017) 196-218. DOI:
- Zarubina, M.V. (2012). Increasing the effectiveness of suburban electric trains RZD [Povyshenie ehffektivnosti prigorodnyh ehlektropoezdov RZHD]. Russkaya Shkola Upravleniya. URL: http://protestirui.ru/2012-12-21-17-00-39/56. Accessed: 01.02.2018. [in Rus.].
- Zhang, L., Qin, Y., Meng, X., Wang, L., & Zhu, T. (2016). MPSO-based model of train operation adjustment. Procedia Engineering, 137(2016) 114-123. DOI:
Copyright information

This work is licensed under a Creative Commons Attribution-NonCommercial-NoDerivatives 4.0 International License.
About this article
Publication Date
20 March 2019
Article Doi
eBook ISBN
978-1-80296-056-3
Publisher
Future Academy
Volume
57
Print ISBN (optional)
-
Edition Number
1st Edition
Pages
1-1887
Subjects
Business, business ethics, social responsibility, innovation, ethical issues, scientific developments, technological developments
Cite this article as:
Sankov, V., Morozov, S., & Bogatyreva, I. (2019). Building Strategies For The Control Of Activities On Suburban Trains – Theoretical Foundation. In V. Mantulenko (Ed.), Global Challenges and Prospects of the Modern Economic Development, vol 57. European Proceedings of Social and Behavioural Sciences (pp. 399-406). Future Academy. https://doi.org/10.15405/epsbs.2019.03.40