
Econometric Modeling Of External Migration


Abstract
The entry into contemporary digital global economy demands quantitative analysis of social-economic processes. It is impossible to study current global economic processes without taking into account migration processes. Globalization and social-economic transformation in modern society caused many changes in the nature and behavior of migration. This study reports on the findings of econometric analysis and modeling of external migration. Statistics on several countries of Europe, Asia, and America is collected. Analyzed the main trends of modern international migration. From the variety of causes of population migration, socio-economic reasons are taken as the basis of the study. The system of social-economic indices, which reflects and characterizes migration processes, is suggested. Essential factors of external migration are determined. Gross National Income and country’s crime rate are identified as the most critical for the number of migrants in the country. Various econometric models of international migration are constructed, compared, and verified statistically. Statistical benchmarks are used to select the best types from a variety of the constructed regression models. Point and interval forecasts for the number of migrants arriving in the country are obtained. The time period of 2015 and 2017 are chosen to compare the constructed models. The results could be applied to research and forecast migration processes.
Keywords: Econometric modelexternal migrationforecastingmigration processes
Introduction
Integration of Russian virtual environment into Eurasian Union is the main provision of Economic Development Program adopted by the Russian Federation government in 2017. To implement that program the government allocated considerable financial and technical resources. With the growth of global population digital economy affects more and more facets in society. The more population is involved into digital environment the higher its efficiency is, although the load on the environment becomes heavier. Thus, the tasks of identifying and forecasting social-economic indicators with digitally suitable tools become especially significant. Development of new and using proved quantitative econometric analysis, construction of new forecasting, planning and management models, that take into account migration component, are needed.
Economic and social features of migration has been studied and described by the whole cohort of researchers, see for example Chernyak & Ognev (2012), Nguyen & Summermatter (2017), Batishcheva & Zhuravleva (2015), Livshits (2010), Makhmudova & Koroleva (2016), Stebunova (2014), Vakulenko (2012) explored the issues of internal and external migration in the RF and CIS countries.
In their comprehensive study of international migration Chernyak & Ognev (2012) classified several trends that could be observed in current migration processes. Among others they name globalization of migration flows, growth of illegal and forced migration, which is caused by the increased number of armed conflicts and national polarization. The authors also claim that the demographic importance of international migration for developed countries has increased and demonstrates clear labour correlation.
The econometric models that have been applied to analysis in this paper had been previously used by the authors Batishcheva & Zhuravleva (2015), Makhmudova & Koroleva (2016), Stebunova (2014) and Vyacheslavov (2015). To study regional and external migration flows the researches applied various social and economic factors.
The issues of migration forecasting have been studied in the works of Fuchs, Soehnlein, & Weber (2018), Manakov & Suvorkov (2018), Ramos & Surinach (2017), Wilson (2017). Fuchs, Soehnlein and Weber (2018) examined forecasting with correlation matrices. The dynamic approach based on time series analysis has been applied in the works of Manakov & Suvorkov (2018), Ramos & Surinach (2017) and Wilson (2017).
Although the topic of migration has been well studied, but in recent decades migration processes have undergone significant transformation (Tsapenko, 2018). Globalization of social-economic and political relationships is seen as an essential context for research (Chernyak & Ognev, 2012; Fuchs, Soehnlein, & Weber, 2018; Jakovljevic, Netz, & Buttigieg, 2018). That is why modeling and forecasting of migration is an urgent issue under current social, political and economic transformations in the world.
Problem Statement
One of the most well-known tools for studying migration processes is to calculate the number of migrants, who has entered the country. Europe is chosen by migrants as a preferred destination point due to its high living standards. More than 30% of migrants go there. The most popular among European countries are Germany, France, Spain and Greece. Host countries are divided according to additional circumstances. Israel is popular among post-Soviet countries. Political instability and conflicts are also causes migration. For instance, in 2015 the Ukraine was the second in the list of countries with the biggest number of residents who left the country. However, the number of residents, who returned home increased, when the ceasefire was announced and the situation stabilized.
Let us consider the task of construction the space econometric model of external migration. The resultative indicator is the number of migrants in the country. Statistical data for 2015 were collected on 22 countries of Europe, Asia, and America taken from International Monetary Fund (IMF), The World Bank, Numbeo, United Nations, United Nations Economic Commission for Europe (UNECE), ten countries of which are shown on Figure
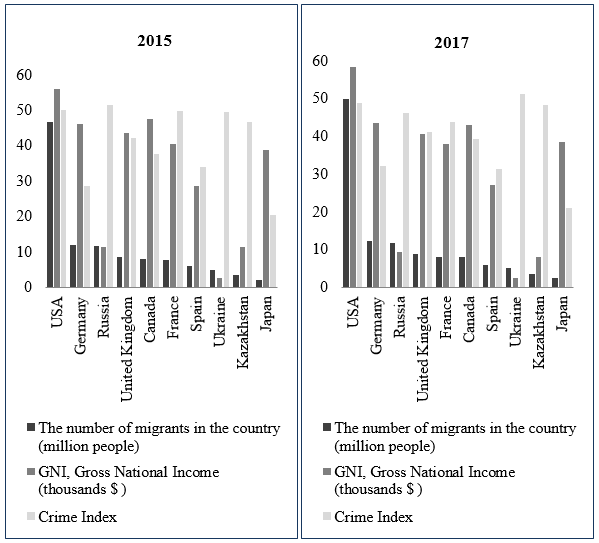
To model external migration the following socio-economic indicators, that determine the number of migrants Y (million people), were selected as factors: X1 – Gross National Income (thousands of the US dollars per capita); X2 – unemployment rate (%); X3 – gross monthly wages (the US dollars); X4 – average monthly rent price for downtown one bedroom apartment in the capital city (the US dollars); X5 – Crime Index; Z – favourable migration policy (1 – present, 0 – absent).
Migration factors are generally classified into social-economic, political-military, religious, natural, ecological, historical and housekeeping ones (Vyacheslavov, 2015). It also has been stated that the main reason for external migration is high living standard and high level of remuneration in host countries. Thus, gross national income and gross average monthly wages were taken as the factors influencing the number of migrants. Unemployment level is also chosen as a vacancy influencing factor because labour migrants represent a solid proportion of their total number. Absence or lack of professionals in a definite region encourage the increase in wages within this profession and hence stimulates the migrants’ inflows. That is why average wages is often chosen as a factor influencing the migrants’ number as it was demonstrated in (Stebunova, 2014).
Average monthly rent for one bedroom flat was also chosen as one of the factors as it can stimulate or limit migration.
It was mentioned in different research papers that the majority of migrants from African and Asian countries are not eager to get new skills, so they are not qualified for work in complex manufacturing enterprises. A big proportion of migrants fills in the niche with hard and low skilled jobs or lives on social benefits. The evidence has demonstrated that there is an inclination to marginal behaviours among migrants. Thus, as it was argued in the articles by Kondratenko (2008) and Polonsky (2015) that some migrants go to the countries with high crime rate to get more chances to get income in the absence of legal employment opportunities. Crime rate index was also chosen as a factor for our model.
The quality of migration flows has changed (Chernyak & Ognev, 2012). The proportion of educated migrants has grown. Several countries, for example the USA, France, Canada, Sweden adopted special programs for high-skilled workers. The dual nature of migration policy and its tightening and regulation have been observed. After toughening of the Russian migration legislation in 2015 a number of measures was adopted. It was forbidden to enter Russia with internal passports for the Ukrainian citizens, who are not refugees, and the citizens from CIS countries that are not members of EAEU. The job patent became obligatory. Russian language, Russian history and the RF basic legislation exams were implemented for migrants to take. Medical insurance also became equally binding for all migrants. The majority of innovations were costly, thus the flow of migrants diminished while the tax burden for employers increased. In 2015 the biggest inflow of migrants was provided by the Ukraine and Kazakhstan. It was mainly due to the simplification of entry rules for EAEU citizens.
Overall, migration policy is critical for migration processes. Thus Z-variable was taken as a dummy variable. Z-variable means favorable migration policy and takes on the value 1, if there are measures of support in the country, and possesses the value 0, when the measures of support are absent or there are measures limiting migration flows.
The set of indicators (factors) was formulated that reflect and characterize migration processes.
Research Questions
Research issues of this study are:
to carry out statistical analysis of migration factors;
to construct econometric models of external migration;
to compare constructed models;
to choose the best models for forecasting;
to obtain a point forecast and an interval forecast the number of migrants in the country.
Purpose of the Study
The aim of this paper is to determine essential factors that could influence the number of migrants in the country and to construct and assess econometric spatial models of external migration and to choose the best models for forecasting.
Research Methods
The approaches to research adopted for this study were ones of mathematical statistics and econometrics. Analysis and data processing were carried out with applied programs Statistica, Gretl and Microsoft Excel.
Findings
Model Construction
The construction of econometric models was preceded with the statistical analysis of all the indices under study.
The tentative assessment of statistical data demonstrated high variation on the resultant indicator. Outliers were analyzed. Smirnov’s criterion was used for calculations. It was established that removal of outliers had lowered the statistical quality of the model. The same could be concluded from the task as the countries’ sample would not demonstrate the real situation in global migration processes without such a big country as the USA.
Table
Different variants of multifactor linear and nonlinear models were constructed based on the undertaken analysis. The best models from the constructed ones were chosen for comparison. Let us consider the regression models of the following type:
(1)
(2)
(3)
(4)
Estimations of parameters and basic characteristics of the models are shown in Table
Notes:
* corresponds to significance of coefficient estimation under significance level 10%;
** corresponds to significance of coefficient estimation under significance level 5%;
*** corresponds to significance of coefficient estimation under significance level 1%.
The next step of research was firstly, to compare various models, and secondly, to compare models with the equations:
The results of assessment of models’ quality (5) - (8) are shown in Table
The criteria were chosen for the best econometric models among those with estimates of regression coefficients significance under the significance level of not less than 10%. Adjusted determination coefficient and statistical model in whole were taken. Among all the models under statistical significance and quality of fit the best one was model (8), the next model was (7). Table
Thus, model (8) was chosen as the best one and its regression equation looks like:
The model (8) was tested on heteroscedasticity (Sukhanova, Shirnaeva, & Mokronosov, 2016) with residual graphical analysis, with White and Breushch-Pagan tests, and with rank correlation Spearman test. The testing gave a negative result. However, heteroscedasticity was observed under Goldfeld-Quandt and Glazer tests. Glazer test showed the following type of heteroscedasticity . It was then eliminated with generalized least squares estimation (GLS). It resulted in the model
( ):
. (9)
In comparison with model (8) the number of standard deviations (given in brackets) in model (9) decreased after application of GLS. Estimated regression coefficients became statistically significant under the significance level of 5%. Subsequent test for heteroscedasticity gave a negative result on all tests (White test (test statistic: LM = 11.7632, р-value = P(X2 (11) > 11.7632) = 0.3817), Breushch-Pagan test (test statistic: LM = 4.7720, р-value = P(X2 (4) > 4.7720) = 0.3115)). Therefore, conditions of Gauss-Markov’s theorem were met.
Based on the final (2015) model (9) the forecast was given. The average number of migrants of 1.550 million people was predicted under the average in sample Gross National Income X1 = 22.801 thousands of dollars and Crime Index X5 = 38.380 points. According to the interval forecast the number of migrants will not exceed 4.476 million people with 95% confidence if Gross National Income and Crime Index take equal average values within the sample.
Model Verification Based on Other Statistical Data
Based on the research of external migration within various countries for 2015 statistical data for 2017 were gathered on 21 countries from the previous list (The World Bank, 2017; The World Only, 2018; Numbeo, 2017). The following indicators were taken as the factor indicators influencing the resultant indicator Y, the number of migrants in the country (millions of people): X1 – Gross National Income (thousands of the US dollars per capita) and X5 – Сrime Index. The indicators were taken based on the analysis from 2015 data. Various regressions models were constructed. Table
Based on the comparative analysis, preference was given to the model (10). Regression equation of the model (10) is of the form:
.
The results of statistical quality verification were the following: the estimates of regression coefficients are significant under the level of 7% (regression coefficient estimate under X1 worsens the model’s quality);
demonstrate good explanatory nature of the model; multicollinearity is absent (Table
The forecast was given on the final model (10). The number of migrants will reach 1.704 million people if Gross National Income and Crime Index have the following values on average within the sample, X1 = 22.656 thousand dollars, X5 = 35.175 points. According to the interval forecast under Gross National Income and Crime Index that are equal to average values within the sample the number of migrants will not exceed 9.470 million people with 93% confidence.
Overall, final migration econometric models for 2015 and 2017 differ slightly and demonstrate stability in regression coefficients estimates.
Conclusion
The present study developed the set of indices that influence external migration. The rationale for the choice was given. The vast statistical data were gathered, and various regression models were constructed. The models have been compared and statistically best ones have been chosen. Point and interval forecasts were given. The results of this study indicate that Gross National Income influences migration to the greatest degree. Crime Index in the host country has less influence. The rest of the factors do not have statistically significant influence on the quantity of migrants. The comparison of different models demonstrates the nonlinear character of dependence on Gross National Income. Indicators of living standards in the countries correlate among themselves and that is why they cannot be used in one regression model, but they can be included into different models dependent on the study’s aim. Constructed models for 2015 and 2017 demonstrate slight differences and show the stability of regression coefficient estimates that can be seen a prerequisite for the research of trends in migration processes. The results of the study could be used for forecasting and taking managerial decisions in shaping external migration policies.
References
- Azose, J.J., & Raftery, A.E. (2018). Estimating large correlation matrices for international migration. Annals of applied statistics, 12, 940-970.
- Batishcheva, G.A., & Zhuravleva, M.I. (2015). Economic and Mathematical Modeling of External Russian Migration Flows. Problems of Economics and management, 6 (46), 28-34. [in Rus.]
- Chernyak, A.V., & Ognev, V.V. (2012). Current trends of international migration. Bulletin of social Sciences, 2, 207-212. [in Rus.]
- Fuchs, J., Soehnlein, D., & Weber, B. (2018). Stochastic Forecasting of Labor Supply and Population: An Integrated Mode. Population research and policy review, 37, 33-58.
- International Monetary Fund (2015). Unemployment rate [World Economic Outlook Database]. https://www.imf.org/external/pubs/ft/weo/2016/02/weodata/index.aspx (Accessed 3 September 2018)
- Jakovljevic, M.M., Netz, Y., & Buttigieg, S.C. (2018). Population aging and migration - history and UN forecasts in the EU-28 and its east and south near neighborhood - one century perspective 1950-2050. Globalization and health, 14, 30.
- Kondratenko, Y.V. (2008). Criminological characteristics of ethnic organized crime. Business in the law [Economic and legal journal], 1, 295-297. [in Rus.]
- Livshits, M.L. (2010). Migration population growth in Russia: factors, prospects, conclusions for migration policy. Applied econometrics, 2 (18), 32-52. [in Rus.]
- Makhmudova, M.M., & Koroleva, A.M. (2016). International migration processes in the Russian economy: an analysis of current trends. Bulletin of Omsk University [Economy Series], 58, 41-53. [in Rus.]
- Manakov, A.G., & Suvorkov, P.E. (2018). Forecast of Demographic Processes in Russia and in Countries of Central and Eastern Asia in the 21st Century. Geography and Natural Resources, 39, 16-22.
- Nguyen, D., & Summermatter, S. (2017). Migration and refugees in Europe: figures and facts. International information service of the Swiss national television and radio (SRG SSR). http://www.swissinfo.ch/eng/politics (Accessed 3 September 2018)
- Numbeo (2017). Crime Index by country. https://www.numbeo.com/crime/rankings_by_country.jsp?title=2017 (Accessed 3 September 2018)
- Polonsky, I. (2015). Ethnic crime - a threat to the national security of Russia and other countries. Military review. http://topwar.ru (Accessed 3 September 2018)
- Ramos, R., & Surinach, J.A. (2017). Gravity Model of Migration Between the ENC and the EU. Tijdschrift voor economische en sociale geografie, 108, 21-35.
- Stebunova, O.I. (2014). Modeling and scenario forecasting of external labor migration in the context of Russia's accession to the WTO. Bulletin of the Orenburg state University, 4 (175), 465-470. [in Rus.]
- Sukhanova, E.I., Shirnaeva, S.Y., & Mokronosov, A.G. (2016). Econometric models for forecasting of macroeconomic indices. International Journal of Environmental and Science Education, 11(16), 9191-9205.
- The World Bank (2017). GNI per capita. https://data.worldbank.org/indicator/NY.GDP.MKTP.CD (Accessed 3 September 2018)
- The World Only (2018). Migration statistics: from where and where people move. https://theworldonly.org/statistika-migratsii (Accessed 3 September 2018)
- Tsapenko, I.P. (2018). Transformations of global migration of population. Mirovaya economika I mezhdunarodnye otnosheniya, 62, 65-76.
- UNECE Statistical Database (2015). Gross Average Monthly Wages by Country and Year. https://w3.unece.org/PXWeb2015/pxweb/en/STAT/STAT__20-ME__3-MELF (Accessed 3 September 2018)
- United Nations (2015). International Migration Report 2015. http://www.un.org/en/development/desa/population/migration/publications/migrationreport/docs/MigrationReport2015_Highlights.pdf (Accessed 3 September 2018)
- Vakulenko E.S. (2012). Migration processes in Russian cities: an econometric analysis. Applied econometrics, 1 (25), 25-50. [in Rus.]
- Vyacheslavov, V.N. (2015). Typologization of factors affecting the migration of the population. Territorial development Issues, 7 (27), 1-11. [in Rus.]
- Wilson, T. (2017). Can international migration forecasting be improved? The case of Australia. Migration letter, 14, 285-299.
Copyright information

This work is licensed under a Creative Commons Attribution-NonCommercial-NoDerivatives 4.0 International License.
About this article
Publication Date
20 March 2019
Article Doi
eBook ISBN
978-1-80296-056-3
Publisher
Future Academy
Volume
57
Print ISBN (optional)
-
Edition Number
1st Edition
Pages
1-1887
Subjects
Business, business ethics, social responsibility, innovation, ethical issues, scientific developments, technological developments
Cite this article as:
Zaychikova, N., Sukhanova, E., & Shirnaeva, S. (2019). Econometric Modeling Of External Migration. In V. Mantulenko (Ed.), Global Challenges and Prospects of the Modern Economic Development, vol 57. European Proceedings of Social and Behavioural Sciences (pp. 1097-1107). Future Academy. https://doi.org/10.15405/epsbs.2019.03.110