
Methods Of "New Econometrics" In Study Of Interrelations With Variable Structure

Abstract
The paper discusses the idea and concept of dynamic models of a variable structure, peculiarities of their research in the framework of a “new econometrics” paradigm. During econometric modeling of relationships, it is necessary to take into account presence or absence of structural changes in development of the studied processes. Methods for constructing models with a stable and variable structure are noticeably different at the conceptual level. When modeling relationships using classical econometrics, various data smoothing procedures are widely used. Methods of "new econometrics" allow saving the spectral composition of the studied economic signal, simulating processes of spline approximation. Obtained models of dynamics pass exactly through all nodal points of the process, retaining all local peculiarities of the dynamics, automatically and always reaching the value of the coefficient of determination, equal to one. The study considers the dynamics and dynamic models of both indicators and a part of them, called “economic flows”. Transformation of discrete sets of values of processes under study into economic flows is becoming an effective way to study relationships with a variable structure. By approximating the dynamics by splines, we obtain the best model in terms of the minimal sum of squared deviations. The known properties of cubic splines allow effectively modelling economical flows. The empirical research basis of the study is the dynamics of oil exports to the far abroad countries and CIS countries.
Keywords: Econometricsvariablestructurecorrelationmodellingsplines
Introduction
The evolving economic system of the world is permanently subjected to the transforming effects of internal (endogenous) and external (exogenous) forces. Due to a complex interaction of the external instability of the system and contradictory actions of the subjects inside it, the world economic system is initially in a constant motion (Katkova & Markov, 2014). On the trajectories of economic transformations, there are problems of presenting, describing and modeling an economic signal in a new way. It forces us to respond to the challenges of economic evolution with an idempotent research economic and mathematical platform with a new paradigm, methodology and structure, new approaches, postulates and theses, modern mathematical constructs, professional tools.
Problem Statement
Econometric modeling of relationships requires the presence or absence of structural changes in the development of the studied processes. Methods for constructing models with a stable and variable structure are noticeably different at the conceptual level. When modeling a relationship with a stable structure, future states can be described with extrapolating patterns of their behavior in the past. The necessity and acceptability of averages in empirical data is explained by their probabilistic nature. In accordance with a discrete data set, we set the averaged line of the proposed regression. On the contrary, models of interrelationships with a variable structure should take into account possible structural changes, determine points or time intervals for trend changing, significant changes in communication parameters — its direction, closeness, and a form of presentation. The methods of "new econometrics" help to save a spectral composition of the studied economic signal, simulating the processes of spline approximation (Ilyasov, 2008). The obtained models of dynamics pass exactly through all the nodal points of the process, retaining all local peculiarities of the dynamics, automatically and always reaching the value of the coefficient of determination, which is equal to one (Botasheva & Vintizenko, 2014).
Research Questions
One of the most effective ways to study the relationships with a variable structure becomes the discrete sets conversion of values of the studied processes into economic flows. We meet the concept of "flow" in macroeconomics, which explains that the flow characterizes the number or volume of the studied indicator for a certain period. In contrast, stocks characterize the amount or volume of the indicator recorded at a certain point of time. Flows and stocks are closely interrelated: the flow is the change of the stock (balance of inflow and outflow) over a certain period. The algorithm is known for converting discrete data of the “stock” type into a continuous “flow”, which is based on the definition, where the flows (F) are derived from the stocks: (S): .
Purpose of the Study
If the indicator dynamics of the types “flow” or “stock” can be discrete, then the “economic flow” is represented as a continuous model of dynamics, which describes changes in the development rate of the process also continuously at each moment of time, that is the first derivative of a continuous model of economic dynamics. At this approach, the loss of principle is lost whether the original discrete data were indicators of the type “flow” or “stock”. The way of representing the dynamics becomes fundamental in the form of discrete process values using lattice functions or its description by continuous models. Then the main research goal is to find relationships not in the dynamics of the indicators themselves, but between the trends of their change - “economic flows”.
Research Methods
One of the well-known ways of transition from discrete empirical values of processes to continuous models of dynamics or regression is the construction of the least squares method. In the study of economic flows, models of classical econometrics will be so “smoothed” that important local peculiarity of the “flow” of processes will be lost. The comparison of discrete values of export volumes gives us a correlation coefficient value, which is close to zero 0.178. The hypothesis about the presence or absence of structural changes in the relationships according to the constructed model is impossible, since the resulting regression line is the result of averaging within the entire investigated time interval.
Findings
Any class of approximating functions of a fixed type (“monomodel”) cannot simply and accurately model, analyze, and visualize unsustainable economic dynamics, cycles in it, and predict any economic, industrial, financial, marketing, foreign economic process, that is be relevant to it (Kalazhokov, 2014). It is especially difficult to do it in transitional, transformational economies, where the process “time class” can be represented by a superposition of several “time classes” or a “time class” consistently changing throughout the studied reporting period with variations in exogenous economic conditions at different time intervals (Vygodchikova, Gusyatnikov & Vysochanskaya, 2017).
The next stage of modeling, after the explicit definition of the “time class” of conjunctures at different time intervals, is the construction and connection of local continuous monomodels relevant to these “time classes”, both additive and multiplicative (Lapshin, Kaushanskiy & Kurbangaleev, 2015). When there are many intervals, the “time class” varies from one time fragment to another one, and even stochastically changes in time, it is necessary to find a single continuous ensemble (unified and universal) system of approximating functions (Cleophas, 2016).
For all the above, we have to introduce the concept of a “piecewise” concept. It assumes that it is necessary to present economic conditions “piece by piece”; we are looking for the model, which must consist of separate fragments placed sequentially in the time interval under study (Cáceres-Hernández & Martín-Rodríguez, 2017). The research effectiveness of relationships with a variable structure is provided by the transformation of the "lattice" image of the macroeconomic time dependence into a continuous piecewise-smooth function, described analytically with all analytical derivatives. Fragments from individual intervals of the reporting period must be “stitched” in the “nodes” of the “grid” with their values (to the left and right of each “node”) and the same values of all possible derivatives or finite differences (Sklyarov, 2017).
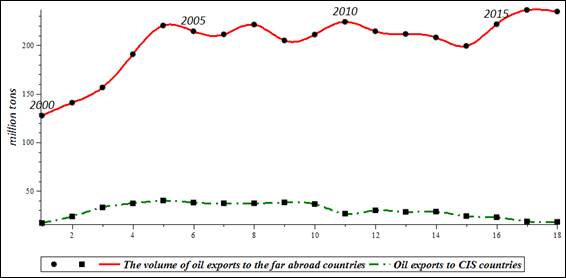
By approximating the dynamics with splines, we obtain the best model in terms of the minimal sum of squared deviations. It always equals to zero with this approach (Kaishev, 2013). One of the most important advantages of spline approximation over MNC models is their piecewise structure, which helps them to adapt to the peculiarities of structurally variable dynamics best of all, preserving information about all actually achieved values, as well as the best representing the interpolation process behavior (Odoardi & Muratore, 2015). For example, the dynamics of oil exports to non-CIS countries between each focal point is represented by a spline - a third-degree polynomial (Fig.
“New Econometrics” dictates the need to make the best use of each value of a variable from the economic “lattice function” (tables). To achieve it, the approximating polynomial model must pass through exactly all points of the real indicator in the system of any dimension, and certainly through all “grid” nodes, a mathematical image of a table or a graph of an economic indicator (Vintizenko & Ilyasov, 2018).
If the spline passes exactly through all the nodes of the “lattice” function, then economic spline modeling, spline analysis, spline visualization, spline forecasting are institutionally accurate and fundamentally, “in large” (Romanova & Ioda, 2015). The model of a new paradigm generates a curve, which has a smooth, continuous, and analytic description, a sequential-variable structure in different time sections, with an internal property of optimality called “minimum norm” or “minimal curvature” in accordance with the Holliday theorem for cubic splines (Odoardi & Muratore, 2016).
When searching for correlation relationships, there are not always changes in the indicators, but they can found in fluctuations in the rate of their change. Thus, it is sometimes effective to compare not the indicators themselves, but their economic flows. To model the economic flows of oil exports, we differentiate spline models of the dynamics of oil export volumes to the far abroad countries and to CIS countries. Economic flows observe the continuous trends of the studied processes - the continuous evolution of the development direction, continuous peculiarities of their mutual influence, and the peculiarities of structural changes in relationships. In the study of relationships with a variable structure, there is a problem to determine the change points in trends, which cannot be done with sufficient accuracy by the methods of classical econometrics. The comparison of economic flows (first derivatives) determines the moments of the onset of structural changes visually, and we can see from the behavior of the curves the duration of preservation of certain communication parameters. The analysis of Figure
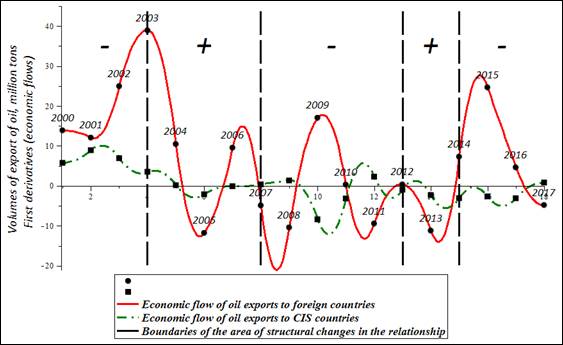
The analysis of the curves in Figure
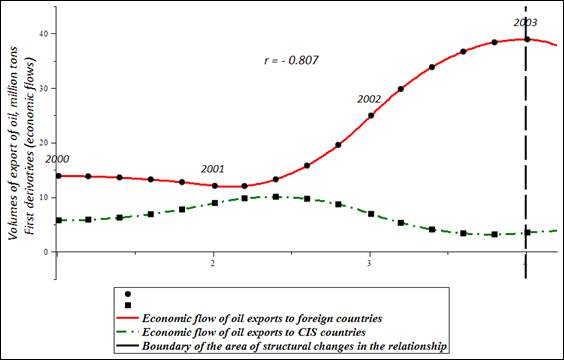
To determine the direction of the relationships within the identified time intervals, we can compare the interpolation behavior of the flows. The construction of continuous spline approximation models of dynamics, followed by their transformation into models of economic flows, allows the researcher to move from comparing discrete states of processes at node points to comparing segments of functions (Ratto & Pagano, 2010). For a quantitative description of relationships closeness, the ability of splines to generate additional points in the intervals between the nodal points of the process becomes useful.
It makes the regression limitations arising from a small number of nodal points weaker. For example, for the time interval from 2003 to 2007, to determine the connection relationships, we generated three additional points inside each of the spline segments. The calculation of the correlation coefficient shows the presence of a strong positive relationship between the flows of oil exports to non-CIS countries and to CIS countries in 2003-2007, where the correlation coefficient is 0.935.
If the calculation of the correlation coefficient between the volumes of oil exports to foreign countries and to CIS countries showed the absence of any significant connection, then the modeling of economic flows revealed “hidden” trends in the processes under the study. Now it became possible to determine the starting points and intervals of structural changes in relationships visually and directly from the behavior of economic flow curves; to observe the duration of relationships parameters, and analyze the peculiarities of the processes transition from one state to the another one.
Conclusion
To sum up, we can say that the least squares method is non-constructive. It requires a researcher to “guess” the shape and analytical formula of a model regression curve. The spline is universal, analytic, automatically constructed; its derivatives are clearly known, phase constructions are also automatically made, etc.
Structural changes in the economy are presented in individual temporal fragments of the reporting period with exogenous economic “rules of the game” - that is, codes, laws, rules, regulations, norms of rates, taxes, tariffs, excises, taxes, quotas, deductions, and preferences remain unchanged. Many of these “rules” vary from fragment to fragment. The model should become representative of modern transformational market economies such as the Russian one, in which the unstable (spontaneous, stochastic), permanent and substantial redistribution of exogenous economic conditions occurs temporally, at some time points. Russian economists talk about a triple change in the year of economic conditions in the country. This is the way how the piecewise concept appears. The device must respond to consistent structural changes in the economic system and its indicators over time.
References
- Botasheva, F. B., Vintizenko, I. G. (2014) "New econometrics" with its "delicate" methods of economic conjuncture research. European Social Science Journal, 31-39.
- Cáceres-Hernández, J. J., Martín-Rodríguez, G. (2017). Evolving splines and seasonal unit roots in weekly agricultural prices. Australian Journal of Agricultural and Resource Economics, 304-323.
- Cleophas, T. J. (2016). Clinical trials: Spline modeling is wonderful for nonlinear effects. American Journal of Therapeutics, e844-e849.
- Ilyasov, R. Kh. (2008). Spline analysis of «delicate» structure of relationships of export costs on oil and gas. Scientific and technical Bulletin, Saint Petersburg State Polytechnic University. Economic sciences, 348-352.
- Kaishev, V. K. (2013). Processes Induced By Dirichlet (B-) Splines: Modeling Multivariate Asset Price Dynamics. Mathematical Finance, 217-247
- Kalazhokov, Kh. Kh. (2014). Modeling and forecasting of time series dynamics (Part 1). Bulletin of Kabardino-Balkarian Scientific Center of the Russian Academy of Sciences, 7-16.
- Katkova, М. А., Markov, V. А. (2014). Application of the hysteresis effect of transactions in modeling of institutional and disequilibrium economy. Bulletin of Tomsk Polytechnic University. Georesource engineering, 112-119.
- Lapshin, V. А., Kaushanskiy, V. Ya., Kurbangaleev, М. Z. (2015). Estimation of zero-coupon yield curve in Russian bond market. Economic Journal of Higher School of Economics, 9-29
- Ratto, M., Pagano, A. (2010). Using recursive algorithms for the efficient identification of smoothing spline ANOVA models. AStA Advances in Statistical Analysis, 367-388.
- Romanova, О. О., Ioda, Е. V. (2015). Tools for risk identification of company’s bankruptcy: MAP-splines device. Socio-economic phenomena and processes, 140-145.
- Odoardi, I., Muratore, F. (2015). Understanding the support of savings to income: A multivariate adaptive regression splines analysis. Advances in Intelligent Systems and Computing, 385-392.
- Odoardi, I., Muratore, F. (2016). Regional income differentials in Italy: A MARS analysis. Advances in Intelligent Systems and Computing, 65-73.
- Sklyarov, А. V. (2017). The algorithm for analyzing the series of economic indicators dynamics based on the device for smoothing normalized B-splines. Bulletin of Rostov State University of Economics, 68-173.
- Vintizenko, I. G., Ilyasov R. Kh. (2018). «New econometrics». Stavropol, Publishing house of Stavropol State Agrarian University «AGRUS»
- Vygodchikova, I. Yu., Gusyatnikov V. N., Vysochanskaya Е. Yu. (2017). Methods of spline approximation for economic processes with unstable trend. Bulletin of Saratov State Social and Economic University, 110-115.
Copyright information

This work is licensed under a Creative Commons Attribution-NonCommercial-NoDerivatives 4.0 International License.
About this article
Publication Date
29 March 2019
Article Doi
eBook ISBN
978-1-80296-057-0
Publisher
Future Academy
Volume
58
Print ISBN (optional)
-
Edition Number
1st Edition
Pages
1-2787
Subjects
Sociolinguistics, linguistics, semantics, discourse analysis, science, technology, society
Cite this article as:
Khizrailevich, I. R., Sergeevich, Y. V., Dmitrievna, M. T., Dmitrievich, T. D., & Mukhadinovich, M. E. (2019). Methods Of "New Econometrics" In Study Of Interrelations With Variable Structure. In D. K. Bataev (Ed.), Social and Cultural Transformations in the Context of Modern Globalism, vol 58. European Proceedings of Social and Behavioural Sciences (pp. 497-504). Future Academy. https://doi.org/10.15405/epsbs.2019.03.02.57