
Socio-Psychological Preferences Of Pedestrian When Choosing Walkable Urban Design

Abstract
In order to create a more comfortable urban environment, the authorities are currently working to reduce the percentage of travel by private car and to encourage the use of alternative types of movement, including walking. Pedestrian traffic is the most accessible and healthy form of movement in the city. It needs a special infrastructure, which is distinguished by a high level of economy, safety and comfort. To create such an infrastructure designers and decision makers need knowledge of the socio-psychological properties of consumer preferences of pedestrians. In different foreign countries, techniques have been developed and applied to assess the consumer quality of pedestrian paths. The quality indicators of the elements of the pedestrian paths taken for evaluation should reflect the preferences of pedestrians. The number and significance of these indicators vary considerably in different methodologies. In addition, they do not take into account the specifics of urban planning practice and design conditions in Russia. This article presents the results of studies of linear sections of pedestrian routes used for targeted movements, cost-effective in time. This method allowed one to find and substantiate the list of indicators affecting the quality organization of pedestrian paths, as well as to determine the significance of each of the indicators.
Keywords: Walkableurbandevelopmentspacesassessmentenvironment
Introduction
The use of pedestrian movements in the city is an integral part of modern urban planning policy. City authorities in various countries are preparing and executing programs for the reorganization of parking space in order to save land and financial resources, the economic benefits of preserving the ecology of the environment, the formation and implementation of programs for the improvement of pedestrian communications for alternative types of movement (SFMTA, 2014). There is a state program of the Moscow region "Architecture and urban planning of the Moscow region" for 2017-2021, 2018 (TRB’s National Cooperative Highway Research Program Synthesis 436, 2016). The scientific basis for this kind of work was the results of research on the actual present value of the placement and operation of the infrastructure for private cars in the city (Shoup, 2014), (Davis, Pijanowski, Robinson, & Engel, 2010). Understanding the inability to use a private car as a mass type of passenger transport, as well as the "unfriendly" urban environment focused on the creation of the appropriate infrastructure, led to widespread use of public transport in passenger traffic, the full functioning of which is impossible without a well-organized pedestrian network, providing access to its stops at the shortest distances.
Problem Statement
Attention to the problems of organizing pedestrian movements has led to the need for a comprehensive study of the factors that increase the attractiveness of the urban environment for pedestrians. In many countries (UK, USA, Australia, New Zealand), methods for assessing the level of service of the pedestrian paths, based on the expert method of assessment, the method of assessment using target groups, have been widely used. Examples of such technologies are PERS in the United Kingdom (Pedestrian Environment Review System, 2009), HCM 2016 in the USA (Highway Capacity Manual, 2016), NZ-Guide in New Zealand (Guide Information for Pedestrian Facilities, 2013), PEDSAFE in Australia (Harkey & Zegeer, 2004), GALLIN in Australia (Gallin, 2001), Residential Street Audit in Greece (Christopoulou & Pitsiava, 2012), (Sdoukopoulos, 2009), Measuring the Quality of the Urban Environment (Devlin, 2013), Pedestrian Evaluation Index (Keyvanfar, Ferwati, Shafaghat, & Lamit, 2018), and etc.
In accordance with these methods, the number of environmental factors affecting the attractiveness of the urban environment for pedestrian traffic varies from 18 to 92.
The assessment of the influence of the same factor on the formation of attractive pedestrian paths in different methods also differs quite greatly.
Due to the significant variation of the influencing factors and their significance, there is a need, based on scientific methods, to establish a list of pedestrian path indicators that determine the choice of traffic conditions by a pedestrian, and the degree of importance of each for the Russian urban planning practice.
Research Questions
In general, the route of the target movement of a pedestrian can be represented as a set of linear sections- links and nodes - pedestrian crossings, elements of the interface of surfaces (Leptiukhova, 2014), (Shesterneva, 2007). The proposed division of the walking route into components was done in order to take into account the factors affecting the ease of movement of a pedestrian and the delimitation of the functional load between them. Links perform a predominantly transport function; their task is to skip pedestrian traffic. A primary, walking route is a link.
In this paper, we study the indicators of the most common element of the pedestrian route - a linear section operating in a residential area and intended for the implementation of targeted pedestrian movements under time pressure. Under the influence of various factors, pedestrian path properties are formed, which can be characterized by its quantitative and qualitative parameters.
In a generalized form, the factors determining the psychological preferences of pedestrians can be divided:
- factors of pedestrian safety (volumes of traffic, speed limits, separation of the pedestrian path from the roadway, organization of pedestrian crossings);
- factors of attractiveness of the urban environment (types and variety of buildings, the presence of outdoor furniture, design);
- factors of personal security (lighting, openness of the pedestrian space);
- physical factors (slope, length, direction and coherence of pedestrian paths, protection from atmospheric influences, condition of the surface of the pedestrian path, convenience for movement of people with limited mobility).
Purpose of the Study
Purpose of the study is to establish a list of indicators of the linear section of the pedestrian path with target movement in a residential area under time constraints and a quantitative assessment of the degree of their influence on the choice of traffic conditions by a pedestrian for the Russian practice of urban planning.
Research Methods
Finding the properties of the linear section of the pedestrian route, determining the choice of a pedestrian under the conditions of Russian realities, was done by constructing a tree of properties according to the rules of applied qualimetry (table
This method, according to one of the theorists of applied qualimetry, G.G. Azgaldov, has repeated approbation in practice and theoretical validity (the method takes into account the latest achievements of theoretical qualimetry), and is also most acceptable when evaluating architectural and town planning (Azgaldov, 1989), (Raikhman &Azgaldov, 1974).
The degree of importance of each of the properties is expressed numerically in terms of weighting factors. The weight should be determined by an expert method.
The study was conducted in two stages. At the first stage, unnormalized coefficients of the weight of the properties were determined by an expert survey, and statistical data processing was performed. At the second stage, the group normalized and tier weight coefficients are calculated.
In total, 55 people took part in the survey. The number of the first group of experts (4th year students, majoring in “urban construction economy) was 48 people; that of the second (highly qualified professionals in the field of study) – 8 people. Since the choice of experts renders the reliability of the results obtained, special attention was paid to the selection of experts and the assessment of their competence. As a result, the study took into account the questionnaires of 44 people.
For expert assessments, a point scale from 0 to 100 with a gradation of 10 points was used. The beginning of the scale is 0 points (there is no property value). The upper limit is 100 points (corresponds to the highest possible significance of the property). The expert was tasked with assigning each property a numerical value Pij (unnormalized group coefficient) within the specified scale. The most important property within each group was assigned a weighting factor equal to the predetermined maximum number (100 points), the coefficient of the next most important property in the group in question is defined as a percentage compared to the most important one. In determining the weight coefficient of the third property, its importance was taken into account in comparison with the first and second. Further comparison was made with the first and any of the specific properties.
The study conventionally assumed that the quality of the experts of the second group is about 2 times higher. In this case, the equivalent number of competent experts participating in the study is 31 people. Using the table "Possible options for expert assessment" (Raikhman & Azgaldov, 1974), it can be argued that the confidence probability of the study is at least 90% with a maximum permissible relative error of 0.3.
Based on the results obtained, statistical data processing was carried out. The weights of the properties assigned by the experts of the first group were checked for consistency using the coefficient of variation Vi:
, (1)
- the standard deviation of the weight coefficient of the i-th property;
– average over all N experts, the value of the coefficient of the weight of the i-th property.
The average values of unnormalized weight coefficients of the evaluated properties at high (according to the classification (Raikhman & Azgaldov, 1974) consistency of expert opinions were calculated by:
,(2)
Pij – unnormalized weight coefficient assigned by the j-th expert to the i-th property of level l relative to the corresponding property of level l-1;
j – number of the expert;
i – property number;
N – amount of experts.
With an average (according to the classification (Raikhman & Azgaldov, 1974) consistency of expert estimates of the i-th property, a qualitative analysis was made of the responses received. If there were emissions in the sample, they were rejected. With a spread of over 25%, the average value of the unnormalized weight coefficient was calculated as harmonic average. To improve the accuracy, the averaging of the weighting coefficients obtained from the experts of the second group was made taking into account the expert's competence index according to the formula:
,(3)
– expert competence indicator.
The average unnormalized weight coefficients of the two groups were compared. Taking into account the accepted attitude that the quality of professional experts is higher, it was proposed to find the total value of unnormalized weight coefficient taking into account the importance coefficients of the opinions of experts of the first group - 0.3 and the opinions of experts of the second group - 0.7. The resulting unnormalized weight coefficient for two groups is calculated by:
,(4)
- average value of unnormalized weight ratio of the first group of experts;
- average value of unnormalized weight coefficient of the second group of experts.
For comfort and clarity in subsequent calculations, all values of the coefficients were increased 100 times. After calculating the average unnormalized weighting factor for each of the properties in the group, the task was to find the normalized group weighting coefficient for each property within one group at each v-level of the “property tree” by the formula:
,(5)
– the weighting factor of the i-th quality property relative to the corresponding level property v-1, normalized within each group of level v-1.
n – number of properties in a group,
wherein .
Then we calculated the weight coefficients of the properties that are on the last tier of the properties tree relative to the quality indicator - the property lying in the root of the tree. To accomplish this task, it is necessary to determine the normalized weighting factors for the properties on each tier of the tree using the formula:
.(6)
All calculations related to the calculation of weighting factors were performed automatically in MS Excel. The weights of the properties of the last tier of the tree are determined with and without the aesthetics property. The weighting coefficients found are constant for linear sections of pedestrian paths in residential areas with the main transport function.
Findings
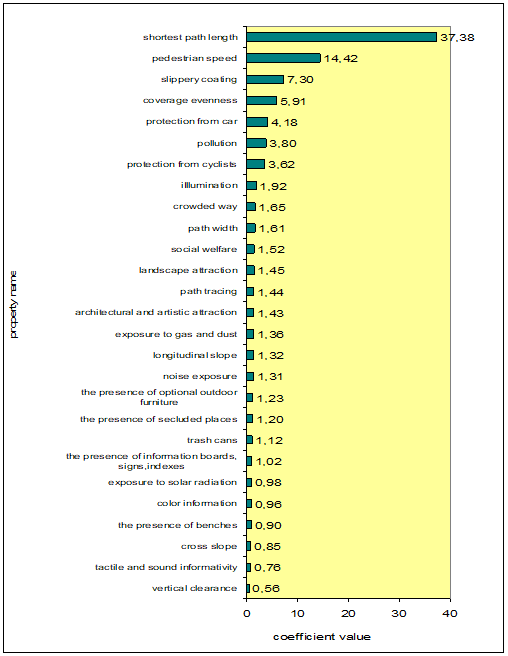
As a result of building a tree of properties, 27 indicators have been revealed that influence the psychological choice of a pedestrian. The analysis of the obtained results was carried out by comparing the found weight coefficients of the properties of the last tier, as well as weight coefficients in the group and tier combinations of properties. For clarity of the results obtained, diagrams were constructed. The values of the weights of the properties in the diagrams are determined by rationing relative to the complex property under consideration.
The analysis of the weight properties that meet the basic requirements of pedestrians to the operational characteristics of a section of the pedestrian path: time efficiency, comfort, safety, revealed that the time saving property has a weight approximately twice as large as the comfort and safety properties which are almost the same (Figure 1a). Both groups of experts showed high consistency in this matter. The result obtained confirms that people, possessing a limited time resource, tend to choose the shortest path even to the detriment of their own security. In this case, most of the time is saved by choosing the shortest path length, and not the path that provides the chosen speed of movement.
Among the properties on which traffic safety of a pedestrian path depends, the pedestrian’s protection from falls is more important, according to experts of both groups, which is more determined by slipperiness than by the evenness of the road surface. The next most important feature in terms of safety is the security of the road from hitting vehicles, and the prevention of hitting cars rather than cyclists is regarded as more desirable. The organization of the path to prevent attacks on pedestrians is the least significant factor (Figure 1b). In the group of properties that affect security from attacks, the most valuable one was the provision of illumination of the path, then its crowdedness, then the exclusion of secluded places. According to the author, the results obtained correspond to the probable length of stay of pedestrians on the roads that are not provided with protection against this or that adverse effect.
Among the factors that determine the comfort of movement along the linear section of the pedestrian path, microclimatic characteristics and attractiveness of the environment where the path is laid, as well as the geometric characteristics of the path itself, are of the greatest importance. The pollution of the path, the equipment with outdoor furniture are about half the importance of comfort of movement than the microclimate and the attractiveness of the environment, and the information richness of the pedestrian path is three times less significant (Figure 1d).
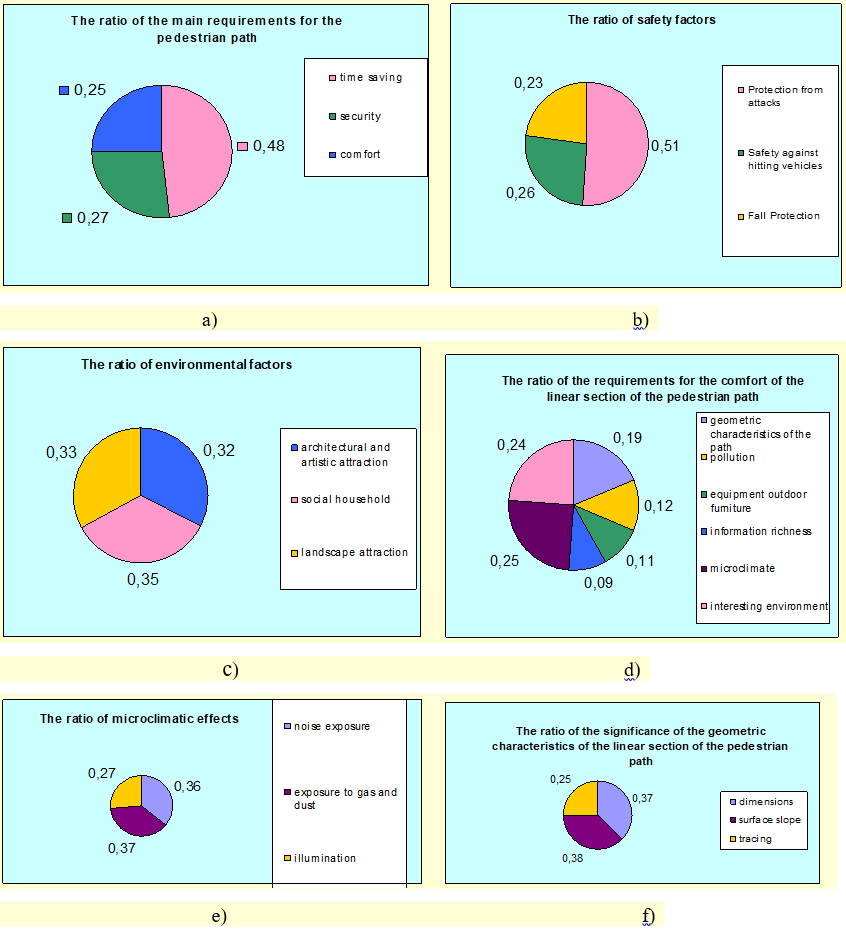
The obtained results confirm that the organization of pedestrian communications, which has the goal of increasing the specific proportion of pedestrian movements within urban areas, should take into account the importance of microclimatic characteristics and interestingness of the environment for pedestrians. The greatest adverse effect on pedestrians among the microclimatic characteristics is noise and gas pollution of the environment (Figure 1e). The experts of the first group are less inclined to take into account the influence of solar radiation. The reason for this may be the age structure of experts.
In the group of geometric characteristics, the greatest influence on the comfort of pedestrian movement is exerted by the slopes of the pedestrian path, the smallest – by the configuration of the route (Figure 1f). That corresponds to reality when comparing the comfort of the ways of movement, which are of equal economy of time and security.
Concerning the pedestrian’s interesting environment, the opinions of the experts of the two groups were divided. The experts of the first group appreciate the architectural, artistic, and landscape interest of the environment, while the experts of the second group put the social and living interest of the environment in the first place. These differences can also be explained by the age characteristics of experts, since young experts are less inclined to focus on the needs of the family in their movements. The final importance of the properties of this group is almost the same (Figure 1c).
The ratios of the weights of the properties of the last tier are shown in the histogram (Figure
Conclusion
The study revealed the high importance of pedestrian paths of the shortest length and indicators which make easy to maintain the selected speed, as well as a significant impact of properties that ensure comfort and safety movement. For example, it is inappropriate to equip a variety of street furniture with economical time-consuming pedestrian paths located near a highway with heavy traffic due to its negative impact. At the same time, it is not economically profitable to organize pedestrian routes for utilitarian purposes - they will be in the least demand and will not encourage accession to the pedestrian movement of the population. Consumer preferences of pedestrians for the choice of traffic conditions should be fully used in the design of the urban environment. Thus, knowledge of the indicators and their significance for the psychological choice of a pedestrian will help optimize management decisions on the organization of harmonious pedestrian paths, thereby contributing to the improvement of the urban environment. ]
References
- Azgaldov, G.G. (1989). Qualimetry in architectural and construction design. Moscow, Stroiizdat.
- Christopoulou, P., Pitsiava, M. (2012). Development of a model for the estimation of pedestrian level of service in Greek urban areas, Social and Behavioral Sciences, 48, 1691–1701.
- Davis, A. Y., Pijanowski, B. C., Robinson, K., Engel, B. (2010). The environmental and economic costs of sprawling parking lots in the United States. Land Use Policy, 27-2, 255-261.
- Devlin, A. (2013). Measuring the Quality of the Pedestrian Environment: Towards an appropriate assessment methodology. Retrieved from: https://therenewedcity.files.wordpress.com/2008/03/ped-los-final-draft.pdf.
- Gallin, N. (2001). Quantifying pedestrian friendliness – guidelines for assessing pedestrian level of service. Australia: Walking the 21st Century, Perth, Western Australia
- Guide Information for Pedestrian Facilities. (2013). Austroads Project No. NT 1523. Retrieved from: www.austroads.com.au.
- Harkey, D.L.; Zegeer, C. (2004). PEDSAFE: Pedestrian Safety Guide and Countermeasure Selection System; Report of Grant no. DTFH61-99-X-00003; University of North Carolina, Highway Safety Research Center: Chapel Hill, NC, USA.
- Highway Capacity Manual, (2016). Sixth Edition: A Guide for Multimodal Mobility Analysis (HCM), Transportation Research Board, National Research Council, Washington D.C. Retrieved from: https://trrjournalonline.trb.org/
- Keyvanfar, A., M. Ferwati, S., Shafaghat, A., Lamit, H. (2018), A Path Walkability Assessment Index Model for Evaluating and Facilitating Retail Walking Using Decision-Tree-Making (DTM) Method. Sustainabiliy, 10, 4, 1035.
- Leptiukhova, O. Y. (2014) On the formation of high-quality pedestrian routes, Socio-economic problems of the development and operation of transport systems of cities and their zones of influence: materials of the anniversary XX international scientific-practical conference. Ekaterinburg.
- Pedestrian Environment Review System, (2009). Transport Research Laboratory. Retrieved from: https://trlsoftware.com/
- SFMTA, (2014). Pilot Project Evaluation Summary. Retrieved from: http://sfpark.org/wp-content/uploads/2014/06/SFpark_Eval_Summary_2014.pdf.
- Raikhman, E.P, Azgaldov, G.G. (1974). Expert methods in the evaluation of the quality of goods. Moscow, Economy.
- Shesterneva, N.N. (2007). Architectural typology and principles of development of existing pedestrian communications of the largest city. Dissertation for the degree of candidate of architecture St. Petersburg
- Shoup, D. (2014). The high cost of minimum parking requirements. Transport and Sustainability, 5, 87-113.
- Sdoukopoulos, L. (2009). Methods for assessing the pedestrian level of service: International experience and adjustment to the Greek walking environment – The case of Thessaloniki. Retrieved from: http://indico.conferences.dtu.dk/getFile.py/access?contribId=86&sessionId=30&resId=2&materialId=paper&confId=72.
- TRB’s National Cooperative Highway Research Program (NCHRP) Synthesis 436: (2016). Local Policies and Practices That Support Safe Pedestrian Environments. Retrieved from: www.TRB.org
Copyright information

This work is licensed under a Creative Commons Attribution-NonCommercial-NoDerivatives 4.0 International License.
About this article
Publication Date
29 March 2019
Article Doi
eBook ISBN
978-1-80296-057-0
Publisher
Future Academy
Volume
58
Print ISBN (optional)
-
Edition Number
1st Edition
Pages
1-2787
Subjects
Sociolinguistics, linguistics, semantics, discourse analysis, science, technology, society
Cite this article as:
Leptiukhova, O. (2019). Socio-Psychological Preferences Of Pedestrian When Choosing Walkable Urban Design. In D. K. Bataev (Ed.), Social and Cultural Transformations in the Context of Modern Globalism, vol 58. European Proceedings of Social and Behavioural Sciences (pp. 2516-2525). Future Academy. https://doi.org/10.15405/epsbs.2019.03.02.290