
Econometric Methods For Assessing Development Of Agriculture In Chechen Republic

Abstract
To deepen quantitative analysis, the article uses econometric methods for assessing the state of the agricultural industry in the Chechen Republic. The purpose of the study is to predict consequences of institutional changes in the agriculture industry of the Chechen Republic. The results made it possible to predict further development of the industry and substantiate possibilities for improving financial efficiency of agricultural production. Econometric analysis is applied to the structure of the agriculture and dynamics of individual factor components. The results of correlation and regression analysis are an effective tool for planning and forecasting activities within the agricultural sector. Severe competition, attempts to form additional price and non-price competitive advantages require expanding opportunities for increasing the economic potential of agricultural production. The model of multiple regression was used as a model for the price volume of agricultural production. The assessment results for regression equation coefficients showed a correct statistically significant dependence on the selected parameters.
Keywords: Chechen Republicagricultureeconometric assessmentforecasting
Introduction
The agricultural sector plays a leading role in the economy of the Chechen Republic. A tenth of the production assets are involved in the agriculture of the region. The share of agriculture in the GRP of the Chechen Republic was 9% (2016). At the beginning of 2017, more than 65% of the population of the Chechen Republic and 51% of the population of the North Caucasus Federal District (NCFD) lived in rural areas. In Russia, this share is less than 26%. (Melnikov, Sidorenko, Snimshchikova, & Mihailushkin, 2016).
As can be seen, restoration and development of the economic and social potential of agriculture is a must for economic growth of the Chechen Republic and other republics of the North Caucasus Federal District. However, in the 1990s, two events influenced the current state and trends in the agrarian sector. These are hasty market reformation of the economy (denationalization and privatization of property) and a military conflict which began in 1991 and affected the neighboring republics. As a result, in most republics of the North Caucasus Federal District, economic indicators of the agricultural industry lag behind the average rates for Russia, the North Caucasus Federal District and neighboring Stavropol Region. The situation has not changed significantly despite government support of the agricultural sector. (Avtorkhanov, 2007).)
Problem Statement
To deepen quantitative analysis, we use econometric methods for assessing the state of agriculture in the Chechen Republic. The results can be used to predict further development of the industry and substantiate possibilities of improving the financial efficiency of agricultural production.
Research Questions
Using the methods of econometric analysis, we analyzed the structure of the agriculture industry in the Chechen Republic with regard to the dynamics of its factor components.
Purpose of the Study
The purpose is to predict consequences of institutional changes in the agriculture industry of the Chechen Republic.
Research Methods
The traditional methods of statistical and economic analysis, comparative, structural, index, graphic, factor, correlation, regression, and other methods of economic statistics were used (Kusakina, 2015).
Findings
The results of correlation and regression analysis are an effective tool for planning and forecasting agricultural activities. Strong competition, attempts to form additional price and non-price competitive advantages require increasing the economic potential of agricultural production. A multiple regression model was used as a model for the price volume of agricultural output:
,
where
For model purity, let us single out the factors affecting the function under consideration. To this end, we will construct a matrix of paired correlation coefficients (Table
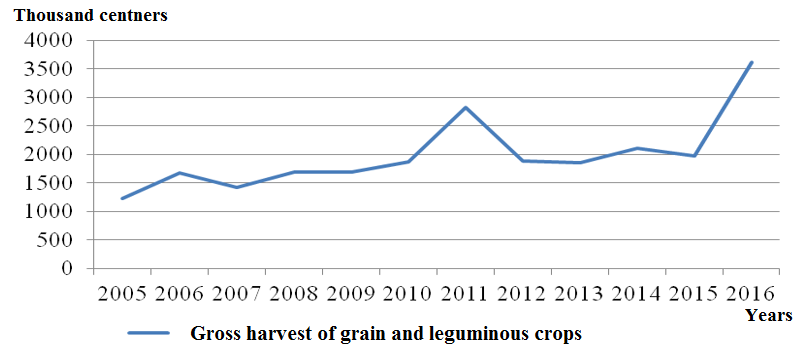
[Gross yield, thousand cent.] = [Size of the crop area, thousand ha] * [Grain yield, cent./ha].
We will also consider livestock of cattle, sheep and goats as one indicator. Table
The following notation is used:
— random component.
(Statistical compilation by the Ministry of Agriculture, 2016; Chechen statistics; 2017)
Figure
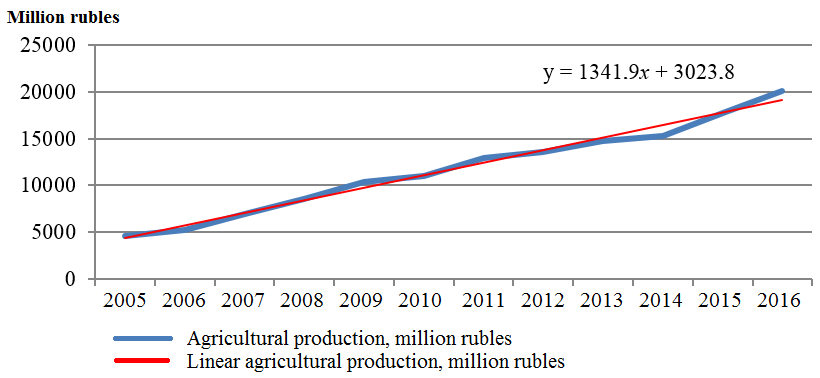
The graph of the dynamic range coincides with the linear trend line under the active growth trend. Since the beginning of 2014, acceleration has been observed. It should be noted that the number of people employed in agriculture has the strongest influence on the dependent value. Let us analyze the impact of this indicator.
Y = 161.7816x1 + 3355.01.
For the resulting equation, the index of determination D = R², fixing the share of the explained variation of the effective feature due to the factors accounted for in the regression, is 0.939. The regression equation is adequate. It is important to take into account unevenness and intermittency of data and characteristics and interrelationship of agricultural indicators.
Let us build the model of paired regression for
Y = 0.4608 x2 + 40826.61.
The coefficient of determination for this equation is 0.99 which speaks for a very high quality of the regression equation. Let us build a paired regression model for
Figure
Based on the econometric analysis, we have a model
The determination coefficient value 0,828 means that an increase in the dependent variable by 82.8% is determined by an increase in the factors included in the model. The following model will be based on factors and conditions related to artificially stimulating growth in various agricultural areas (the use mineral fertilizers and feed consumption). Given the number of observations, the regression function can have no more than three variables.
The results of evaluation of regression equation coefficients show the correct statistically significant dependence on the selected indicators:
The determination coefficient for this equation is 0.91 which speaks for good selection of the regression equation. Let us consider the latest regression model whose free components are the livestock of cattle, sheep and goats and milk yield. The factors are combined on several grounds: first, to determine the prospects for development of regional agriculture; second, these components depend on veterinary and zootechnical control and maintenance measures. (Israilov, 2013).
Figure
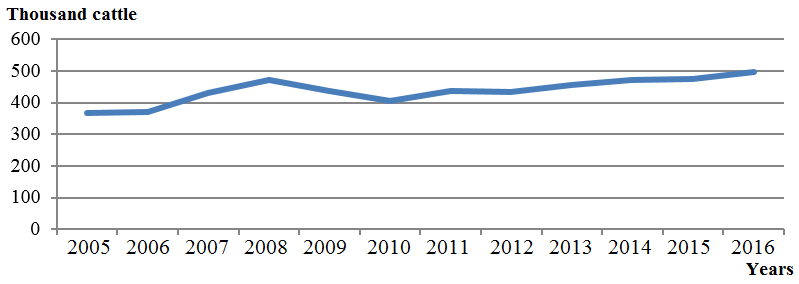
Econometric calculation allowed for the following regression equation:
The determination coefficient is equal to 0.95.
Regression equations are significant, because the probability that the calculated F-statistic value will fall into the area of hypothesis acceptance is below the significance level (α = 0.05). Testing of the significance of all the regression coefficients of the model by the t-criterion shows that they are statistically significant, since probabilities that the
Conclusion
Summing up the econometric study, we can draw the following conclusions:
- indicators characterizing the agricultural sector are influenced by natural, geopolitical, man-made economic and institutional factors which cause their instability;
- main factors affecting progressive development of the agricultural industry of the Chechen Republic and growth of agricultural production were identified;
- the analysis shows that these parameters form a network with elements influencing each other. This makes it possible to characterize the system as extremely susceptible to internal and external changes;
- at the final stage, stabilization of the positive dynamics of the main parameters of the Chechen agriculture was observed. Linear dependence was predominant.
References
- Avtorkhanov, A. I. (2007). Restoration and development of agroindustrial production of the Chechen Republic. Moscow: Kontek LLC.
- Statistical compilation by the Ministry of Agriculture (2017). Agro-industrial complex of Russia in 2016. Moscow: Minagro.
- Basovskiy, L. E. (2004). Forecasting and planning in market conditions. Moscow: Infra 4.
- Chechen statistics (2017). Chechen Republic in figures. Grozny: Chechenstat.
- Chernova, T. V. (2009). Economic-statistical study of factors affecting agricultural productivity. Regional economy: theory and practice, 11, 81-89.
- Israilov, M. V. (2013). Forecast scenarios for development of agriculture in the Chechen Republic. Problems of development of the agro-industrial complex of the region, 3 (15), 17-26.
- Kharitonov, A. E. (2016). Statistical study of ecological-economic systems of agriculture: thesis of a cand. of economy sciences. Novosibirsk: NSU.
- Kusakina, O. N., Dykan, Yu. A. (2015). Methodology for assessing sustainable rural development. Fundamental researches, 5-4, 31-39.
- Melnikov, A. B., Sidorenko, V. V., Snimshchikova, I. V., Mihailushkin, P. V. (2016). Formation of the concept of food security of Russia. Economics of Agriculture of Russia, 12, 107-110.
- Usenko, L. N. (2010). Economic analysis and forecast of socio-economic processes in the agricultural sector. Rostov-on-Don: GNU VNII of the Russian Agricultural Academy.
- .
Copyright information

This work is licensed under a Creative Commons Attribution-NonCommercial-NoDerivatives 4.0 International License.
About this article
Publication Date
29 March 2019
Article Doi
eBook ISBN
978-1-80296-057-0
Publisher
Future Academy
Volume
58
Print ISBN (optional)
-
Edition Number
1st Edition
Pages
1-2787
Subjects
Sociolinguistics, linguistics, semantics, discourse analysis, science, technology, society
Cite this article as:
Israilov, М. V., Chazhaev, М. I., Dovletmurzaeva, М. А., & Gaysumova, L. D. (2019). Econometric Methods For Assessing Development Of Agriculture In Chechen Republic. In D. K. Bataev (Ed.), Social and Cultural Transformations in the Context of Modern Globalism, vol 58. European Proceedings of Social and Behavioural Sciences (pp. 2200-2206). Future Academy. https://doi.org/10.15405/epsbs.2019.03.02.255