
The Swimming Index And Lactic Acid In Higher Aerobic Effort

Abstract
Introduction: Swimming represents a physical activity that involves moving the body through water and is characterised by cyclical arm and leg movements coordinated with breathing. The concept of total training brings a new approach to training factors, with global repercussions on the performance components. The time pressure put on coaches and athletes brings into focus the use of sprint means to improve higher aerobic endurance, thus reducing the training volume (number of hours and kilometres). Knowing the metabolic effort zones encountered in the training of swimmers and the subtle connections between these zones allows improving the effects of training through apparently paradoxical means. Nowadays, field specialists talk about aerobic and anaerobic powers and capacities, about the development of VO2 max through alactacid and lactacid anaerobic efforts. Hypothesis: Using short-term sprint exercises can lead to an increase in aerobic endurance (VO2 max). The research subjects are 15 senior athletes, members of the Tunisian National Swimming Team. Methods: The research is focused on the ascertaining pedagogical experiment with one variable. Maximum oxygen consumption was assessed by applying the T-2000 test correlated with the items: swimming index and post-exercise lactic acid value. Mathematical and statistical methods: arithmetic mean, standard deviation, Pearson correlation coefficient, coefficient of determination (r2), graphical representation. Results: The analysed data highlight a strong correlation between the two parameters (swimming index and lactic acid), r = 0.869, which shows a very strong association. Therefore, the use of short-term sprint exercises can increase aerobic endurance; thus, the research hypothesis is validated.
Keywords: Swimming indexlactic acidT-2000 testhigher aerobic effort
Introduction
Swimming represents a physical activity that involves moving the body through water and is characterised by cyclical arm and leg movements coordinated with breathing. Specialists in the field show that maximum aerobic endurance (MAE) delays exhaustion of the swimmer’s body through means achieved in percentages of VO2 max (maximum oxygen consumption), MAP (maximum aerobic power) or MAS (maximum aerobic speed); all these parameters are influenced by the energy potential, the cardiac cost of the body, but also by the technical efficiency, the volume of swimming over a given distance (Guedj, Brunet, Girardier, & Moyen, 2006). Influencing performance according to the quantification and efficiency of the technique can be achieved by calculating the swimming index, namely by multiplying the swimming speed by distance per stroke (DPS). This index assumes that, at a given speed, the athlete who swims with the highest DPS value has the most efficient swimming technique (Costill, Maglischo, & Richardson, 1994). The concept of total training brings a new reorientation/approach to training factors, with global repercussions on the performance components. The time pressure put on coaches and athletes brings into focus the use of sprint means to improve higher aerobic endurance, thus reducing the training volume (number of hours and kilometres). The new concept of High-Intensity Interval Training (HIIT)/ 10-20-30 Interval Training Model, which highlights the maximum effort intensity reached through short-term ultrafast sprints, has an impact on improving higher aerobic exercise capacity/ MAE, where the swimming index and lactic acid production are parameters that, if correlated, can provide data about the specificity of the research (Kenney, Wilmore, & Costill, 2015). Knowing the metabolic effort zones encountered in the training of swimmers and the subtle connections between these zones allows improving the effects of training through apparently paradoxical means. Nowadays, field specialists talk about aerobic and anaerobic powers and capacities, about the development of VO2 max through alactacid and lactacid anaerobic efforts.
Problem Statement
The stimulation of higher aerobic exercise capacity through sprint-specific anaerobic means generates problems, questions, permissive and restrictive assertions.
The connexion of the vectors: exercise intensity, swimming index and lactic acid generates the future premise and hypothesis of the research.
Research Questions
Are there connections between the lactic acid accumulation and the swimming index calculation? Can the use of short-term sprint exercises determine the increase in higher aerobic endurance?
Purpose of the Study
Identification of the means and methods to invalidate or confirm the responses to the research problems/hypothesis. This is for the first time in the world that a comparison is made between the two parameters.
Research Methods
Hypothesis
Using short-term sprint exercises can lead to an increase in aerobic endurance (VO2 max).
Research subjects
15 high-ranking male athletes, aged between 20 and 21 years, members of the Tunisian National Swimming Team. Testing and training took place in the Olympic pool (50m) in Rades, Tunisia.
Research methods
The research is focused on the ascertaining pedagogical experiment with a single variable. Maximum oxygen consumption was assessed by applying the T-2000 test correlated with the items: swimming index and post-exercise lactic acid value. Initial testing was applied on 12 February 2015, and final testing on 19 August 2015. The T-2000 test was administered at the beginning and the end of the 6-month experimental period; meanwhile, the repeated sprint test, consisting of a maximal sprint test over the distance of 50m, 2 series of 6x50m crawl, with 10-second breaks and departure every 5 minutes, was applied twice a week. Mathematical and statistical methods: arithmetic mean, standard deviation, Pearson correlation coefficient, coefficient of determination (r2) and graphical representation (Popa, 2008).
Description of tests and studied parameters
Tests
- repeated sprint test: the test 2 x (6x50m freestyle) consists in swimming the distance of 50m with a 100% intensity, after a preliminary specific warm-up; the break between repetitions is 10 seconds, and between series, 5 minutes;
- T-2000 test: it is aimed to assess higher aerobic capacity and consists in swimming as fast as possible (80-85% intensity) the distance of 2000m, provided that the intermediate times recorded per 100m are the closest possible to each other. Generally, a preliminary test is needed, so that the athlete gets used to the pace of the race. It should be noted that a difference of more than 4 seconds between the best and poorest 100m swim leads to inaccurate test results. The total time and average time per 100m swim are entered into the T-2000 software to calculate, analyse and assess the collected data. Following mathematical analyses, the program can provide each athlete with the appropriate timeframes needed to successfully perform exercises into the zones: O2S (aerobic endurance), O2R (aerobic-anaerobic threshold), VO2 max (aerobic power) and LT (lactate tolerance). T-2000 is a constant-pace triangular test (Marinescu, Ticală, Rădulescu, Bidiugan, & Petre, 2016). Athletes were split on a swimming line (eight lines) and tested at the same time.
Measured parameters
- swimming index: it was calculated by multiplying the swimming speed (m/s) by distance per stroke (m/cycle). This index assumes that, at a given speed, the athlete who swims with the highest DPS value has the most efficient swimming technique. This parameter was measured in the T-2000 test during the two test phases. During learning, improvement can be mainly achieved by using longer strokes, as a result of better orientation of motor surfaces (the swimmer’s arms and legs that generate a propulsive force), and by increasing the distances covered by motor surfaces. Moreover, the fastest swimmers have better swimming index, and therefore, better technique (Cardelli, Chollet, & Lerda, 1999);
- lactic acid (LA): this is a maximally important indicator for assessing the predominant type of energogenesis during physical exercise and, depending on the concentration reached, for assessing the endurance capacity of the body. The athlete’s body develops lactate resistance during the effort, which is why their training sessions should include interval exercises that produce high increases in lactate concentration. The data were taken at the end of T-2000 test, during the first minute after exercise.
Findings
The results obtained in the initial and final tests are shown and analysed in Tables
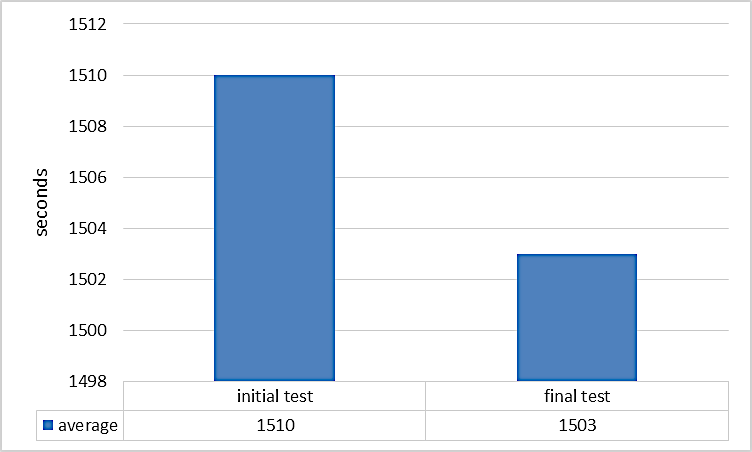
Regarding the time achieved in the T-2000 test, its average is 25:10:00 minutes in the initial testing and 25:03:00 minutes in the final testing, the difference between the two tests being 07:00 seconds in favour of the second testing; the minimum value recorded within the group in the initial test is 22:20:00 minutes, and the maximum value is 26:56:00 minutes, the difference between these values being 04:36:00 minutes; in the final test, the minimum value is 22:15:00 minutes, and the maximum value is 26:46:00 minutes, the difference between these values being 04:31:00 minutes. Standard deviation in the initial test is equal to ± 01:06:97 minutes, and in the final test, it is equal to ± 01:05:89 minutes in favour of the second testing; the coefficient of variation in the initial test is 4.43%, and in the final test, it is 4.38%, which shows a high level of homogeneity of the results obtained in this test. Figure
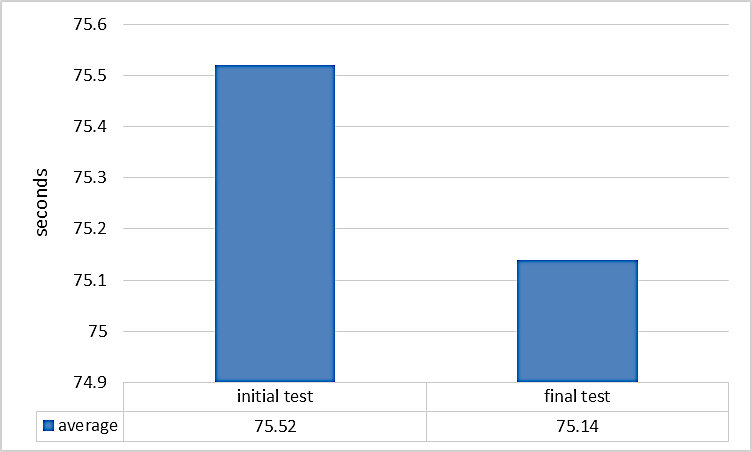
As for the average time per 100m within the T-2000 test, it is 01:15:52 minutes in the initial testing and 01:15:14 minutes in the final testing, the difference between the two tests being 00:38 seconds in favour of the second testing; the minimum value recorded within the group is 01:07:00 minutes in the initial test, and the maximum value is 01:20:80 minutes, the difference between these values being 13:80 seconds; in the final test, the minimum value is 01:06:75 minutes, and the maximum value is 01:20:30 minutes, the difference between these values being 13:55 seconds. Standard deviation in the initial test is equal to ± 03:34 seconds, and in the final test, it is equal to ± 03:29 seconds in favour of the second testing; the coefficient of variation in the initial test is 4.43%, and in the final test, it is 4.38%, which shows a high level of homogeneity of the results obtained in this test. Figure
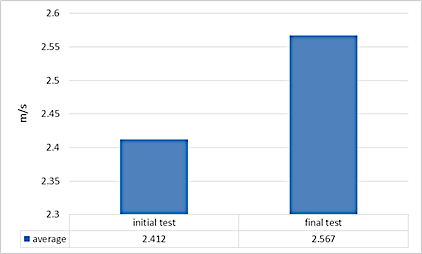
Concerning the swimming index, its average is 2.412m/s in the initial test and 2.567m/s in the final test, the difference between the two tests being 0.155m/s in favour of the second testing; the minimum value recorded within the group in the initial test is 1.89m/s, and the maximum value is 2.9m/s, the difference between these values being 1.01m/s; in the final test, the minimum value is 2.1m/s, and the maximum value is 2.9m/s, the difference between these values being 0.8m/s. Standard deviation in the initial test is equal to ± 0.305m/s, and in the final test, it is equal to ± 0.247m/s in favour of the second testing; the coefficient of variation is 12.66% in the initial test, and in the final test, it is 9.61%, which shows a moderate level of homogeneity of the results obtained for this parameter. Figure
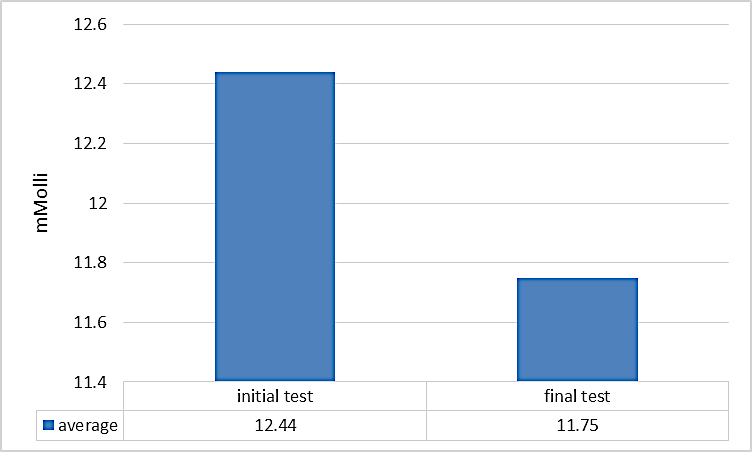
As regards the value of lactic acid accumulated in the blood at the end of the T-2000 test, its average is 12.44 mmol in the initial test and 11.75 mmol in the final test, the difference between the two tests being 0.69 mmol in favour of the second testing; the minimum value recorded within the group in the initial test is 10.24 mmol, and the maximum value is 14.06 mmol, the difference between these values being 3.82 mmol; in the final test, the minimum value is 10.2 mmol, and the maximum value is 12.9 mmol, the difference between these values being 2.7 mmol. Standard deviation in the initial test is equal to ± 1.129 mmol, and in the final test, it is equal to ± 0.736 mmol in favour of the second testing; the coefficient of variation in the initial test is 9.07%, and in the final test, it is 6.26%, which shows a high level of homogeneity of the results obtained for this parameter. Figure
Tables
Conclusion
High performance in world swimming depends on several factors: height of the athletes, the stroke rate and range of motion, coordination of the upper limbs, propulsive forces, accumulated lactic acid and ways of removing it, maximum heart rate etc., and there are many cases where, at a distance of a few hundredth of a second from the first time, an athlete is not on the podium or even in the final of the event.
Regarding our experiment, in the final test, an improvement in the studied parameters is noted for all parameters; average times for the T-2000 test are improved by 7 seconds, and there is only one case where the time achieved in the final test is identical to the time achieved in the initial test: the athlete F.H., with 25:02:00 minutes in both tests.
As for the average time per 100m in the T-2000 test, there is an improvement of 00:38 seconds, which, in our opinion, is significant, because it is about the training of high-performance athletes.
The swimming index has a moderate value in the initial test, 2.412m/s, and in the final test, 2.567m/s, the difference being 0.155m/s in favour of the second testing, which shows that the stroke efficiency has also improved due to the increase in the DPS parameter.
The post-exercise lactic acid parameter shows that the effort provided by athletes during the initial test falls within the metabolic zone of tolerance to lactic acid accumulation (LA > 12 mmol, X = 12.44 mmol), and in the final test, within the VO2 max effort zone (LA < 12 mmol and > 4-6 mmol, X = 11.75 mmol). Thus, the research hypothesis that using short-term sprint exercises can lead to an increase in aerobic endurance (VO2 max) is checked and confirmed.
Regarding the correlation between the two parameters, the swimming index and the value of post-exercise lactic acid, there is a very strong positive association between them: in the initial test, r = 0.869, and the determination coefficient r2 shows that the dispersion of each of the two parameters is influenced by the other parameter in a proportion of 75.5%; in the final test, r = 0.917, and the determination coefficient r2 shows that the dispersion of each of the two parameters is influenced by the other parameter in a proportion of 84%.
Acknowledgments
We thank the athletes involved in this research and the National Sports Research Institute for the support provided.
References
- Cardelli, C., Chollet, D., & Lerda, R. (1999). Analysis of the 100-m front crawl as a function of skill level in non-expert swimmers. Journal of Human Movement Studies, 36(2), 51-74.
- Costill, D. L., Maglischo, B. W., & Richardson, A. B. (1994). La natation. Paris: Vigot.
- Guedj, E. B., Brunet, B., Girardier, J., & Moyen, B. (2006). Médecine du sport (7e éd.). Paris: Masson.
- Kenney, W. L., Wilmore, J. H., & Costill, D. L. (2015). Physiology of sport and exercise (6th ed.). USA: Human Kinetics.
- Marinescu, Gh., Ticală, L. D., Rădulescu, A., Bidiugan, S., & Petre, A. T. (2016). Educational perspectives opened by the use of T-2000 software in the preparation of water polo players. In I. Roceanu (Ed.), Proceedings of the 12th International Scientific Conference “eLearning and Software for Education”, April 21-22, 2016 (Vol. 3, pp. 417-422). Bucharest: Carol I National Defence University. DOI: 10.12753/2066-026X-16-239
- Popa, M. (2008). Statistică pentru psihologie – Teorie și aplicații SPSS (Ed. a II-a). Iași: Polirom.
Copyright information

This work is licensed under a Creative Commons Attribution-NonCommercial-NoDerivatives 4.0 International License.
About this article
Publication Date
16 February 2019
Article Doi
eBook ISBN
978-1-80296-054-9
Publisher
Future Academy
Volume
55
Print ISBN (optional)
-
Edition Number
1st Edition
Pages
1-752
Subjects
Sports, sport science, physical education
Cite this article as:
Jari, S., Marinescu, G., Ticală, L. D., Rădulescu, A., Hoanță, D., & Bidiugan, S. N. (2019). The Swimming Index And Lactic Acid In Higher Aerobic Effort. In V. Grigore, M. Stănescu, M. Stoicescu, & L. Popescu (Eds.), Education and Sports Science in the 21st Century, vol 55. European Proceedings of Social and Behavioural Sciences (pp. 326-333). Future Academy. https://doi.org/10.15405/epsbs.2019.02.41