
Team Selection And Performance: The Role Of Migratory Background And Social Class


Abstract
What are the implications of the increasing socio-demographic heterogeneity among student bodies for performance levels? This paper offers some answers from an experiment among undergraduate students, whose performance – individually and in teams of two – with respect to a short test of the course material was related to a set of indicators about their personal background. In line with earlier research, we find students with migratory backgrounds or, almost equivalently, with foreign language backgrounds, to be at a consistent disadvantage in both the individual and the team exercise. The added focus of this paper, however, is on social class, where we find mixed evidence: While the parents’ educational achievement positively drives their children’s performance in most specification, the question whether a student ever received a (means-tested) student loan never matters. The results may serve as a note of a caution to both higher education institutions and the students themselves to actively promote the integration of students with foreign backgrounds, whereas potential segregation by social class is less of a concern.
Keywords: Social classmigratory backgroundteam selectionteam performance
Introduction
Student bodies, not least at German higher education institutions, are growing increasingly diverse (Middendorff et al., 2017; DSW, 2014; Willich, Buck, Heine, & Sommer, 2011). This development gives cause for serious concern. It may become ever more difficult in large classes to offer teaching styles and contents that will do justice to the needs of most students (Krüger-Basener, Ezcurra Fernandez, & Gößling, 2013; Wielepp, 2013), as it may be assumed that certain of the students’ socio-demographic characteristics correlate with their performance in class, so that increasing heterogeneity with respect to these characteristics entails diverging performance levels. We focus in particular on two socio-demographic dimensions: migratory background and ‘class’ background.
Problem Statement
This research project is motived by a number of aspects. The ongoing European refugee crisis has added considerable interest regarding migratory background, with earlier research showing that migratory status can have a significant impact on student performance (Schmucker & Häseler, 2017). The present study aims to validate those prior results. Concerning social status, we are motivated by the debate on class affiliation and ((un)equal) opportunities for social advancement. It was found early on that, certainly in Germany, working-class children are at a decisive disadvantage when it comes to educational achievement, a fact that is reflected in their low admission rates for higher education (Dahrendorf, 1965). This discrepancy, which has received extensive research coverage, still persists today: Admission rates to higher education are 21% versus 74% for children from non-academic and academic families, respectively (Hochschul-Bildungs-Report, 2017; Krempkow, 2017). Despite these controversial results, prior research has mostly investigated the transition between secondary and higher education, while the effects of social inequality on performance
A second concern that springs from increasing heterogeneity is the question as to how well students with minority backgrounds are integrated in class, or more generally, whether there is a tendency for students with specific backgrounds to ‘keep to themselves’, i.e. to engage in voluntary segregation and, if so, whether there is any association between segregation and team performance. To investigate this concern, we test whether students choosing a team partner for a class exercise prefer fellow students who are similar in a number of respects.
Finally, the study presents a welcome opportunity to validate earlier results regarding the influence of the members’ socio-demographic characteristics on the performance of a team. In particular, we are interested to see whether heterogeneity within the team is detrimental to team performance – another potential concern regarding increasingly diverse student bodies.
Research Questions
The research questions are summarised in the following three hypotheses, each of which is later tested by means of regression analysis:
Next,
Once the teams – in our case, teams of two – have formed,
Purpose of the Study
This paper describes the experimental set-up and results of an empirical study among undergraduate students with the aim to validate earlier results on a set of research questions pertaining to individual performance, team performance and team formation. A special focus is placed on the extent to which these output variables are affected by the students’ socio-demographic backgrounds, in particular their migratory background and their social class as proxied by their student loan status and their parents’ educational attainment. The results of the experiment may serve to guide students, lecturers, and other rule-setting institutions in the higher education context in order to improve the learning environment.
Research Methods
The experiment was conducted in November 2017 among undergraduate students at the University of Hamburg. An announcement was made in the class “Introduction to Human Resource Management” that in preparation for the next lecture, students were asked to pair up in teams of two for an exercise intended to consolidate their knowledge of the material taught so far and to provide the data basis for a social science experiment with some relevance to the course curriculum. On the day of the actual experiment, those students who indeed arrived as teams (‘voluntary teams’) we asked to choose a seat on one side of the lecture theatre, whereas those who arrived individually were arbitrarily grouped in teams of two and asked to sit on the other side. Several ‘voluntary teams’ were asked to relocate to the ‘involuntary’ side of the room so as to achieve a balance of team types. The teams composed of individual arrivals were then asked to exchange one member each with the neighbouring team on the ‘involuntary’ side of the room, so that the resulting team composition on this side was approximately random (‘random teams’). Finally, each team was given a pair of clicker devices to communicate their answers to the upcoming questions. For each team, we noted the pair of serial numbers, which the clickers transmit with each activation, so we were later able to match the responses of the team members. Usable data were obtained for 92 students forming 46 teams, exactly half of which were of the ‘voluntary’ and of the ‘random’ type, respectively.
The experiment proper began with a set of ten questions relating to the material taught previously in the course, and the students were to choose one of five answer choices for each question individually, without consulting with their team partner. The number of correct responses yields our measure of individual performance. Next, each student was asked to submit answers to eight questions regarding their socio-economic background. Then each team surrendered one of their two clickers, using only the remaining one for the rest of the experiment. The teams were then asked to indicate whether they were of the ‘voluntary’ or of the ‘random’ type, and how familiar the two members were with each other. Finally, the teams were presented with the same ten questions about the course contents, though this time they were to submit a team decision only after consulting with each other (peer instruction). We thus obtained our indicator of team performance. Figure
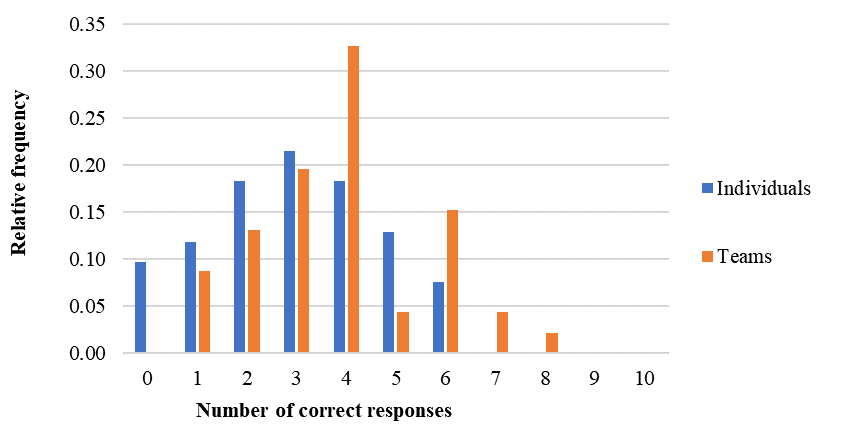
We see that the teams performed somewhat better than the individuals (averages of 3.84 versus 2.99 correct responses). This advantage will be due to a combination of two factors: team work and learning effects (even individuals would have done better in the second round, simply because of the extra opportunity and additional time to reflect upon the answers). Which effect dominates is impossible to tell with the present experimental design. There is, however, some evidence of discussions (team work) actually taking place within the teams: In 5 of the 46 cases, the team score was indeed below the lower of the two individual scores, so there must have been some debate, though not for the better. (In 18 cases, the team score exceeded the higher of the individual scores – the outcome one would hope for.)
Next, for each of the eight socio-demographic questions and the two questions about the nature and familiarity of the team, Table
Table
Beyond that, the table primarily serves as a plausibility check of the data, with many of the observed relationships among the variables corresponding to prior expectations. For example:
A student is more likely to receive a loan if his or her parents have below-average educational attainment and have a foreign language or migratory background – both of which are proxies for low family income.
A student’s parents tend to have similar levels of educational achievement.
A student is more likely to engage in voluntary work the higher their father’s educational attainment, in line with prior findings for example by Kausmann, Simonson, and Hameister, (2017).
Language background and migratory background are highly correlated (almost per definition).
In each of the next four sections, we present the most salient findings pertaining to individual performance, team selection and team performance, respectively, and relate them to the applicable hypotheses and to our expectations as derived from prior theoretical and empirical research.
Findings
Determinants of Individual Performance
We now turn to the question as to whether and how the students’ socio-demographic characteristics determine their individual performance in the first round of questions. In each of the regression models reported in Table
For the dataset underlying Model 1.2, the missing socio-demographic values were imputed: A series of models was built to predict the missing data points for individual students and variables using whatever information was available from the other students (imputation by regression). Being quite similar to Model 1.1, the regression results confirm the viability of the imputation: The imputation has reduced all standard errors, the coefficient estimates are quite similar, and the signs are identical with one exception. Thanks to the more precise estimates, we have additional significant performance effects for the mother’s educational attainment (positive) and age (negative). Models 1.3 and 1.4 are again based on the original and the imputed sample, respectively, but have been reduced to include only those indicators that yield significant coefficient estimates. We find the previous effects of voluntary work and non-German native language confirmed, plus the effect of the mother’s education in the case of the imputed dataset.
In absolute terms, the effects are generally not negligible. For example, students who engage in voluntary work fared better in the test by more than a quarter of a point – roughly 10% of the average score. The finding of voluntary work as a driver of individual performance is interesting as it complements our earlier research (Schmucker & Häseler, 2016, 2017). Regarding the underlying causal factor we may only speculate, given the wide range of potential reasons to engage in voluntary work (Clary & Snyder, 1999; Clary et al. 1998; Hustinx & Lammertyn, 2003; Willems & Dury, 2017). Clary et al. (1998) for example show that careers concerns play a strong role in that decision – voluntary work is accepted because it looks good in a CV. This might suggest that the correlation between performance and voluntary work is in fact spurious, as both are driven by an unobserved third factor: the participants’ degree of ambition in terms of future employment.
Team Selection
Do students tend to choose team partners who are similar to them, or in other words, is the degree of socio-demographic diversity lower in ‘voluntary’ teams? The answers, to the extent that they can be extracted from our sample, are contained in Table
Determinants of Team Performance
In a final set of analyses, we examine team performance, i.e. the number of correct responses that the teams submitted to the second set of content questions, and its relationship with the information we have on the teams. The best prediction of team performance on the basis of a single indicator, judging by the coefficient of determination (R2), is achieved by the sum of the team members’ individual scores (Model 2.1). This finding may not be too surprising considering that the teams faced the very same questions as their individual members in the first round. Perhaps more interestingly, we find that the sum of the individual scores for each question is a better predictor of team performance than the maximum of the two figures (results not reported in the table
In Model 2.2, we leave aside the prior individual performance to instead see how well team performance can be explained by the team’s type (random versus voluntary) and the member’s degree of familiarity, as well as the sums of all the individual socio-demographic characteristics. So for example the variable MALE in this context can assume the values 0 (an all-female team), 1 (mixed team) and 2 (all-male). We find that only the degree to which the team members have a non-German only language background has a (weakly and negatively) significant impact on team performance. Thus, though the model’s overall explanatory power is quite similar to that of the corresponding model for individual performance, it yields fewer significant coefficient estimates. Reducing the specification down to those indicators that are associated with a significant effect leaves only NLO (Model 2.3).
In Models 2.4 and 2.5, instead of the sums of the individual traits, we use the differences: In the case of a dummy variable, say LOAN, the indicator will take the value of 1 if one team member has enjoyed a student loan while the other one has not, and 0 if they share the same loan status. For ordinal variables (e.g. AGE), the respective indicator equals the difference between the team members’ individual values. In a nutshell: These two models try to capture any effect of
Throughout all specifications, neither a team’s type nor its degree of familiarity exhibits a significant effect. However, the consistently negative sign would suggest that students are best advised to stay clear of their closest friends when selecting a team partner.
Discussion of the Results
Pertaining to hypothesis 1, we found a negative significant impact on individual performance for students whose native language background is non-German, confirming the results of Schmucker & Häseler (2016). The straightforward explanation for this would be that such students simply had a harder time following the course material taught in German and therefore answering the test questions, especially given the time pressure. A more in-depth analysis (e.g. using the results of a language test as an additional explanatory variable) could reveal whether a non-German native language background indeed translates into language barriers to answering the test questions or whether, instead, such a background is merely indicative of other (e.g. cultural) factors that impede performance. However, such an assessment is not possible with the data at hand.
Individual performance is also significantly driven by the students’ voluntary work and higher educational attainment of a student’s mother (a proxy for social class). It seems likely that these two factors actually exert a joint influence on performance. A number of studies have shown a positive association between parental education levels and the children’s voluntary work (cf. e.g. Kausmann, Simonson, & Hameister, 2017), and this relationship is also borne out by our data – the two variables are positively correlated, though not significantly so. Parents with higher education degrees tend to impress upon their children the importance not only of education but also of social commitment (Bekkers 2007). Thus, social class as proxied by parental education drives individual performance both directly and indirectly, via voluntary work. The fact that it is the mothers’ rather than the fathers’ educational achievement that has the greater influence on their children’s performance is in accordance with prior research: Halle, Kurtz-Costes, & Mahoney, (1997), analyzing a sample of low-income minority families, discovered that mothers with higher education had higher expectations for their children’s academic achievements and that these expectations were linked to the subsequent academic achievement of their children. The authors found that these more positive expectations and beliefs predicted higher degrees of achievement-fostering behaviour by mothers in the home, together with more positive perceptions of academic achievements by the children. In addition, Corwyn and Bradley (2002) identified that mothers’ educational attainment had the most consistent direct impact on cognitive and behavioral outcomes of children. The finding also accords with common sense: In most families and cultures, the mothers take the lead role in raising their children and thus have more opportunity to pass on their values and act as a role model.
While our first indicator of social class, parental education, thus shows an impact on student performance, the second one does not: Family income, as proxied here by (means-tested) student loan status, fails to produce a significant effect on individual performance in any of the estimates. This is not surprising in light of the findings by Davis-Kean (2005) and Halle et al. (1997), who find that low family income need not constrain academic development. As we saw in Table
Regarding hypothesis 2, a significant tendency for students to select similar team partners was found only with respect to native language and migratory status. For the former variable, this tendency is quite pronounced: There was only one team in which one member had a German-only native language background while the other one did not. Not surprisingly, the degree of familiarity is far higher in voluntary teams. Our finding of language-based team formation relates to Goins and Mannix (1999), who present evidence of team selection based on ethnicity. This is a cause of concern as, in an increasingly ethnically diverse environment, it may lead to segregation. On the other hand, particularly gender and age do not appear to be relevant criteria in the choice of partners. To a certain extent, this result contradicts theory, especially the ‘laws of attraction’ (Byrne, 1971).
Hypothesis 3 concerns team performance, which we find depends neither on the individual members’ socio-demographic characteristics (though it strongly depends on their individual performance), nor on heterogeneity within the team, nor on a team’s type (voluntary versus random). So team performance is not driven by intra-team diversity. Particularly, diversity with respect to gender and age is unrelated to performance, as also found by Schneid et al. (2014) and Horwitz & Horwitz (2007). In addition, team performance does not depend on the degree of familiarity among the team members. However, the consistently negative sign should encourage students not to go for the convenient choice when selecting a team partner. Concretely, students should resist the temptation to select team partners they are well familiar with.
Conclusion
Student bodies at most higher education institutions are growing increasingly diverse in terms of personal backgrounds. Does this imply that classes also become more difficult to teach because the students’ performance levels are growing more diverse? That would be the case only if a systematic relationship existed between the students’ personal characteristics and their academic performance. While a large body of literature exists regarding the association (if any) between personal attributes and performance, most of it relates to the working environment, with relatively little attention devoted so far to the academic sphere.
The present study expands upon the authors’ previous experimental work with undergraduate students at the University of Hamburg, though this time with a focus on social status and with a number of methodological improvements. 92 students enrolled in the class “Introduction to Human Resource Management” were asked to pair up in teams of two, in exactly half of which the choice of partner was voluntary while the other half were assembled in a quasi-random fashion. Personal data about the students was collected by means of ‘clicker’ devices. To capture the social class dimension, we asked whether the students received a federal student loan, which is only granted to students from low-income families, and what the highest educational achievement of their mother and father was. For a measure of academic performance, the students were given a set of ten multiple-choice questions on the course, which were to be answered individually in a first round and then again in collaboration with the team partner (peer instruction) in a second round.
While we generally found little evidence of
In future research, we would like to go into more detail regarding the students’ backgrounds. While additional indicators of social class could be implemented, it would also be worth investigating what really drives the negative performance impact of foreign language backgrounds. Is it really language skills as such that matter or are some other factors at play, such as perhaps systematic variations in social capital? To exclude the influence of language itself, a short grammar or vocabulary test could for example be incorporated in the experiment.
Acknowledgments
The authors wish to thank the Equal Opportunity Fund of the University of Hamburg and the eLearning Office of the university’s Faculty of Business, Economics and Social Sciences for support. Moreover, we would like to thank Dr. Jerg Gutmann and Dr. Jurgen Willems for valuable input.
References
- Bandura, A. (1997). Self-efficacy: The exercise of control. New York: W. H. Freemann.
- Bargel, H., & Bargel, T. (2010): Ungleichheiten und Benachteiligungen im Hochschulstudium aufgrund der sozialen Herkunft der Studierenden, Arbeitspapier, Demokratische und Soziale Hochschule, No. 202.
- Bekkers, R. (2007). Intergenerational transmission of volunteering. Acta Sociologica, 50(2), 99-114.
- Bell, S. T., Villado, A. J., Lukasik, M. A., Belau, L., & Briggs, A. L. (2011). Getting Specific about Demographic Diversity Variables and Team Performance Relationships: A Meta-Analysis. Journal of Management 37(3), 709-743.
- Buchmann, M., & Kriesi, I. (2013). Welche Rolle spielt das Geschlecht für den Schuleintritt und die Schulleistungen im mittleren Primarschulalter? Siebholz, S., Schneider, E., Schippling, A, Busse, S., & Sandring, S. (Hrsg.): Prozesse sozialer Ungleichheit. Bildung im Diskurs. Wiesbaden: Springer, 29-41.
- Byrne, D. E. (1971). The attraction paradigm. New York: Academic Press.
- Chapman, K. J., Meuter, M., Toy, D., & Wright, L. (2006). Can’t we pick our own groups? The influence of group selection method on group dynamics and outcomes. Journal of Management Education 30(4), 557-569.
- Clary, E. G., & Snyder, M. (1999). The motivations to volunteer: Theoretical and practical considerations. Current Directions in Psychological Science, 8(5), 156-159.
- Clary, G. E., Snyder, M., Ridge, R. D., Copeland, J., Stukas, A. A., & Haugen, J. (1998). Understanding and assessing the motivations of volunteers: A functional approach. Journal of Personality and Social Psychology, 74(6), 1516-1530.
- Corwyn, R. F., & Bradley, R. F. (2002). Family process mediators of the relation between SES and child outcomes. Unpublished manuscript, University of Arkansas at Little Rock.
- Cox, T. H., & Blake, S. (1991). Managing cultural diversity: Implications for organizational competitiveness. Academy of Management Executive, 5(3), 45-56.
- Dahrendorf, R. (1965). Arbeiterkinder an deutschen Universitäten, Tübingen.
- Davis-Kean, P. E. (2005). The influence of parent education and family income on child achievement: The indirect role of parental expectations and the home environment. Journal of Family Psychology, 19(2), 294-304.
- DSW (2014). Studying today in Germany: 20th social survey of Deutsches Studentenwerk on the social dimension of higher education. Berlin: Heinrich Druck + Medien.
- Eccles, J. S., & Wigfield, A. (2002). Motivational beliefs, values, and goals. Annual Review of Psychology, 53(1), 109-132.
- Erdel, B. (2010). Welche Determinanten beeinflussen den Studienerfolg? Eine empirische Analyse zum Studienerfolg der ersten Kohorte der Bachelorstudenten in der Assessmentphase am FB Wirtschaftswissenschaften der Friedrich-Alexander-Universität Erlangen-Nürnberg. Berichte des Lehrstuhls für Soziologie und Empirische Sozialforschung. Bericht 2010-2.
- Goins, S., & Mannix, E. A. (1999). Self-selection and Its Impact on Team Diversity and Performance. Performance Improvement Quarterly, 12, 127-147.
- Halle, T., Kurtz-Costes, B., & Mahoney, J. (1997). Family influences on school achievement in low-income, African American children. Journal of Educational Psychology, 89(3), 527-537.
- Hambrick, D. C., Cho Th. S., & Chen, M. (1996). The influence of top management team heterogeneity on firms’ competitive moves. Administrative Science Quarterly, 41(4), 659-684.
- Hochschul-Bildungs-Report (2017). Höhere Chancen durch höhere Bildung? Jahresbericht 2017/18 – Halbjahresbilanz 2010 bis 2015. Stifterverband für die Deutsche Wissenschaft e.V.
- Horwitz, S. K., & Horwitz, I. B. (2007). The Effects of Team Diversity on Team Outcomes: A Meta-Analytic Review of Team Demography. Journal of Management, 33(6), 987-1015.
- Hustinx, L., & Lammertyn, F. (2003). Collective and reflexive styles of volunteering: A sociological modernization perspective. Voluntas: International Journal of Voluntary and Nonprofit Organizations, 14(2), 167-187.
- Jirjahn, U. (2007). Welche Faktoren beeinflussen den Erfolg im wirtschaftswissenschaftlichen Studium? Schmalenbachs Zeitschrift für betriebswirtschaftliche Forschung, 59(3), 286-313.
- Kausmann, C., Simonson, J., & Hameister, N. (2017). Freiwilliges Engagement junger Menschen. Sonderauswertung des Vierten Deutschen Freiwilligensurveys. Bundesministerium für Familie, Senioren, Frauen und Jugend.
- Krempkow, R. (2017). Können wir die Besten für die Wissenschaft gewinnen? Zur Rekrutierung von Nachwuchsforschenden in Wissenschaft und Wirtschaft. Personal- und Organisationsentwicklung in Einrichtungen der Lehre und Forschung (P-OE), 2/2017, 59-64.
- Krüger-Basener, M., Ezcurra Fernandez, L., & Gößling, I. (2013). Heterogenität als Herausforderung für Lehrende der angewandten Technikwissenschaft im Teilprojekt Nord. Bülow-Schramm, M. (ed.): Erfolgreich studieren unter Bologna-Bedingungen? Ein empirisches Interventionsprojekt zu hochschuldidaktischer Gestaltung. Bielefeld: Bertelsmann, 162-190.
- McLeod, P. L., & Lobel, S. A. (1992). The Effects of Ethnic Diversity on Idea Generation in Small Groups. Academy of Management Proceedings, August 1992, 227-231.
- Middendorff, E., Apolinarski, B., Becker, K., Bornkessel, P., Brandt, T., Heißenberg, S., & Poskowsky, J. (2017). The Economic and Social Situation of Students in Germany 2016. Summary of the 21st Social Survey of Deutsche Studentenwerk, conducted by the German Centre for Higher Education Research and Science Studies. Federal Ministry of Education and Research (BMBF), Berlin.
- Miller, C. C., Burke, L. M., & Glick, W. H. (1998). Cognitive diversity among upper-echelon executives: Implications for strategic decision processes. Strategic Management Journal, 19(1), 39-58.
- Mucha, A., & Decker, C. (2017). Der Dissertationsprozess als explorative Lernumgebung: Warum erfolgreiches Promovieren (auch) eine Frage der sozialen Herkunft ist. ZDfm. Zeitschrift für Diversitätsforschung und -management, 2(2), 29-34.
- Rastetter, D. (2006). Managing Diversity in Teams. Erkenntnisse aus der Gruppenforschung. Krell, G., & Wächter, H. (eds.): Diversity Management. Impulse aus der Personalforschung. Mering: Hampp Verlag, 81-108.
- Rienties, B., Alcott, P., & Jindal-Snape, D. (2014). To Let Students Self-Select or Not - That Is the Question for Teachers of Culturally Diverse Groups. Journal of Studies in International Education, 18(1), 64-83.
- Schmucker, S., & Häseler, S. (2017). Formation, Diversity, and Performance of Student Teams of Two: Some Experimental Evidence. ZDfm. Zeitschrift für Diversitätsforschung und -management, 2(2), 92-105.
- Schmucker, S., & Häseler, S. (2016). Measuring the impact of student diversity on performance with classroom response systems. The Online Journal of Distance Education and e-Learning, 4(4), 15-22.
- Schneid, M., Isidor, R., Steinmetz, H., Kabst, R., & Weber, H. (2014). Der Einfluss der Teamdiversität auf die Teamleistung. Eine Metaanalyse. DBW, 74(3), 183-206.
- Tajfel, H., & Turner, J. C. (1986). The social identity theory of intergroup behavior. Austin, W. G., & Worchel, S. (eds.), Psychology of intergroup relations, Chicago: Nelson-Hall, 7-24.
- Tziner, A. (1985). How team composition affects task performance: Some theoretical insights. Psychological Reports, 57(3), 1111-1119.
- Wegge, J., Roth, C., Neubach, B., Schmidt, K.-H., & Kanfer, R. (2008). Age and gender diversity as determinants of performance and health in a public organization: The role of task complexity and group size. Journal of Applied Psychology, 93(6), 1301-1313.
- Wielepp, F. (2013). Heterogenität. Herausforderung der Hochschulbildung im demografischen Wandel. Peer Pasternack (ed.), Jenseits der Metropolen, Leipzig: Akademische Verlagsanstalt, 363-387.
- Willems, J., & Dury, S. (2017). Reasons for not volunteering: Overcoming boundaries to attract volunteers. The Service Industries Journal, 37(11-12), 726-745.
- Willich, J., Buck, D., Heine, C., & Sommer, D. (2011). Studienanfänger im Wintersemester 2009/10. Wege zum Studium, Studien- und Hochschulwahl, Situation bei Studienbeginn. HIS: Forum Hochschule 6/2011. www.dzhw.eu/pdf/pub_fh/fh-201106.pdf [accessed December 28, 2017].
Copyright information

This work is licensed under a Creative Commons Attribution-NonCommercial-NoDerivatives 4.0 International License.
About this article
Publication Date
14 January 2019
Article Doi
eBook ISBN
978-1-80296-052-5
Publisher
Future Academy
Volume
53
Print ISBN (optional)
-
Edition Number
1st Edition
Pages
1-812
Subjects
Education, educational psychology, counselling psychology
Cite this article as:
Schmucker, S., Häseler, S., & Sprengel, J. (2019). Team Selection And Performance: The Role Of Migratory Background And Social Class. In Z. Bekirogullari, M. Y. Minas, & R. X. Thambusamy (Eds.), ICEEPSY 2018: Education and Educational Psychology, vol 53. European Proceedings of Social and Behavioural Sciences (pp. 255-270). Future Academy. https://doi.org/10.15405/epsbs.2019.01.25