
European Union’s International Trade Policy And Strategy

Abstract
European Union (EU) is experiencing turbulent times in terms of international trade that requires to re-evaluate the strategy for the future. EU is still facing challenges in trade with Russian Federation due to trade embargo, President of the United States of America Donald J. Trump has announced necessity to revaluate trade agreements and BREXIT (UK leaving the EU) will cause some extra worries about the outcomes of the negotiations and the effect in the trade relations and influence on economic growth. The EU’s response so far has been smart and measured, despite the difficulty of the situation with all the trade partners involved. It also will be difficult for the EU to maintain a balanced and secure course between the US’s and China’s trade wars. This paper is assessing the importance of the issues of international trade and impact on the EU economy with potential revaluation of the international trade strategy.
Keywords: International tradeexportimportstrategyEU
Introduction
In order to be the most competitive region in the world (see Lisbon strategy), European Union (EU) always has tried to negotiate for better international trade deals that was a great stimulus for developing relationships with a wide range of trading partners. EU is deeply integrated into world markets and even with current turbulence in world trade, this policy may be expected to continue, as development of technologies provide a further opportunity for businesses to exchange goods and services around the world.
EU is facing new challenges in the form of the protectionism of the markets from the trade partners which has been very loyal to the free trade idea so far. There has been a very long debate about short-run and long-run effects from the protectionism on the local economies and world trade, but still history proves that this policy is implemented from time to time. Protectionist trade measures will trigger tariff escalation and that will pose a threat to the improving economic situation in EU due to the broad negative effects these policies can have on world trade and growth.
“Trade has never been more important for the European Union’s economy. In today’s difficult economic circumstances, it has become an important means of achieving much needed growth and creating jobs without drawing on public finances. It is the conveyor belt that links Europe to the new global growth centres and is a unique source of productivity gains. The EU, which is benefitting much more from
globalisation than is sometimes portrayed, is well positioned to benefit from this intensified international trade.” (European Commission, 2013, p. 1).
The EU-28, China and the United States have been the three largest global players for international trade (see Figure
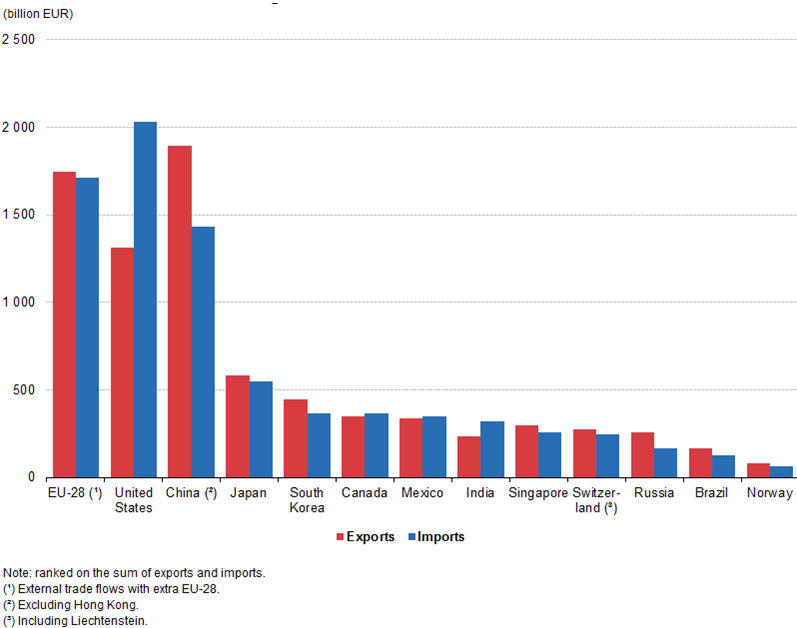
In 2016, the total amount of trade in goods (exports and imports) registered for the EU-28, China and the United States was almost equivalent, reaching 3457 billion EUR in the EU-28 (without intra-EU trade), which was 112 billion EUR higher than for China and 127 billion EUR above the level registered for the United States; Japan had the fourth highest level of trade in goods, at 1131 billion EUR.
In 2016, the cover ratio of exports to imports was especially high in favour of exports for China, Russia and Brazil, while in absolute terms China and Russia have had the largest annual trade surpluses since 2006; in 2016, the United States had the largest deficit, continuing a pattern that has been apparent over the whole of the last decade for which data are available.
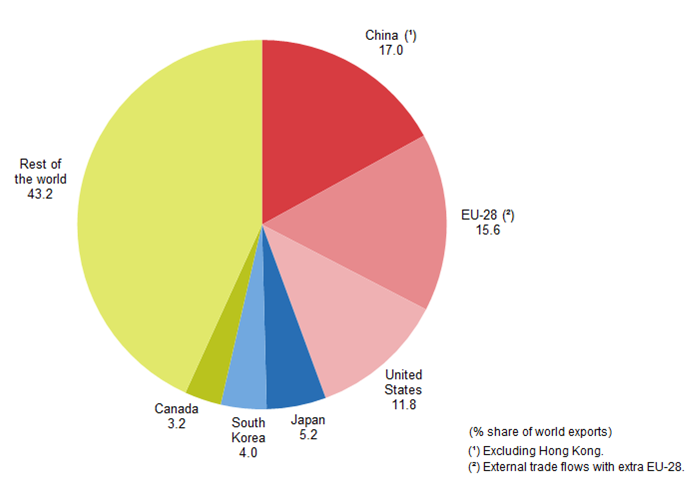
Looking at the flows of exports and imports, the EU-28 had the second largest share of global exports and imports of goods (see Figures
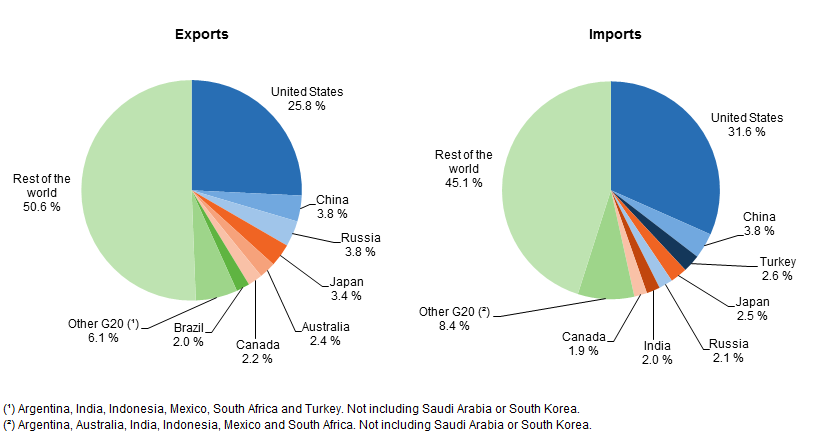
The EU-28 ran a trade surplus for goods equal to EUR 11.1 billion in 2014. Table 1 shows the flows and balance of trade in goods for the EU-28 with the other G20 members. The EU-28 ran by far its largest trade surplus in goods with the United States in 2014 (EUR 102.3 billion) followed by Australia (EUR 20.4 billion) and Turkey (EUR 20.3 billion). At the other end of the scale, it recorded its largest trade deficit in goods with China (EUR 137.5 billion), followed by Russia (EUR 79.2 billion).
Between 2004 and 2014, the EU-28’s trade balance for goods with Argentina, Brazil, Saudi Arabia and South Korea developed from a deficit into a surplus, whereas this situation was reversed with India. During the same period, the EU-28’s trade deficit for goods with Russia and China increased substantially, while the deficits with Japan and Indonesia contracted. The EU-28’s trade surplus for goods with Australia, South Africa, Turkey, Australia, the United States and Mexico increased between 2004 and 2014, while that with Canada contracted.
The EU-28 was the world’s largest exporter and importer of services in 2014, with a trade surplus of EUR 162.9 billion. The EU-28 had trade surpluses in services in 2014 with all the G20 members listed in Table 2, except Turkey (note that no data are available for Saudi Arabia and South Korea). A relatively high share of the EU-28’s trade in services was with the United States, which produced a surplus of EUR 6.6 billion in 2014. The EU-28’s largest surplus for trade in services, however, was recorded with Russia: EUR 16.5 billion. Between 2010 and 2014 the EU’s trade surpluses increased with all G20 members (except Brazil) while trade deficits were either resorbed (United States, India) or reduced (Turkey).
Figure
Findings
European Union is facing export reorientation because of many new challenges, opportunities and interruptions in the international trade (Priede & Pereira, 2015b).
There are number of new markets opening for the international trade giving EU entrepreneurs much needed opportunities for growth, like CETA (EU-Canada Comprehensive Economic and Trade Agreement). CETA is a new trade agreement between the EU and Canada. On 21 September 2017 CETA entered into force provisionally. As such most of the agreement now applies. By boosting trade between us, CETA will create jobs and growth – and new opportunities for your business. Canada is a large market for Europe's exports and a country rich in natural resources that Europe needs. CETA is a progressive trade agreement. It has some of the strongest commitments ever included in a trade deal to promote labour rights, environmental protection and sustainable development. CETA integrates the EU's and Canada's commitments to apply international rules on workers' rights, environmental protection and climate action. And these obligations are binding (Impacts of the CETA agreement on developing countries, 2017; “The benefits of CETA,” 2016; Webb, 2017).
Another agreement that was supposed to be major game changer for EU, was TTIP. The Transatlantic Trade and Investment Partnership (TTIP) is a proposed trade agreement between the European Union and the United States, with the aim of promoting trade and multilateral economic growth. The European Commission says that the TTIP would boost the EU's economy by €120 billion, the US economy by €90 billion and the rest of the world by €100 billion (Akman, 2014; Cernat & Sousa, 2014; Dobrea, Podgoreanu, & Borisov, 2015; Dullien, Garcia, & Janning, 2015; European Commission, 2016; Felbermayr, Heid, & Lehwald, 2013; Pelkmans et al., 2015; Villaverde & Maza, 2016; World Trade Institute, 2016). Although, there are different views about benefits from the TTIP, looks like this agreement is facing new political challenges between EU and the USA.
There are still important challenges regarding Russia trade embargo and challenges many EU countries are facing (Figure
On 7 August 2014, the Russian Federation introduced import restrictions on a range of EU agricultural products notably meats, dairy products and fruit & vegetables (European Union, 2014; Priede & Pereira, 2015a; U.S. Department of State, 2014; Venkuviene & Masteikiene, 2015). The ban runs until 31 December 2018. The ban has clearly had an impact on EU agri-food exports to Russia, which dropped from around €11.8 billion in 2013 to around €5.6 billion in 2016, although exports showed a slight (0.8%) recovery in 2016 compared to the year before. In contrast, overall EU exports of agri-food products have continuously increased over the same period, reaching a record €131.1 billion in 2016, 1.6% higher than in 2015 and 29% higher than in 2011. Only cheese, fruit, poultry meat and milk powder, products under embargo, had lower export values than in 2013, however, cheese and poultry meat exports increased in volume.
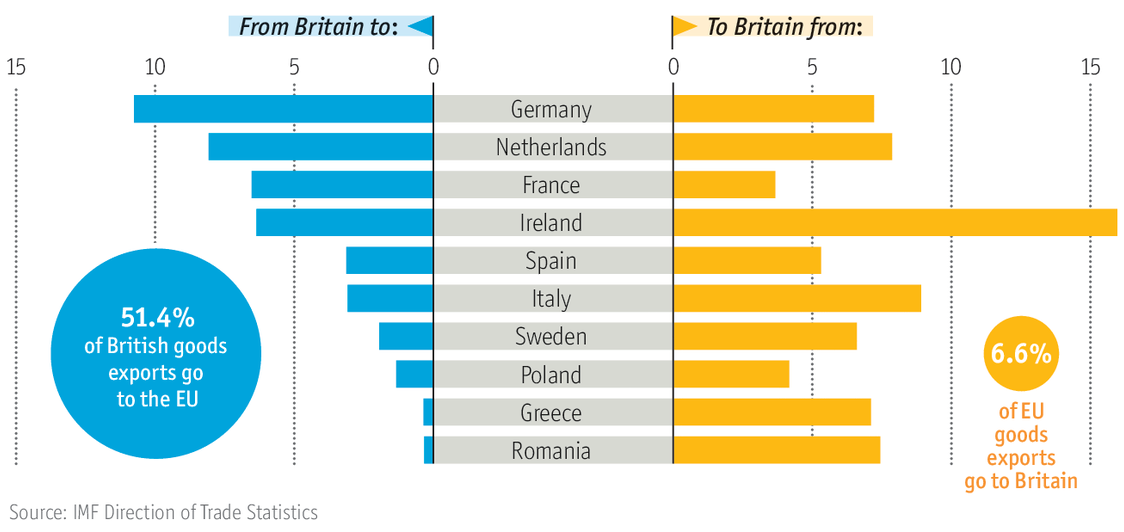
As another challenge to the EU international trade and ambitions in the very near future will be the case of BREXIT (prospective withdrawal of the United Kingdom from the European Union). In a referendum on 23 June 2016, 51.9% of the participating UK electorate voted to leave the EU, out of a turnout of 72.2%. On 29 March 2017, the UK government invoked Article 50 of the Treaty on the European Union. The UK is thus due to leave the EU at midnight on 30 March 2019.
In 2015, the European Union accounted for 43.7 percent (223 billion British pounds) of UK goods and services exports, and 53.1 percent (291 billion British pounds) of UK imports, therefore making it the UK’s largest and most important trade partner (Figure
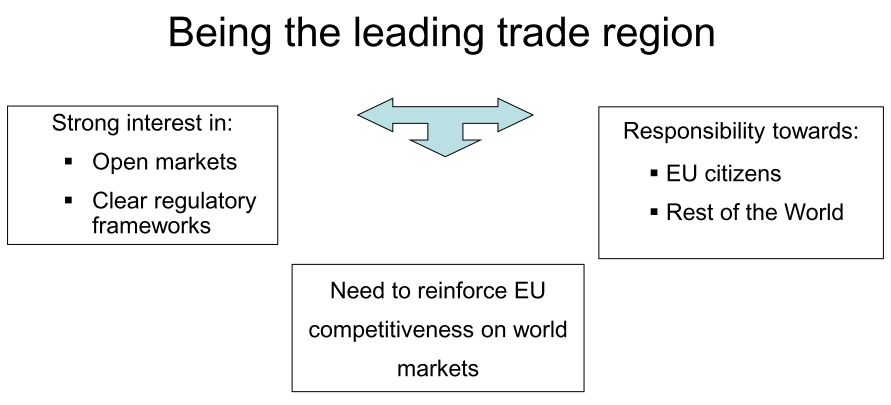
EU is facing many challenges and the important question remains about the strategy for the future. Since many jobs (around 30 million) in EU depends on the export and it is crucial to search for new export markets. EU has a clear vision about it’s place and role on the international stage (Figure
Conclusion and Discussions
There are many debates about how the future policy and strategy of the EU should look like (Overseas Development Institute, 2012). There are many critics to the currents policies and warnings about the turbulent future.
Europe 2020 is a key statement of the EU’s strategy for responding to the on- going economic and financial crisis. It sets out five clear targets for the EU and proposes seven flagship initiatives to address them. Trade policy, as set out in “A Trade Strategy for EU 2020”, is seen as a significant tool to support the achievement of these targets and help the transformation of the EU into a smart, sustainable (Centre for Strategy and Evaluation Services, 2010).
The aim of future trade strategy would be to ensure EU external competitiveness in the face of rapid change in the post crisis global economy. The new EU trade strategy would anchor EU trade strategy for the next five years. During the crisis EU trade flows contracted significantly. Trade is seen as contributing significantly to a strong recovery and growth, and the other objectives of EU 2020.
Objectives of trade policy would include:
Multilateral and bilateral trade negotiations and better enforcement of existing agreements.
Trade opening initiatives: for example for sectors of the future – e.g. green products and technologies, high tech products and services and international standardisation in growth areas.
Proposals for high-level strategic dialogue with key partners.
A regulatory framework within the EU that takes account of what other major economies do to minimise the cost of trading between different regulatory regimes – develop international standards accordingly.
In view of the emphasis of Europe 2020 on smart and sustainable growth, high tech initiatives and green technologies – develop trade policies to contribute by facilitating trade in these sectors so as to create larger markets, reduce costs, and stimulate more innovation.
Action in the field of promoting EU values such as the rule of law and sustainability.
Also there should be greater focus on ensuring that partners have implemented what has been negotiated and working harder on IPR enforcement, obtaining more leverage in government procurement (reciprocally), and disciplining the use of State aids in third countries.
In parallel with this there is the development of an industrial policy and internal market policy, all of which should be logically consistent.
Some initiatives cut across several policy areas, appropriate links with other departments.
References
- Akman, M. S. (2014). Could TTIP become an all-inclusive project? Some remarks concerning alternative responses. Geneva Reports on the World Economy, (April 2015), 51–57. Retrieved from http://www.scopus.com/inward/record.url?eid=2-s2.0-84946155763&partnerID=tZOtx3y1
- Centre for Strategy and Evaluation Services. (2010). A Trade Strategy for Europe 2020. https://doi.org/10.2863/6260
- Cernat, L., & Sousa, N. (2014). TTIP: A transat lantic bridge for worldwide gains. CESifo Forum, 15(2), 32–36. Retrieved from http://www.scopus.com/inward/record.url?eid=2-s2.0-84899803510&partnerID=tZOtx3y1
- Dobrea, R. C., Podgoreanu, I. X., & Borisov, D. L. (2015). The Impact of Transatlantic Trade and Investment Partnership on the European Eco – Innovation. Procedia Economics and Finance, 27(15), 659–668. https://doi.org/10.1016/S2212-5671(15)01046-1
- Dullien, S., Garcia, A., & Janning, J. (2015). A fresh start for TTIP.
- European Commission. (2013). Trade, growth and jobs. Contribution from the Commission to the February 2013 European Council Debate on Trade, Growth and Jobs, 1–20. Retrieved from http://trade.ec.europa.eu/doclib/docs/2013/april/tradoc_151052.pdf
- European Commission. (2016). About TTIP.
- European Union. (2014). EU sanctions against Russia over Ukraine crisis. Retrieved from http://europa.eu/newsroom/highlights/special-coverage/eu_sanctions/index_en.htm
- Felbermayr, G., Heid, B., & Lehwald, S. (2013). Transatlantic Trade and Investment Partnership (TTIP). Who benefits from a free trade deal? Global Economics Dynamics.
- Impacts of the CETA agreement on developing countries. (2017).
- Overseas Development Institute. (2012). The next decade of EU trade policy: Confronting global challenges?
- Pelkmans, J., Lee, T. M., Mustilli, F., Cernat, L., Norman-López, A., Tucci, A., … Matthes, J. (2015). TTIP: Political and Economic Rationale and Implications. Intereconomics, 50(6), 312–343. https://doi.org/10.1007/s10272-015-0557-8
- Priede, J., & Pereira, E. T. (2015a). European Union’s Competitiveness and Export Performance in Context of EU – Russia Political and Economic Sanctions. Procedia - Social and Behavioral Sciences, 207, 680–689. https://doi.org/10.1016/j.sbspro.2015.10.138
- Priede, J., & Pereira, E. T. (2015b). European Union ’ s C ompetitiveness and Export Performance in Context of EU – Russia Political and Economic Sanctions. Procedia - Social and Behavioral Sciences, 207, 680–689. https://doi.org/10.1016/j.sbspro.2015.10.138
- The benefits of CETA. (2016).
- U.S. Department of State. (2014). Ukraine and Russia Sanctions. Retrieved from http://www.state.gov/e/eb/tfs/spi/ukrainerussia/
- Venkuviene, V., & Masteikiene, R. (2015). The Impact of Russian Federation Economic Embargo on the Central and Eastern European Countries Business Environments. Procedia Economics and Finance, 26(15), 1095–1101. https://doi.org/10.1016/S2212-5671(15)00935-1
- Villaverde, J., & Maza, A. (2016). The effects of TTIP on EU countries: an ex-ante evaluation. Revista de Economia Mundial, 42, 25.
- Webb, D. (2017). CETA : the EU-Canada free trade agreement.
- World Trade Institute. (2016). TTIP and the EU member states. https://doi.org/10.1017/CBO9781107415324.004
Copyright information

This work is licensed under a Creative Commons Attribution-NonCommercial-NoDerivatives 4.0 International License.
About this article
Publication Date
28 January 2019
Article Doi
eBook ISBN
978-1-80296-053-2
Publisher
Future Academy
Volume
54
Print ISBN (optional)
-
Edition Number
1st Edition
Pages
1-884
Subjects
Business, Innovation, Strategic management, Leadership, Technology, Sustainability
Cite this article as:
Priede, J. (2019). European Union’s International Trade Policy And Strategy. In M. Özşahin, & T. Hıdırlar (Eds.), New Challenges in Leadership and Technology Management, vol 54. European Proceedings of Social and Behavioural Sciences (pp. 560-567). Future Academy. https://doi.org/10.15405/epsbs.2019.01.02.47