
Forecasting Imports And Exports Of Turkey Using Artificial Intelligence Methods

Abstract
The relationship between economic growth, industrial development and energy consumption has been important for a long time and it comes even more important with the Industry 4.0 Revolution. Electricity consumption is an important input in terms of economic growth and the biggest role in this growth is industrialization. It is also seen that a large share belongs to the industrial sector when examining the consumption of electricity according to the sectors in Turkey. For this reason, energy problems that may occur in the future should be well planned and predicted. In this study, forecasting imports and exports of Turkey using the industrial electricity consumption with artificial intelligence methods is proposed. Artificial Neural Network, Adaptive Neuro-Fuzzy Inference System and polynomial curve fitting methods are tried to find the best expressing model by using various parameters. The results show that the models are well-fitted to the data. Developed models are also used for future forecasting and compared the Turkey’s 2023 vision.
Keywords: Artificial intelligencecurve fittingforecastingindustrial electricity
Introduction
The relationship between economic growth, industrial development and energy consumption has been important for a long time and it comes even more important with the Industry 4.0 Revolution. The economic analysis of the changes occurring in the energy, production, distribution and consumption processes of the energy sector are great importance for the countries. The development of countries depends on the efficient use of energy resources. However, the world is unbalanced distributed energy resources in the region, the countries with poor energy sources such as Turkey increases its energy dependence. To meet this demand, Turkey in terms of limited opportunities in terms of supply and demand are faced with planning requirements. For this reason, it should be questioned whether energy consumption is carried out in the framework of efficiency and productivity principles and whether it is carried out to help economic growth. Energy problems that may occur in the future should be well planned and predicted.
Electricity consumption is an important input in terms of economic growth and the biggest role in this growth is industrialization. It is seen that a large share belongs to the industrial sector when examining the consumption of electricity according to the sectors. In developing economies, the relationship between growth and imports & exports affects the sensitivities of economies' economics policies. The countries that acquire the source that they need during the growth process by importing, are encouraging all kinds of foreign exchange income increasing economic activities in order to close their external deficits. Natural gas and petroleum imports are among the most important items that increase the imports of developing economies. Also, it is provided by gas stations next to the warming of the majority of the electricity production in Turkey increases gas imports, depending on the production.
Turkey’s 2023 vision in the context of economy seeks $ 500 billion export figure. While achieving this goal, the economy management provides all kinds of support for electricity generation with wind and solar panels to increase exports without increasing imports. Because the main purpose of increasing exports is to close foreign trade and current account deficit.
In this study, forecasting imports and exports of Turkey using the industrial electricity consumption with artificial intelligence methods is proposed. Artificial intelligence methods are commonly used in analysing data and creating prediction models. Artificial Neural Network (ANN), Adaptive Neuro-Fuzzy Inference System (ANFIS) and polynomial curve fitting can be used as artificial intelligence methods. The developed model can also predict imports and exports of Turkey in the years of 2017-2023. Also, estimated values are compared to the Turkey’s 2023 vision.
Literature Review and Theoretical Framework
Relations between economic growth and energy consumption have been studied for a long time. It has been seen that the relations between economic growth and energy consumption and their directions have been proposed. When studies in the literature are examined, following works can be seen related to main topic.
Sari, Ewing & Soytas (2008), studied the relationship between disaggregate energy consumption and industrial output in the United States. Autoregressive distributed lag (ARDL) approach is used for showing the relationships with using monthly data in United Sates over the period of 2001–2005. Adams & Shachmurove (2008), build an econometric model for Chinese energy economy. Chinese energy consumption and imports to 2020 have been forecasted using this model based on the energy balance. For Turkmenistan, the relationship between consume of natural gas, energy consumption and gross domestic product (GDP) per capita in the years between 1985-2014 has been studied (Dineri & Bazarova, 2015). The relationship between electricity consumption and economic growth in 1970-2015 for G7 countries studied using a panel regression model. The results show that electricity consumption, capital formation and labor force have significant and positive effect on economic growth (Tunalı & Ulubaş, 2017).
There are also some studies related to electricity and economic growth in Turkey. The relationship between energy consumption and economic growth for Turkey is analyzed using cointegration and Granger causality tests with the aid of data from 1960-2006 period. The results show that the first series of stationary groups move together in the long term (Mucuk & Uysal, 2009). The relationship between economic growth and electricity consumption for Turkey is also studied by Karagöl, Erbaykal & Ertuğrul (2011). They used economic growth and electricity consumption variables over the period 1974-2004 for bound test approach. There was a positive correlation between the variables in the short term and a negative relationship in the long term in relation to the cointegration between the variables (Karagöl, Erbaykal & Ertuğrul, 2011). Electricity consumption and economic growth in Turkey are explored using exports and investment that are control parameters. The results show that these variables have a positive effect on electricity consumption (Altıntaş & Koçbulut, 2014). The effects of energy consumption on economic growth over the period 1980-2012 in Turkey are investigated. The relationship between electricity consumption per person and GDP is estimated by Markov Switching Vector Autoregressive Models (MS-VAR) (Bayraç & Doğan, 2015). The relationship between total energy consumption and economic growth based on the years of 1981-2013 in Turkey is estimated using a multivariate production model. When the relationship in the long term shows total energy consumption, gross fixed capital formation and employment are significant and positive, in the short term shows total energy consumption, gross fixed capital formation and economic growth are significant and positive relationship between each other (Tatlı, 2015). Kar & Kınık (2015) focus on industrial electricity consumption and residential electricity consumption. The relationship between these electricity consumption and economic growth is investigated using the time series analyses in Turkey for the years of 1975-2005. The relationship between electricity consumption and economic growth in Turkey is searched for the years of 1975-2013. The results show that the relationship is a long term between variables, and 1% increase in electricity consumption in Turkey, was felt by 0.6% in economic growth (Eren, Polat & Aydın, 2016). The panel regression analysis is used for investigating the effects of the regional energy consumption on the economic growth in Turkey. Analysis uses the features of gross value added, public investments, employment and electricity of consumption for the years of 2004-2011. The results show that economic growth effects regional energy consumption positively (Usta, 2016). The relationship between sectoral energy consumption and economic growth in Turkey is investigated using Toda-Yamamoto Causality test. The data chosen in 1970-2012 period, and the results show that there is a bidirectional causal relationship between energy consumption and economic growth in the transportation and industry sectors (Usta & Berber, 2017).
Forecasting approaches are also studied related the subject. ANN is used for forecasting the amount of power required at a rate closer to the power consumption. The data to train ANN collected by Big Data analytics in the past 20 years. The results show that the model can predict power generation close to 99% of the actual usage (Rahman & Esmailpour, 2015). Forecasting GDP growth rate is studied using ANN. The GDP is used as economic growth indicator (Sokolov-Mladenović, Milovančević, Mladenović & Alizamir, 2016). Estimation of electric energy demand in Turkey using ANN with teaching–learning-based optimization is studied. ANN model uses GDP, population, import, and export as features to predict Turkey’s electric energy demand in the years of 2013-2018 (Kankal & Uzlu, 2017).
When the studies are examined, it is seen that the number of studies on the basis of electricity consumption in industry is few. Nevertheless, it is thought that this study will fill this gap because it is thought that the industry is directly related to the development of the countries. So that in this study, we focus on industrial electricity consumption, and effects on imports and exports of Turkey. In other words, it has been shown that the industry is related to imports and exports, which are directly related to electricity consumed in the industry.
Research Method
Sample and Data Collection
In this study, a total of 47 data including electricity consumption in the industrial field of 1970-2016 published by the Turkish Statistical Institute (TUIK) are used to train and test artificial intelligence methods (TUIK, 2018a). This data differs according to the values published by Turkish Electricity Transmission Corporation (TEIAS). TEIAS's report states that electricity demand is gross demand and that losses in transmission and distribution lines and internal needs of power plants are included in these values. Besides, it is stated that the production of facilities which do not receive instructions from the Load Dispatch Center but are connected to the distribution system is also added to these values (TEIAS, 2018). Therefore, it is thought that the difference is caused by these reasons. TUIK data is scaled according to TEIAS report because of the large number of samples needed to better train the methods and achieve more stable estimations.
When the total electricity consumption values announced for 2000-2016 are examined, a difference is found in approximately the same rate. The average difference is 24.5% and the standard deviation value is 2.99. The average difference value obtained due to the low standard deviation value is used to scale the unknown industrial consumption values of 1970-1999. TEIAS's electricity consumption forecasting has been used together with this scale for estimating of future years.
Target values that are the exports and import of Turkey’s between the years 1970 and 2016, are collected using TUIK dataset (TUIK, 2018b).
Analyses
In this study, forecasting the exports and imports of Turkey is performed using ANN, ANFIS and polynomial curve fitting. Industrial electricity consumption is chosen as a feature for methods.
ANN is a system that mimics the behavior of neurons in the human brain and simulates their connections to each other. ANN has a layered structure and uses these components to process information. These layers are the input, output, and hidden layers between them, which form the main structure of the ANN. Neighboring layers are completely interconnected by weights (Tabrizi & Sancar, 2017). ANN structure can be seen in Figure
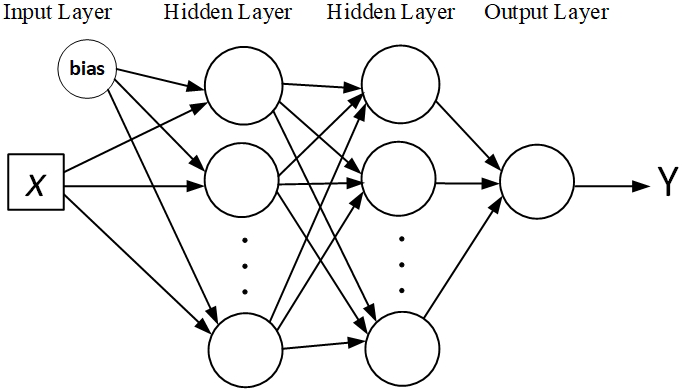
Three main layers are used in ANN structure as input layer, hidden layers and output layer. Input layer has one neuron represents the industrial electricity consumption. In this work, hidden layers chosen as two that have different size neurons. Finally, output layer has only one neuron that provides curve fitting process. Y represents the imports or exports of Turkey in Figure
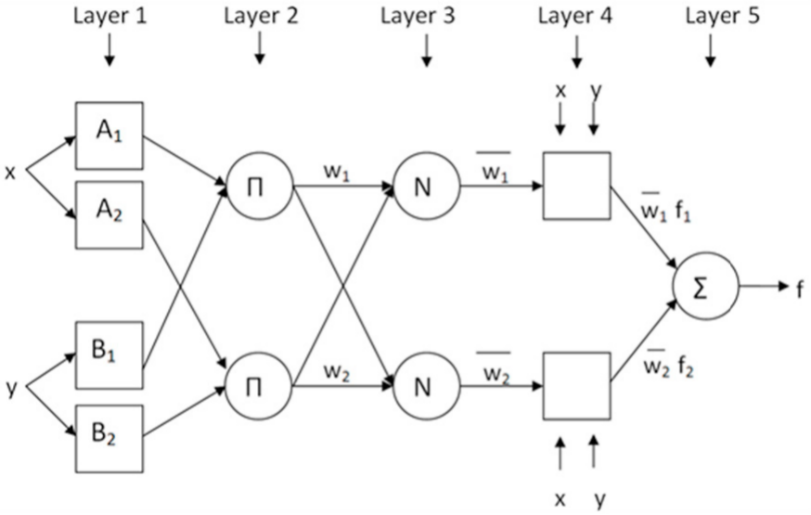
ANFIS is an adaptable and trained multi-layer network that integrates the features of Sugeno type fuzzy inference systems into the best-known ANN species. ANFIS has advantages over other traditional systems in terms of accuracy and good learning. ANFIS consists of input and output sections connected by a set of IF-THEN rules (Sen, Mandal & Mondal, 2017). ANFIS structure can be seen in Figure
Polynomial curve fitting is a mathematical method that finds the best curve which represents the data points. This process can be done using least square method that minimize the sum of the squares of the offsets of the points from the data points (Weisstein, 2018). In Eq. (
In Eq. (
Data points represented by X, and Y indicates the target values of data points in Eq. (
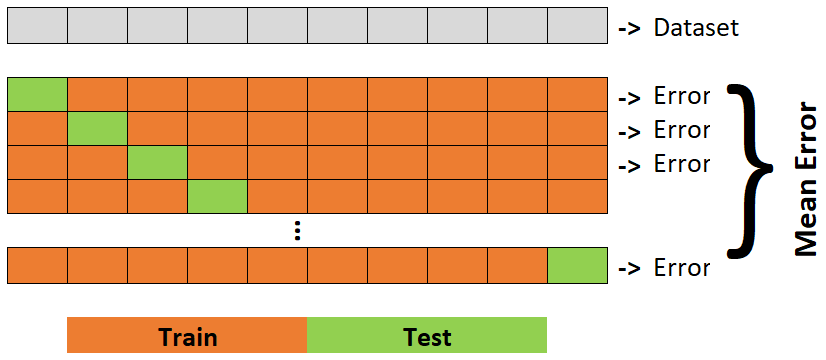
For testing the TUIK dataset, leave-one-out cross-validation is used as seen in Figure
Root mean square error (RMSE) is used for error calculation in learning process of the ANN, ANFIS and polynomial curve fitting. RMSE value can calculate as in Eq. (
In Eq. (
Findings
In this study, Turkey’s exports and imports are forecasting using ANN, ANFIS and polynomial curve fitting. Only industrial electricity consumption is used as an independent variable for the methods. TUIK’s 47 data over the years of 1970-2016 are used as an input data. While establishing the best models with proper parameters, the estimation process is run 5 times, and the mean of values, minimum values (Min), maximum values (Max) and standard deviations (std.) of methods are given in Table
In Table
According to Table
The best parameters that has the minimum RMSE value for forecasting the Turkey’s imports can be found in Table
Original export values and estimated values using the best models in Table
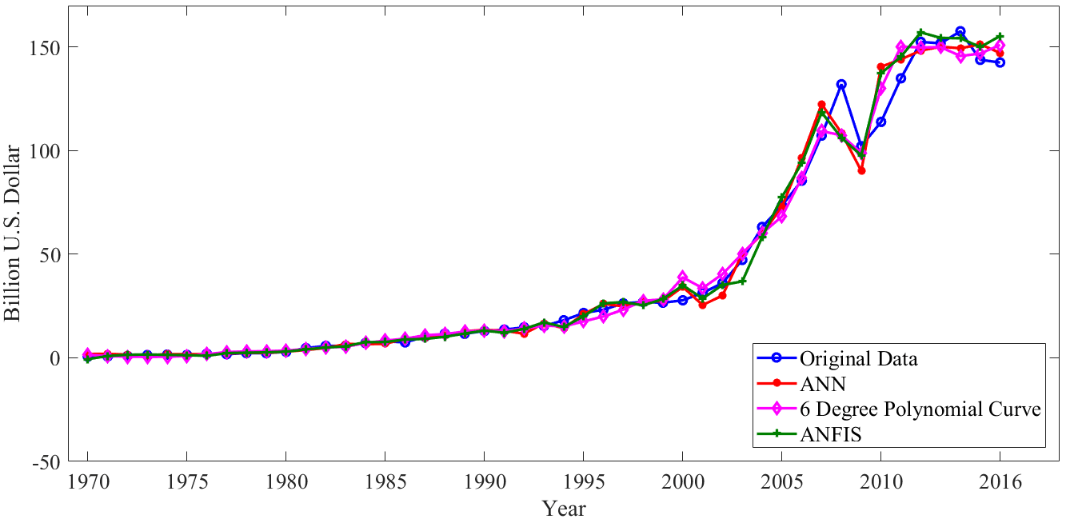
In Figure
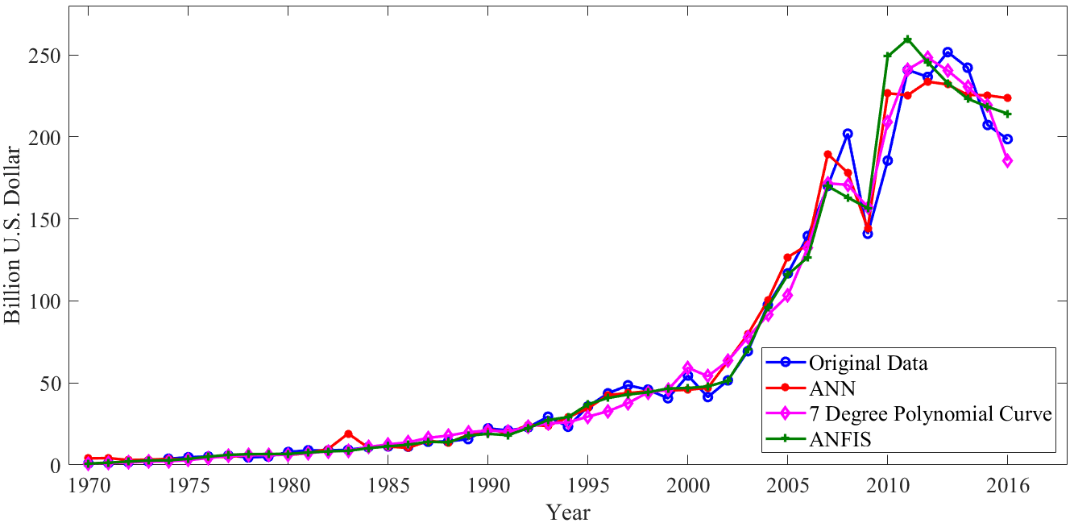
In Figure
In Figure
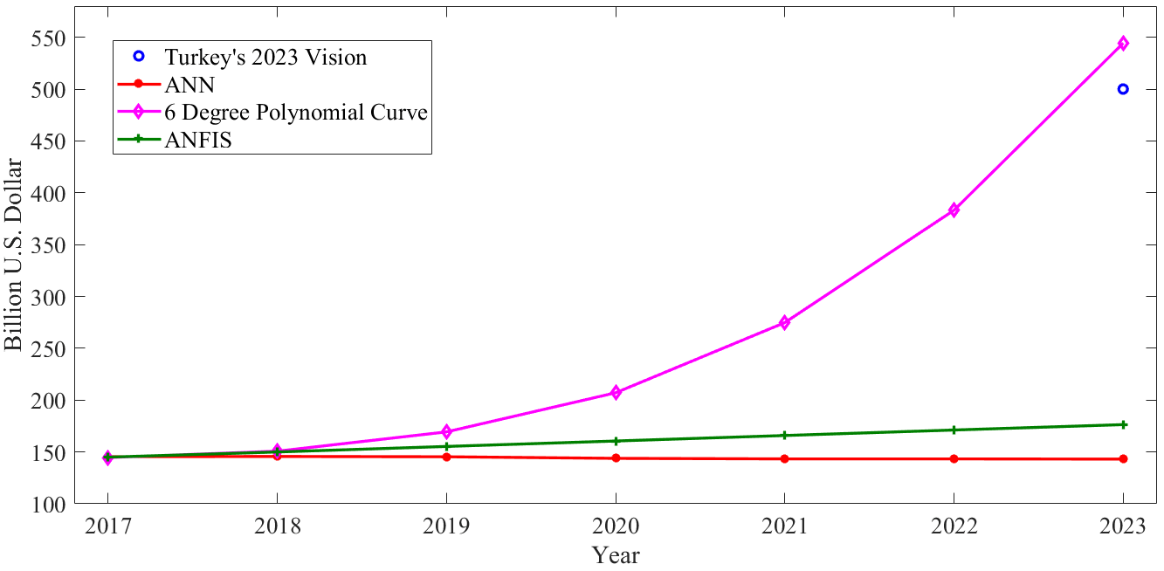
The forecasting results of exports between the years 2017 and 2023 are given in Table
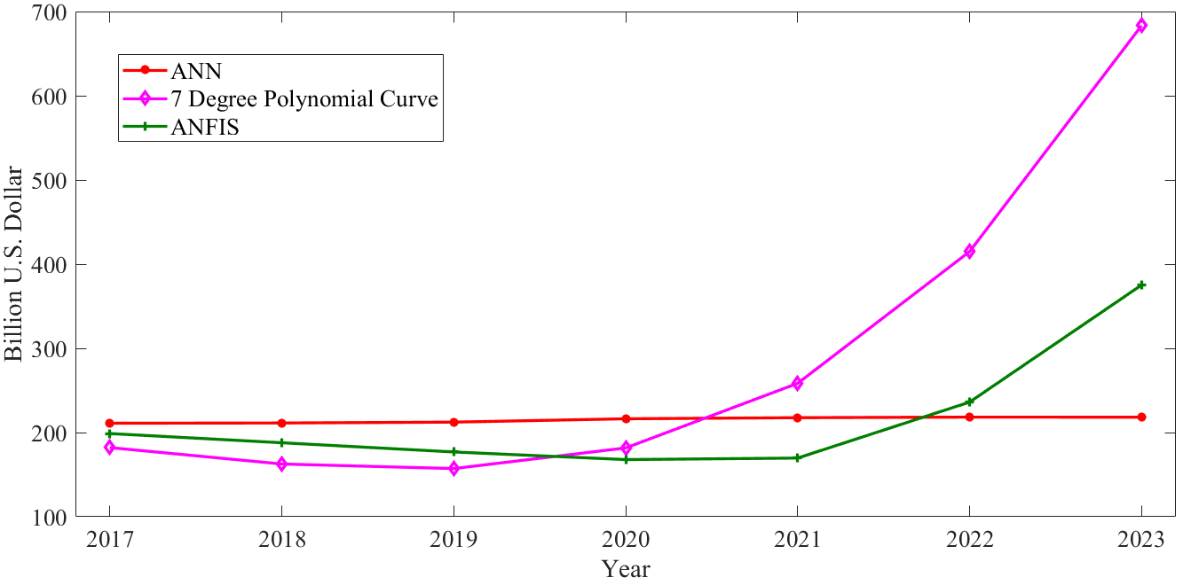
The forecasting results of imports between the years 2017 and 2023 are given in Table
Conclusion and Discussions
In this study, it was tried to estimate the exports and imports of the coming years with the help of electricity consumption used in the industry for 2023 vision. It is considered that electricity consumption is the most important independent variable in forecasting future exports and imports in terms of imports of natural gas and economic growth.
By looking at industrial electricity consumption, it has been tried to estimate the export and import figures between 1970 and 2016. With the help of industrial electricity consumption estimates of TEIAS for 2017-2023 years, export and import figures were tried to be estimated by using the methods of Artificial Neural Network, Adaptive Neuro-Fuzzy Inference System and polynomial curve fitting until 2023. With all three methods, export figures are compared with Turkey’s 2023 vision. In this comparison, the estimation values obtained with Polynomial Curve Fitting Methods were found to be close to export values of Turkey’s 2023 vision. Besides, the estimation made with Polynomial Curve Fitting Methods in the export comparison between the years 1970-2016 is also close to export values of Turkey’s 2023 vision. In 2023, the export figure was calculated as 544.23 billion dollars by using Polynomial Curve Fitting Methods. As a result, our estimation method using industrial electricity consumption has been successful. In addition, the estimated value (544.23 billion dollars) made by the Polynomial Curve Fitting Method using industrial electricity consumption showed that the export target of 2023 for Turkey was possible. However, in the estimation with the same model, the import value was estimated as 683.24 billion dollars. In this case, according to the estimations made with the electricity consumption of the industry, it is seen that the imports increased together with the exports and the foreign trade deficit of Turkey continued.
References
- Adams, F.G., & Shachmurove, Y. (2008). Modeling and Forecasting Energy Consumption in China: Implications for Chinese Energy Demand and Imports in 2020. Energy Economics, 30(3), 1263-1278.
- Altıntaş, H., & Koçbulut, Ö. (2014). The Dynamics of Electricity Consumption and Economic Growth in Turkey: Bounds Testing and Causality Analysis. Erciyes University Journal of Faculty of Economics And Administrative Sciences, (43), 37-65.
- Ambroise, C., & McLachlan, G.J. (2002). Selection Bias in Gene Extraction on the Basis of Microarray Gene-Expression Data. Proc. Nat. Acad. Sci. USA, 99(10), 6562–6566.
- Bayraç, N.H., & Doğan, E. (2015). The Effects Of Energy Consumption On Economic Growth In Turkey: Markov Switching Approach. EY International Congress on Economics II "Growth, Inequality and Povert”, 1-16
- Dineri, E., & Bazarova, A. (2015). The Relationship Between Energy Consumption and Economic Growth In Turkmenistan Economy. University of Dicle Journal of Faculty of Economics and Administrative Sciences, 5(9), 96-106.
- Eren, M.V., Polat, M.A., & Aydın, H.İ. (2016). Analysis of Relationship Between Electricity Consumption and Economic Growth with Structural Breaks Tests in Turkey. Academic Sight International Refereed Online Journal, (56), 275-289.
- Kankal, M., & Uzlu, E. (2017). Neural Network Approach with Teaching–Learning-Based Optimization for Modeling and Forecasting Long-Term Electric Energy Demand in Turkey. Neural Computing and Applications, 28(1), 737-747.
- Kar, M., & Kınık, E. (2015). An Econometric Analysis of the Relationship Between the Types of Electricity Consumption and Economic Growth in Turkey. Afyon Kocatepe University Journal of Economics And Administrative Sciences, 10(2), 333-353.
- Karagöl, E., Erbaykal, E., & Ertuğrul, H.M. (2011). Economic Growth and Electricity Consumption in Turkey: A Bound Test Approach. Doğuş University Journal, 8(1), 72-80.
- Mucuk, M., & Uysal, D. (2009). Energy Consumption and Economic Growth in Turkish Economy. Journal of Revenue, 157, 105-115.
- Rahman, M.N., & Esmailpour, A. (2015). An Efficient Electricity Generation Forecasting System Using Artificial Neural Network Approach with Big Aata. IEEE, First International Conference on Big Data Computing Service and Applications, 213-217.
- Sari, R., Ewing, B.T., & Soytas, U. (2008). The Relationship Between Disaggregate Energy Consumption and İndustrial Production in the United States: An ARDL Approach. Energy Economics, 30(5), 2302-2313.
- Sen, B., Mandal, U.K., & Mondal, S.P. (2017). Advancement of an İntelligent System Based on ANFIS for Predicting Machining Performance Parameters of Inconel 690–A Perspective of Metaheuristic Approach. Measurement, 109, 9-17.
- Sokolov-Mladenović, S., Milovančević, M., Mladenović, I., & Alizamir, M. (2016). Economic Growth Forecasting by Artificial Neural Network with Extreme Learning Machine Based on Trade, İmport and Export Parameters. Computers in Human Behavior, 65, 43-45.
- Tabrizi, S.S., & Sancar, N. (2017). Prediction of Body Mass Index: A Comparative Study of Multiple Linear Regression, ANN and ANFIS Models. Procedia Computer Science, 120, 394-401.
- Tatlı, H. (2015). The Relationship Between Total Energy Consumption And Economic Growth Through A Multivariable Production Model: The Case of Turkey. Hacettepe University Journal of Economics and Administrative Sciences, 33(4), 135-157.
- Tunalı, H., & Ulubaş, M.A. (2017). The Relationship Between Electricity Consumption and Economic Growth: A Regression Analysis on G7 Countries (1970-2015). Selcuk University Vocational School of Social Sciences Journal, 20(1), 1-13.
- Turkish Electricity Transmission Corporation (TEIAS) (2018). Sector Reports. Retrieved from https://www.teias.gov.tr/tr/sektor-raporlari
- Turkish Statistical Institute (TUIK) (2018a). Energy Statistics. Retrieved from http://www.tuik.gov.tr/PreTablo.do?alt_id=1029
- Turkish Statistical Institute (TUIK) (2018b). Foreign Trade Statistics. Retrieved from http://www.tuik.gov.tr/PreTablo.do?alt_id=1046
- Usta, C., & Berber, M. (2017). Sectoral Analysis of Relationship Between Energy Consumption and Economic Growth in Turkey. The International Journal of Economic and Social Research, 13(1), 173-187.
- Usta, C. (2016). Regional Analysis of Relationship Between Energy Consumption and Economic Growth in Turkey. International Journal of Economics and Innovation, 2(2), 181-201.
- Weisstein, E. W. (2018). Least Squares Fitting. From MathWorld--A Wolfram Web Resource. Retrieved from http://mathworld.wolfram.com/LeastSquaresFitting.html
Copyright information

This work is licensed under a Creative Commons Attribution-NonCommercial-NoDerivatives 4.0 International License.
About this article
Publication Date
28 January 2019
Article Doi
eBook ISBN
978-1-80296-053-2
Publisher
Future Academy
Volume
54
Print ISBN (optional)
-
Edition Number
1st Edition
Pages
1-884
Subjects
Business, Innovation, Strategic management, Leadership, Technology, Sustainability
Cite this article as:
Pençe, I., Tunç, H., Şişeci Çeşmeli, M., & Kalkan, A. (2019). Forecasting Imports And Exports Of Turkey Using Artificial Intelligence Methods. In M. Özşahin, & T. Hıdırlar (Eds.), New Challenges in Leadership and Technology Management, vol 54. European Proceedings of Social and Behavioural Sciences (pp. 217-228). Future Academy. https://doi.org/10.15405/epsbs.2019.01.02.19