
Case Study Of Kemerovo Region With High Concentreation Of Single-Industry Towns


Abstract
Single-industry towns in Russia in last decade have become one of the most urgent issue. The highest relevance of the development problem of the core industries is for the regions with the largest concentration of such settlements – Kemerovo region with 24 single industry towns (urban districts) and urban settlements. The article conducts the research of the sales revenues of the companies in Kemerovo region by single-industry towns listed in the official government order. The final sample includes 20 towns and settlements with core industry company representatives. The authors explore the dynamics of sales revenues in the core industries of each settlement and concentration indexes adopted for the single-industry towns research. The article offers the original method of Gini coefficient evaluation and implementation for core and non-core industry concentration assessment. Using the U-shaped pattern dependence between the diversification strategy and the economic growth, the authors identify the single-industry towns for which the specialization strategy does not contradict to the level of economic growth due to higher per capita income and dynamics of the sales revenues, including Mezhdurechensk, Leninsk-Kuznetsky, Novokuznetsk, and Yashkino. The other single-industry towns are worth to focus on the diversification strategy. The result supports to differentiate the single-industry towns by possible diversification stages and to offer the further development.
Keywords: Single-industry townKemerovo regionconcentrationdiversificationsales revenues
Introduction
Global tendencies in cities development predict extremely high urban expansion by 2030 (Cohen, 2006; Güneralp & Seto, 2012) and even further (Angel et al., 2011). While the economic power is constantly concentrating in developed cities, the cities with manufacturing past suffer from economic decline, such peripheral territories are excluded from major economic processes only fuelling the economic growth (Sassen, 2016). Company towns, resource towns or other single-industry settlements (monotowns) with low diversity of economic activities become the victims of this process, integrating the problems of economic depression, shrinkage and lack of investments, making the choice between ongoing specialization with industrial survival and diversification of their economic base be the urgent decision.
The concentration of the economic activates in the dominant industry leads to the risk of unsustainability in economic development. Jacobs (1969) and the followers argue that the more an economy is diversified, the more it is stable to the economic shocks (Siegel et al., 1995; Dissart, 2003). On the contrary, similar companies can co-locate and share the costs of labour training and extensive inputs for production that can be the driver of the innovation and employment growth in accordance with Marshallian agglomeration (Martin & Sunnley, 2014). These two opposite theories are resolving differently. Duranton & Puga (2014) assert that after the discovery of the ideal set of inputs, the diversified ('nursery’) city moves to the specialized city (the place to produce the mature goods) due to the fact, that the industrial diversity causes the higher costs in city. At the same time the export diversification researches at the macro level show
s
that the diversification strategy is used by poor, developing countries whereas specialization becomes the core strategy in countries with high capita income stimulating the state economic growth; so the dependence between economic growth and the diversification strategy displays a U-shaped pattern (Imbs & Wacziarg, 2003; Klinger & Lederman, 2006; Cadot et al., 2011).
Considering the U-shaped pattern in relation to per capita income and distribution of economic activity in sectoral diversification (Imbs & Wacziarg, 2003) we suppose that the extremely high concentration in Russian single-industry towns no longer corresponds to the low level of their development. Thus, the further concentration of the sectorial economy has no sense due to the absence of the “inner fuel” of the high per capita income. At the same time we focus on the underestimated factor of regional development – the high concentration of single-industry towns in the separate area.
In this paper we explore Kemerovo region (Kemerovskaya oblast) as a leader territory in Russia by the number of single-industry towns: 24 from 49 towns and urban settlements of the region are in the official list of Russian single-industry towns; 19 from 20 towns of the region except the administrative center have this status that allows collecting the full sample of the single-industry towns in the separate region. The evaluation and the analysis of the concentration in this region in dynamics let us
to
draw a conclusion about
concerning
the stage of the diversification in Kemerovo region and suggest the strategic directions of the territorial development.
Problem Statement
Despite the constant research in the field of the development of single-industry towns in the last decade in Russia with the broad support policy at the federal level, the training programs for municipal administrative teams, regional and state cooperation agreements, infrastructure and investments projects co-finding on the public-private partnership (PPP) base, the significant structural shifts of the single industry towns’ economy has not revealed. The search of the private investments for the implementation of the developed projects rarely gives a positive result. At the same time, the science does not give the comprehensive assessment results concerning diversification effectiveness in single-industry towns and at the regional level, except for separate studies with limited sample of single-industry towns (Lipsits, 2000; Turgel, 2014; Rastvortseva & Manaeva, 2016; Antonova et al., 2016). The lack of the studies is the result of the fragmentation and the incompleteness of statistical information. The collection of statistical data at the municipality level has significant limitations. The incompleteness of the dynamics data on municipalities is connected with the legislative prohibition of statistical bodies to provide information about specific enterprises on the considered type of activity. In addition, the losses and errors of primary data, the peculiarities of the methodology during their processing in statistical bodies have the considerable impact on the research results. In this case data collection and processing at the level of the city enterprises will minimize the mentioned problems of data quality.
Research Questions
In this article we focus on the industrial concentration and, on the contrary, diversification in the single-industry towns of Kemerovo region conducting the case study of the region with large number of single-industry towns. The article offers the comparative analysis of the sales revenues of the core and non-core enterprises in 20 single-industry towns of the region in 2013-2016. Engaging the data at the micro level avoids the fragmentation and the incompleteness of municipal statistical information and the difference in the municipal status of towns and urban settlements; moreover, the considered type of data gives the opportunity to use the statistical and econometrical methods of the research to evaluate the core industry concentration and diversification. The dynamics of the enterprise sales revenues concentration and changes are considered in contrast with the per capita income in the definite town that allows us to conclude about the stage of the diversification of the considered towns in the region.
Purpose of the Study
The purpose of the research is to evaluate the core industry concentration in the single-industry towns of Kemerovo region employing the wide range of concentration and diversification indexes and to conclude on the stage of the town diversification regarding to the per capita income in each single-industry town.
Research Methods
Primary sample included the sales revenues data of the companies in 24 single industry towns according to the analytical system “SPARK”. Nevertheless, the following towns and urban settlements were excluded from the sample: Salayr (town), Sheregesh (urban settlement), Belogorsk (urban settlement), and Tayga (urban district). The cause of the exception is that the core industry of these towns and urban settlements is presented by the vertically integrated structures of the higher level that are registered in other towns. The final sample comprises 20 single-industry towns and settlements, listed in figure
The firest step of the research includes the dynamics analysis of core industry enterprises within 2013-2016. Further the authors apply the concentration indexes to evaluate the diversity of the companies by the sales revenue: CR (Concentration Ratio), HHI (Herfindal-Hirshman Index), E (Multigroup Entropy Index or Theil Index), R-HT (Rosenbluth and Hall-Tideman Index), G (Gini Coefficient), CV (Coefficient of Variation). All the indexes are compared in the previous work by Antonova et. al (2018) taking into account the possibility to apply them to the researching object. We apply the following peculiarities of the indexes to the estimation of the enterprises’ revenues in single-industry towns (table
All concentration indexes are estimated in dynamics in 2013-2016 in contrast to the per capita income by towns and settlements
Findings
The analysis of the sales revenues dynamics in single-industry towns in Kemerovo region shows the general growth of the core industry by 41% in 2013-2016. All towns except Polysaevo, Tashtagol, Topki, and Yurga have grown up in sales revenues of the core industry enterprises. The leaders in sales revenues increase are Leninsk-Kuznetsky (10.7%), Mezhdurechensk (8%) and Novokuznetsk (5%). The impact of each town in the general sales revenues is depicted in the figure
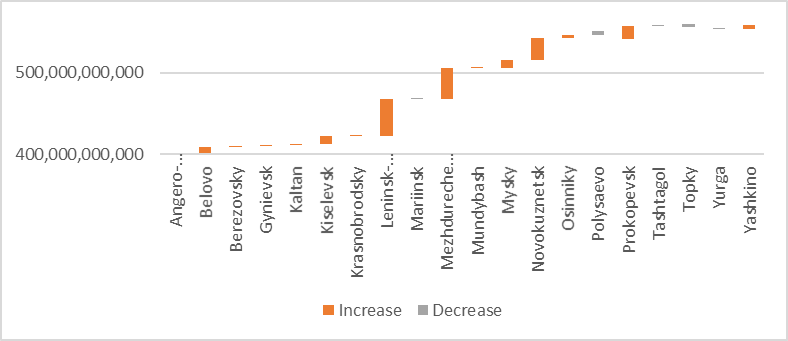
The following companies show the highest growth in sales revenues between 2013-2016: “SUEK” in Leninsk-Kuznetsky, “The Raspadskaya mine” in Mezhdurechensk, “West-Siberian steel mill” as a core industry company and “SMK” as a new company of the related economic activity in Novokuznetsk. Nevertheless, the total growth in sales revenues by leading companies is lower then the official level of inflation and at the same rate as the total sales revenue growth in the core industry (over 40% for the considered period). The letter defines, on the one hand, the flat development tendency in the core industry of the region. On the other hand, we can see rather decrease dynamics in the sales revenues of the largest enterprises: “Southern Kuzbass” in Mezhdurechensk in 2013-2014 (6% decrease) and 2015-2016 (14% decrease) and “Kuznetskie Ferrosplavy” in Novokuznetsk (7.5% decrease) in 2015-2016. Thus, the dynamics of the core industry by sales revenues is not homogeneous. In this case the further concentration analysis will clarify the rate of heterogeneity.
In the research we focus on the five basic concentration indexes that are depicted in figure
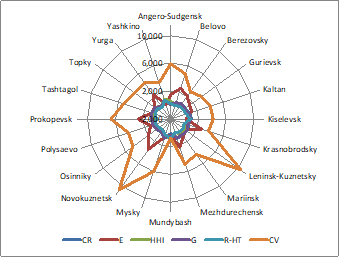
The correlation analysis of the calculated indexes reveals the high correlation between CR and G (Pearson correlation coefficient is at least 0.92 within 2013-2016) and R-HT and HHI (0.85-0.97 within 2013-2016) as well as with E (0.85-0.91). Thus we can focus on the three basic indexes: G, R-HT and CV that are depicted in figures
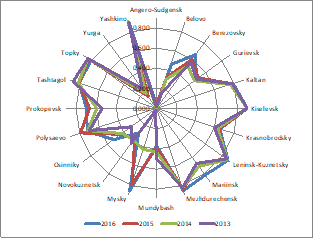
Gini index is directly relevant to the concentration ration (CR) of the core industry. The highest concentration of it occurs in Angero-Sudgensk, Topky, Tastagol, Polysaevo, Mysky, Mezhdurechensk, Leninsk-Kuznetsky and Kiselevsk for the all considered period of 2013-2016. The exception is Mysky experiencing low concentration in 2013-2014 that further is converted to the high rate (figure
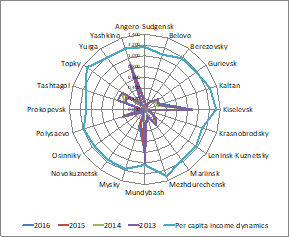
Rosenbluth and Hall-Tideman indexes are relevant to HHI and E considering all companies in the sample without the core industry separation. The highest concentration occurs in Kiselevsk, Mundybash, and Yaskino. At the same time we consider the per capita income in each of 20 towns and conclude that the highest growth in monthly incomes per capita occurs in Yaskino (33% in 2013-2016). Thus, the specialization strategy in these settlements does not contradict to the economic growth level due to the U-shaped dependence theory. The same strategy can be offered (with deeper further analysis) for Leninsk-Kuznetsky, Mezhdurechensk and Novokuznetsk, whereas the other towns and urban settlements need to do more efforts toward the diversification strategy.
Conclusion
In the article we suggest the application of five basic concentration indexes to evaluate the sales revenues in single-industry towns. As the result it is defined the towns with the highest concentration level. The leaders in sales revenues concentration in Kemerovo region are Leninsk-Kuznetsky, Novokuznetsk and Mezhdurechensk. These three towns have both the highest concentration and the highes growth dynamics in the core industry in the region. At the same time Novokuznetsk and Mezhdurechensk have extremely large variation in sales revenues of all considered companies. The comparison between income per capita in towns and the level of the concentration suggests that the only Leninsk-Kuznetsky, Novokuznetsk, Mezhdurechensk, and Yashkino can continue the specialization strategy whereas the others are better to change it into the diversification one in accordance to the U-shaped pattern dependence between a diversification strategy and an economic growth.
Acknowledgments
The authors acknowledge the financial support from the President of Russian Federation Grant (No. МК-5598.2018.6).
References
- Angel, S., Parent, J., Civco, D. L., Blei, A., & Potere, D. (2011). The dimensions of global urban expansion: Estimates and projections for all countries, 2000–2050. Progress in Planning, 75(2), 53-107.
- Antonova, I. S., Pchelintsev, E. A., & Vavilov, D. D. (2016, January). Company town socio-economic transformation: concentration and factors system. SHS Web of Conferences. EDP Sciences, 28, 01006. URL: http://dx.doi.org/10.1051/shsconf/20162801006
- Antonova, I. S., Bannova K.A., Solomahina E.S. (2018, April). Diversification indexes: arrangement and application possibility for company towns. The European Proceedings of Social & Behavioural Sciences (EpSBS).25, 43-54. URL: http://dx.doi.org/10.15405/epsbs.2018.02.6
- Cadot, O., Carrère, C., & Strauss-Kahn, V. (2011). Export diversification: What's behind the hump?. Review of Economics and Statistics, 93(2), 590-605.
- Cohen, B. (2006). Urbanization in developing countries: Current trends, future projections, and key challenges for sustainability. Technology in society, 28(1-2), 63-80.
- Dissart, J. C. (2003). Regional economic diversity and regional economic stability: research results and agenda. International Regional Science Review, 26(4), 423–446.
- Duranton, G., & Puga, D. (2014). The growth of cities. In Handbook of economic growth (Vol. 2, pp. 781-853). Elsevier.
- Güneralp, B., & Seto, K. C. (2013). Futures of global urban expansion: uncertainties and implications for biodiversity conservation. Environmental Research Letters, 8(1), 014025.
- Imbs, J., & Wacziarg, R. (2003). Stages of diversification. American Economic Review, 93(1), 63-86.
- Jacobs, (1969). The economy of cities. New York, Random House.
- Klinger, B., & Lederman, D. (2006). Diversification, innovation, and imitation inside the global technological frontier. World Bank Policy Research Working Paper 3872.
- Lipsits I. V. (2000). Monoprofile city-forming enterprises: database of city-forming enterprises and single-industry towns in Russia.Publishing house Chronicler
- Rastvortseva S. N., Manaeva I. V. (2016) Company towns in the system of productive forces of regions of the Russian Federation. Issues of territorial development, 5(35), 1-9
- Sassen, S. (2016). The global city: strategic site, new frontier. Managing Urban Futures (pp. 89-104). Routledge.
- Siegel, P. B., Johnson, T. G., Alwang, J. (1995) Regional economic diversity and diversification. Growth and Change, 26, 261–284
- Turgel, I.D. (2014). Russian monofunctional cities: from survival to sustainable development. Directmedia.
Copyright information

This work is licensed under a Creative Commons Attribution-NonCommercial-NoDerivatives 4.0 International License.
About this article
Publication Date
17 December 2018
Article Doi
eBook ISBN
978-1-80296-049-5
Publisher
Future Academy
Volume
50
Print ISBN (optional)
-
Edition Number
1st Edition
Pages
1-1464
Subjects
Social sciences, modern society,innovation, social science and technology, organizational behaviour, organizational theory
Cite this article as:
Antonova, I. S., Pchelintsev, E. A., & Garimova, P. A. (2018). Case Study Of Kemerovo Region With High Concentreation Of Single-Industry Towns. In I. B. Ardashkin, B. Vladimir Iosifovich, & N. V. Martyushev (Eds.), Research Paradigms Transformation in Social Sciences, vol 50. European Proceedings of Social and Behavioural Sciences (pp. 42-49). Future Academy. https://doi.org/10.15405/epsbs.2018.12.6