
Methodical Approaches To Classification Of Clasters Of Economic Entities


Abstract
This paper develops a clustering algorithm that generates sets of quantitatively derived industry cluster definitions based on clearly specified parameter choices. The method also provides quality assessment parameters for each set of cluster definitions. As a research object, the article uses Russia. However, the methodology can be applied to any other country. Using data for the year of 2014 for most service and manufacturing industries and multiple measures of inter-industry relations, we have systematically generated and ranked numerous sets of cluster definitions. We use this algorithm to propose a new set of systematically generated cluster definitions that incorporate measures of industry linkages based on co-location patterns, input-output links, and labor occupation links. This set of cluster definitions can be used to describe the structure of industry interdependencies today, and can be replicated and updated over time. We find that this set of cluster definitions captures many types of inter-industry externalities (demand, supply, skills, and others). Although these definitions continue to be valuable, they rely in part on expert choices and ex-post rules due to limitations in the underlying data and methods available at the time that they were created. As a result, they are difficult to replicate and update over time.
Keywords: Clusterclustering algorithmcluster definitions
Introduction
The need for information and new methodologies for determining clustering helps to increase the regional economic potential and develop successful regional strategies. The purpose of this study is to develop new methods for presenting modern concepts of clusters in all areas. Michael Porter defines a cluster as "a geographically close group of interconnected companies, suppliers, service providers and related institutions in a particular area, linked by external factors of various types." Clusters are collections of industries related by knowledge, skills, resources, demand and other links. Within regional clusters, enterprises and related organizations (for example, universities and local authorities) can operate more efficiently and share common technologies, infrastructure, knowledge, supply and demand.
The presented cluster analysis is based on detailed data that allows you to create a benchmark for regional clusters. This is important for Russia. There is a very large and unique economy, in which there are many industry clusters in various industries. Secondly, in Russia there are a greater number of different highly integrated regions, where industry actions are highly dependent on the main agglomeration economies. Thirdly, Russia still provides little detailed information about the employment of its citizens and other measures of economic activity in regions and industries. The data obtained allow us to go beyond the industry categories, which are poorly adapted to take into account the actual links between their associated economic activities.
Problem Statement
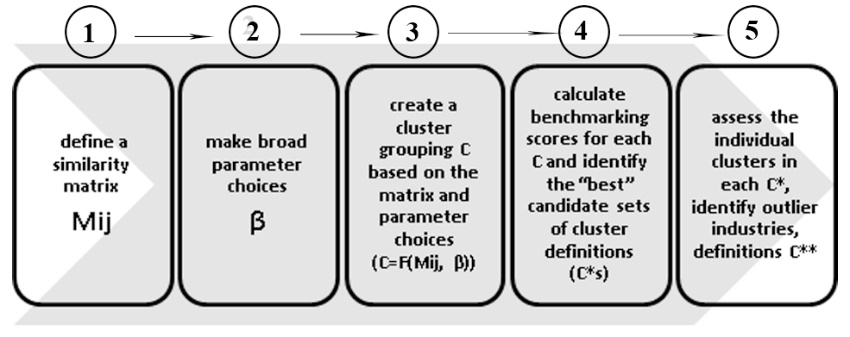
To obtain transparent, reproducible and useful data for cluster industries, we use modern cluster analysis — numerical methods for classifying similar objects (cities, people, genes, industries, etc., similarly to Delgado, Porter and Stern), which will be grouped together (Everitt, Landau, Leese, Stahl, 2011). Unlike network analysis, when each object is associated with any other object, cluster analysis creates groups (called clusters) in such a way that objects in one cluster are more similar to each other than those in other groups. Although analyzing clusters of related industries requires considering a large number of dimensions, we will be able to identify key data that can be used as input to the cluster model. Then we will create a clustering algorithm to create quantitative derivatives of cluster definitions based on the obtained key options. Within the framework of this algorithm, we will develop exact criteria for evaluating various variants of cluster definitions. Then we change the key parameters and practice iterations to generate and compare different sets of cluster definitions. The analysis is made on the grouping of industries in the service sector and production, in industries that do not overlap with each other. We refer to each set of definitions of individual clusters (groups) in the form of C. We have developed, by analogy with the American researchers Delgado, Porter and Stern, five basic interrelated steps to create and evaluate each set of cluster definitions C:
Research Questions
Step 1: Similarity Matrix: Mij
The first step to group related industries into clusters is to define the degree to which each pair of industries is related. A similarity matrix Mij provides the relatedness between any pair of industries i and j. The matrix is based on the choice of an indicator and the similarity measure. It defines the locational correlation of employment of a pair of industries as the correlation coefficient between employment in industry i and employment in industry j in region r:
LC-Employmentij= Correlation (Employmentir, Employmentjr) (1).
The correlation coefficient is a well-known distance measure for continuous data used in clustering analysis (Everitt et al. 2011). Similarly, we also define an alternative locational correlation based on the count of establishments (versus employment) in a region-industry (LC-Establishments):
LC - Establishments ij= Correlation (Establishments ir, Establishments jr) (2).
Both employees and firms are involved in the agglomeration, so it makes sense to develop a model for co-location of institutions' accounts. We use economic constants. Although the LC measures usually fix relevant connections, it is possible that in some cases, industries with a high level of co-location may have small economic relations (Delgado, 2012). For pairs of industries with a multitude of zeros in different places, the LC can be shifted upwards. We solve this problem using EAs as a regional unit (compared to counties). This index, developed by Allison and Glaser, records whether the two industries are more collaborative than expected, if their employment is randomly distributed. We use the revised ISP version in Ellison, Glaser and Kerr:
COI ij= ∑ (sri- xr)*(srj- xr )/ (1-∑rxr2 ) (3)
where sri is the share of employment I in the region - r; and xr measures the aggregate size of a region r, which they model as the average share of employment in a region by industry. A value of zero or negative for COI does not imply any joint agglomeration based on external factors. The higher the positive value of COI, the greater the potential for external effects between the two sectors. We extend the analysis of Ellison, Glaeser and Kerr and calculate COI for various industries and services, using employment data in 2009 as a regional example of the work of the units. I / O tables are more appropriate for production than services, and therefore can better capture links between manufacturing industries. Following Ellison et al., We build a symmetric model of the relationship between any pair of industries i, j based on the maximum of all unidirectional input and output links:
IOij = Max{input I -j , input i - j ,output i –j ,output i -j} (4).
Paired input (output) data represent the percentage of the total cost of input data from one industry to another. Most paired industrial combinations have a small IO compound (Ellison et al., 2010), which makes the distribution over all pairwise combinations very incorrect. The average value of this variable is 0.014. References to employment (Occ). Labor professions were used as benchmarks to measure the extent to which industries have similar skills and knowledge (Koo, 2005; Glaeser, 2009). Using this data and following Glaeser and Kerr, we calculate the relationship between the colloborations of any two industries.:
Occij = Correlation (Occupationi, Occupationj),
where "Occupation" is a vector with the percentage of each of the 792 professions in the general process of production in industry i. Some of the limitations of this indicator are that it abstracts from location patterns; and employment data are available only at one of the levels (i.e., industries with the same ratio will have the maximum professional interaction in interaction). Using a multidimensional or “hybrid” similarity matrix, we can work around some of the limitations for defining all used Mij. For example, we compute Mij, which is the average of four (standardized) individual matrices.:
LC-IO-Occij = Avg(LC-employmentij,
LC-establishmentsij, IOij, Occij).
Step 2: Broad Parameter Choices: β
The choice of parameters (β) required as input for clustering functions includes setting the initial number of clusters (i.e. number of groups) and the condition of how the base data should be correctly determined and initial values for the formed clustering function are set. An important parameter choice in clustering analysis is the initial number of clusters (numc). Existing methods for determining the “optimal” number of clusters in a clustering analysis are very inconclusive (Everitt et al., 2011). Therefore, BCD (Feser, 2008) deals with a large number of clusters based on the input-output formula in Feser.
Step 3: Clustering Function: C = F(Mij, β).
Clustering functions are designed to determine the ratio of relationships between clusters in each industry. There are several clustering functions F (•) for grouping industries. This explains why, for similarity matrices that require additional manipulation of the original data (for example, IO or COI), we can only use a hierarchical function. Next, we will check steps 1 through 3 of the clustering algorithm.
Step 4: Benchmark Scores for each C
To determine how a particular set of cluster groups relates to others, we have developed numerical control checks that can be compared with sets of cluster definitions (C). To generate these check checks, we need to define a coefficient that allows us to define a set of cluster definitions. In our analysis, a good set of cluster definitions satisfies three consecutive criteria. The first and main criterion is the internal relationship (WCR), which must be greater than the external relationship between clusters (BCR). Estimated checks: high intracluster relationship. Based on the definition of the Porter cluster, we further develop new validation assessments that capture the extent to which individual clusters (and industries) have intracluster connectivity (WCR) and external interconnection between clusters (BCR). We define WCR as the average connectivity between pairs of industries in a cluster, while BCR is the average relationship between industries in two different clusters. For example, consider two clusters in C: cluster c1 with industries a1, a2 and cluster c2 with branches b1, b2; and the similarity matrix Mij (for example, LC occupancy). Then the WCR of the focal cluster c1:
WCR c1 = Mа1а2 , and the BCR= of c1 and c2 is BCR c1,c2= Avg (Ma1b1, Ma1b2, Ma2b1,M a2b2).
For each cluster, we calculated BCR with any other cluster and examined its distribution to calculate two values — the average and the 95%. We determined how far the WCR of the cluster is above these two thresholds. Once we determined the WCR and BCR for each cluster, we calculated the validation score that captures the percentage of clusters with WCRc greater than BCRc (VS-Cluster or VS1). This assessment consists of two tasks. The first involves calculating the percentage of clusters with WCR above average and the BCR of this cluster with other clusters (VS1 Avg) based on a specific similarity matrix Mij. The second task is similar, it calculates the percentage of clusters with a WCR above the 95th percentile value of BCR (VS1 Pctile95):
VS1 Avg mc= (100/Nc)* [WCR (M ) >AvgBCRc,-c (Mij)] 6(a);
VS1 Pctile95mc =(100/Nc)* I[WCR (M )> Pctile95BCR (Mij)] 6(b)
where Nc is the number of clusters in C (e.g., 41 in the BCD (Kuhlang, 2011)) and I is the indicator function equal to 1 if WCRc>AvgBCR in (6a) or WCRc>Pctile95BCR in (6b). For example, for the BCD the VS1 Avg score is 95% based on Mij=LC-Employment, meaning that 39 (of 41) clusters have WCR>AvgBCR.
We compute (6a) and (6b) based on 4 different Mij (LC-Employment, LC-Establishments, IO, and Occ), resulting in eight sub-scores that we then average to generate the main validation score:
VS-Cluster = Avg (VS Avg, VS Pctile95).
We calculated the conformity score that characterizes the individual clusters. We also determined the validation check values based on the compliance of individual industries with their cluster (VS-Industry or VS2). For a given industry i, we assume that it is more connected with industries in its own cluster than with industries outside its cluster. Similarly, in VS-Cluster, we measure the percentage of industries with WCRic higher than their average BCRic (VS2 Avg) and higher than the 95th percentile of BCRic (VS2 Pctile95) based on various similarity matrices.
VS2 Avgmc=(100/675)* ∑I[WCRic (Mij) >AvgBCR1,-c(Mij)] (7a);
VS2 Pctile95 =(100/675)* ∑I[WCRic (Mij )> Pctile95BCRi,-c(Mij )] (7b).
We compute (7a) and (7b) based on 4 different Mij (LC-Employment, LC-Establishments, IO, and Occ), resulting in eight sub-scores that we then average to generate the validation score Mij:
VS-industry =Avg(VS2 Avg Mij,VS2 Pctile95 Mij).
The findings suggest that the higher the validation checks, the better the sets of clusters in the industries. However, even for clusters with high checks, there may be inconsistencies in the individual clusters, which will require the redistribution of individual indicators to obtain the final set of clusters. This step is discussed further.
Step 5: Assessing Individual Clusters and Branches of Applicant C *
Since clustering analysis cannot completely replace expert judgment, the methodology ends with the systematic correction of anomalies and the characteristics of individual clusters in C *, which leads to the final definitions of C *;
Purpose of the Study
We applied the clustering algorithm to generate different sets of clusters that group different industries according to Delgado, Porter, and Stern. These definition sets are based on various similarity matrices and parameters and variations of the clustering functions discussed in the previous section. Then we generate validation checks for this set of clusters and to evaluate their quality using a number of parameters. We do not use data that has very large individual clusters (more than 100 branches per group), focusing on the other 144 sets. Although these definitions are valuable, they depend in part on expert decisions and ex-post rules. As a result, they are difficult to replicate and update over time. Finally, we show the validation checks of the cluster definition set created by our C * algorithm. This cluster definition set is created using a multidimensional similarity matrix.:
Mij=LC–IO–Occ
Research Methods
To compete effectively, regions must understand their strengths compared to other areas. Accurately comparing, requires a consistent set of cluster groups that are within the sectoral boundaries of each region. Using the clustering algorithm, we have developed a transparent set of cluster definitions, which today reflect the structure of inter-sectoral interdependencies. Using data sets that use this standard, researchers will also be able to implement a wide range of new research, providing additional tools and recommendations for practitioners and policy.
Now that we have developed an updated cluster definition algorithm, many opportunities have emerged for growing innovation in the cluster environment. First, we evaluated alternative cluster groups proposed by others, and based on similarity matrices, given the great agreement between cluster checks and careful assessment and correction of certain types of clusters at the last stage of the methodology, we understand that changes in the choice of model significantly change the final set. But the algorithm allows you to compare performance between competing cluster models. Secondly, the current analysis focuses on mutually exclusive clusters (“narrow clusters”), which include the most important industries for each cluster. The methodology provides many relationships between clusters and between any industries with any cluster based on different types of connections. Thus, we can create adjacent clusters (wide clusters) by adding additional industries that are strongly associated with the industries that make up the monocluster (Feser, 2008). Determining the similarity between clusters is important because the economics of agglomeration arise among connected clusters, as well as within individual clusters in a region (Delgado, 2012). Third, the clustering algorithm can be adapted using specific data on intersectoral structures for collocation, I / O, or other data. Comparison of regional clusters around the world will be a useful tool for assessing their complementarity and differences and informing about more effective strategies and strategies for locating industrial plants and regional groups.
Findings
Our methodology concludes with an assessment and correction of the individual clusters in C* to derive the finalized set of cluster definition C**. We explain this process here and present a summary overview of the proposed set of cluster definitions and illustrate a few selected clusters. A detailed overview of the cluster definitions, with a description of each cluster, associated industry NAICS codes, and summary calculations of the fit of each industry within its cluster (WCR scores) can be accessed in the online Technical Appendix. The proposed set of cluster definitions C** has 44 clusters. In this set, 85% of the industries are systematically assigned to clusters by steps 1-to-3 of the algorithm; 3% of the industries are systematic outliers; and 12% of the industries are marginal outliers. Some clusters, like Aerospace Vehicles and Defense, are systematically generated by steps 1-to-3 of our algorithm. This cluster contains 7 industries, and all of them fit best in the cluster as compared to the remaining 43 clusters (i.e., the rank for each industry based on WCRic score equals 1). The industry with the highest WCR score is Aircraft Manufacturing suggesting that this is a focal industry with relevant links to the other industries that constitute the cluster. Importantly, the algorithm also provides the relatedness between any pair of clusters. The two most related clusters to Aerospace Vehicles and Defense are Medical Devices and Information Technology and Analytical Instruments. Other clusters have some outlier industries reallocated in/out of the cluster. For example, we added the 6 industries related to Men’s Clothing into the Apparel cluster. These industries were originally in the Printing Services cluster, but the industry definitions and the cluster relatedness scores suggested that they were marginal outliers and Apparel was the next best cluster for them (WCR rank of 2). While we started with 41 clusters in C*, our final set of definitions has 44 clusters because we partitioned and combined some clusters to improve the coherence and usefulness of the cluster definitions. The process to arrive at these 44 clusters is documented in the online Technical Appendix. We combined 3 pairs of clusters into 3 individual clusters: two textile clusters, two financial service clusters and two food clusters. Each pair of clusters was combined because it had very high between cluster relatedness and did not seem to be conceptually different.
Conclusion
Our paper contributes to the economies of agglomeration and clustering analysis literature in several ways according to Delgado, Porter and Stern. First, our clustering algorithm allows experimentation with relevant types of industry-interdependencies measures used in the economies of agglomeration literature (input-output links, occupation links, and employment co-location) and offers a large cluster space (numerous sets of systematically derived cluster definitions based on different industry linkage measures and parameter choices). Second, it provides benchmark scores that assess the quality of each cluster definition (i.e., the ability to capture relevant inter-industry interdependencies within individual clusters). In contrast, most clustering methods do not provide scores, and so, it is up to the user to choose the "best" grouping (Grimmer, 2011). Third, the method minimizes the number of idiosyncratic rules needed, increases replicability, and facilitates the revision of the cluster definitions over time. Although generating cluster definitions will always require expert judgment for some individual clusters, the algorithm we have developed is the first to demonstrate that the process is fundamentally transparent and rules-based;
Acknowledgments
The range of problems associated with the clustering of economic entities is not limited to the development of approaches to their classification. The focus is on wide and narrow clusters, their interpenetration, and the calculation of the economic effect of these processes. Clusters are innovative objects of market structures which are used to transform economic entities into units of production and obtain high added value. This feature of the clusters provides an avenue for further research. The authors admit that they do not receive support from the state-funded research program of Irkutsk National Research Technical University. We are responsible for all errors, as well as for the heavy style of the paper.
References
- Delgado, M., Porter, M.E., Stern, S., (2012). Clusters, Convergence and Economic Performance. NBER WP 18, 250.
- Ellison, G., Glaeser, E., Kerr, W. (2010). What Causes Industry Agglomeration? Evidence from Coagglomeration Patterns The American Economic Review. 100 (3), 1195-1213.
- Everitt, B. S., Landau, S., Leese, M., Stahl, D., (2011). Cluster Analysis, John Wiley & Sons, Ltd, 5, 24-58.
- Feser, E., Renski, H., Goldstein, H., (2008). Clusters and Economic Development Outcomes, Economic Development Quarterly, 22 (4), 324-344.
- Glaeser, E.L., Kerr W.R., (2009). Local Industrial Conditions and Entrepreneurship: How Much of the Spatial Distribution Can We Explain? Journal of Economics and Management Strategy. 18(3), 623-663.
- Grimmer, J., King, G., (2011). General Purpose Computer-assisted Clustering and Conceptualization. Proceedings of the National Academy of Sciences, 108(7), 2643-2650.
- Koo, J., (2005). How to analyze the regional economy with occupation data. Economic Development Quarterly, 19, 356-372.
- Kuhlang, P., Edtmayr, T., Sihn, W., (2011). Methodical approach to increase productivity and reduce lead time in assembly and production-logistic processes. CIRP Journal of Manufacturing Science and Technology. 4, 24-32. doi: https://doi.org/10.1016/j.cirpj.2011.02.001
Copyright information

This work is licensed under a Creative Commons Attribution-NonCommercial-NoDerivatives 4.0 International License.
About this article
Publication Date
17 December 2018
Article Doi
eBook ISBN
978-1-80296-049-5
Publisher
Future Academy
Volume
50
Print ISBN (optional)
-
Edition Number
1st Edition
Pages
1-1464
Subjects
Social sciences, modern society,innovation, social science and technology, organizational behaviour, organizational theory
Cite this article as:
Beregova, G., & Tsibanova, N. (2018). Methodical Approaches To Classification Of Clasters Of Economic Entities. In I. B. Ardashkin, B. Vladimir Iosifovich, & N. V. Martyushev (Eds.), Research Paradigms Transformation in Social Sciences, vol 50. European Proceedings of Social and Behavioural Sciences (pp. 198-205). Future Academy. https://doi.org/10.15405/epsbs.2018.12.25