
Stem Gender Gap And Intra-Individual Strengths In Maths And Russian Language


Abstract
The study investigates STEM gender gap by means of intra-individual strengths (IIS) analysis, defined as the difference between Maths and Russian exam grades. The sample of Russian students (n = 788) was split into 3 groups, according to their degrees: Technical (n=282); Natural Sciences (n=128); and Humanities (n=378). Students completed an online battery of cognitive tests and a demographic questionnaire. Their grades for the Unified State Exam (USE) in Maths and Russian Language, taken at the end of compulsory school education, were also collected. IIS were negative for all degrees, indicating that individuals’ maths exam grades were on average lower than Russian exam grades. The size of IIS differed across the three groups (d=.42-.93). Absolute mean values of IIS were smallest for Technical degrees (-9.52±12.88); largest for Humanities (-25.09±21.6); with Natural sciences in between the two (-16.71±21.61). Technical and Natural Sciences groups showed on average significantly higher Maths USE grades than Humanities group (d=.78 and .52, respectively). Technical group showed lower Russian Language USE grade than Humanities group (d=.2); whereas, Natural Sciences and Humanities groups did not differ. Females on average outperformed males in the Russian language exam, with small effect sizes (η2=.01-.05, estimated for the three groups separately). No sex differences were observed for maths exam performance. For intra-individual strengths, negligible sex differences were found for all groups (η2=0.006-0.009). The results suggest that IIS may play a role in the choice of area of study, but is unlikely to explain the STEM Gender Gap in the Russian sample.
Keywords: Intra-individual strengthssex differencesUnified State ExamSTEM gender gap
Introduction
The number of women studying and working in science, technology, engineering, and mathematics (further – STEM) is significantly lower than the number of men in STEM (Ceci & Williams, 2007). This disproportion of women and men is called STEM gender gap. Although the gender gap decreased in recent decades (Ceci, Ginther, Kahn, & Williams, 2014), females are still less likely to choose careers in STEM than their male peers (Ceci & Williams, 2007). Moreover, research shows that women may experience disproportionate challenges in finding employment in STEM. For example, one study found that science faculty rated female applicants for a laboratory position as less competent than males, despite equivalent application materials (Moss-Racusin, Dovidio, Brescoll, Graham, & Handelsman, 2012). Cross-national research showed that proportion of women among STEM graduates differs across countries, with median of 25.4%, ranging from 12.4% in Macao to 40.7% in Algeria (Stoet & Geary, 2018). Among Russian graduates, proportion of women varies greatly across different STEM majors, from 16% of women graduates in Electronics and Mechanical engineering to: 27% in Informatics; 37% in Architecture & Construction; 40% in Physics & Mathematics; and 66% in Natural Sciences (Zhenshchiny i muzhchiny Rossii, 2016).
Paradoxically, research shows that girls earn higher grades in maths than boys (Voyer & Voyer, 2014). However, males on average outperform females in standardized maths tests (Voyer & Voyer, 2014). The observed sex differences are usually small (Cohen’s d (d) < .15) and effects vary significantly across samples, testing procedures, grade levels, and year of the study (Wang & Degol, 2016). A recent study has found that 15-year old girls performed similarly or better than boys in science in 67% out of 67 countries participating in the 2015 Program of International Students Assessment (PISA; Stoet & Geary, 2018). The study suggests that in nearly all countries more girls are capable to pursue college-level STEM study than currently enrol (Stoet & Geary, 2018).
Several studies have indicated that sex differences in mathematics performance is considerably larger at the high end of performance distribution, with no sex differences at the low end of mathematics performance (Stoet & Geary, 2013). A disproportionately higher number of males score in the right tail of the mathematics performance distribution, from which STEM specialists are often sourced (Wai, Lubinski, Benbow, & Steiger, 2010; Wai, Putallaz, & Makel, 2012). For reading, the pattern of differences is exactly the opposite, with the largest sex differences gap at the low end and the smallest gap at the high end (Stoet & Geary, 2013).
The aetiology of the observed underrepresentation of women in STEM is complex. A recent review of 30 years of research (Wang & Degol, 2016) identified a range of factors contributing to the STEM gender gap, including occupational interests or preferences; lifestyle values or work-family balance preferences; field-specific ability beliefs; gender-related stereotypes and biases; and sex differences in relative cognitive strengths. Research has also shown that these factors are influenced by complex gene-environment processes (Rimfield, Ayorech, Dale, Kovas, & Plomin, 2016).
One meta-analysis revealed a large effect size (d = .93) of the differences between the sexes in work preferences. On average, males prefer working with objects, and females – with people (Su, Rounds, & Armstrong, 2009). Additionally, on average men are more interested in STEM occupations than women (d = 1.11 for engineering; d = .34 in mathematics), while women tend to choose socially oriented professions (d = .68). Research has found that women tend to sacrifice their professional career in order to raise children, look after sick relatives, etc. (Eccles, Barber, & Jozefowicz, 1999). Sex differences in preferences and life-style values appear as early as mid-30s (Ferriman, Lubinski, & Benbow, 2009). More women shift to family-centred lifestyle when they become parents. For example, research has shown that more mothers (than women without children) value flexibility in work schedule, whereas fathers’ preferences do not differ from values of single men (Ceci & Williams, 2010; Wang & Degol, 2016). These processes may result in incerased gender gap in STEM, as some science careers demand uninterrupted intense engangement, which can be perceived as incompatible with family needs.
STEM gender gap has also been linked to the incorrect ideas of dichotomy between heritability and effort. Genetic influences are erroneously viewed as deterministic and fixed (Kovas, Tikhomirova, Selita, Tosto & Malykh, 2016). With such erroneous views, if one believes that intelligence and mathematical ability are highly heritable, one tends to believe that ability cannot be improved with consistent effort. This can be viewed as a fixed mindset. In contrast, a growth mindset perceives STEM as a potentially developing trait. Differences in mindsets have been linked to differences in maths performance between girls and boys (Dweck, 2007; Leslie, Cimpian, Meyer, & Freeland, 2015). More broadly, research suggests that men on average have higher self-efficacy, contributing to sex differences in educational achievement (e.g., Stoet & Geary, 2018).
In terms of cognitive processes, research identified spatial ability as potentially involved in STEM gender gap (Uttal et al., 2013; Shakeshaft et al., 2016). Many studies showed male advantage in some aspects of spatial ability, with the biggest effect size of nearly 1 standard deviation for 3-D mental rotation tasks (Harle & Towns, 2011). In turn, spatial ability has been linked with success in mathematical performance and STEM achievement (e.g., Wai, Lubinski, & Benbow, 2009). It is possible that not all aspects of spatial ability are involved in STEM success, as females perform similarly or better than males on some spatial tasks, including pointing, wayfinding and map drawing (Coluccia & Louse, 2004).
Research has also identified relative cognitive strengths (rather than absolute cognitive ability levels) as potential contributor to STEM gender gap (Valla & Ceci, 2014; Stoet & Geary, 2015). Such intra-individual strengths (IIS) for two abilities is defined as the difference in individual’s performance in the two abilities. For more than two measures, IIS is the level of one’s specific ability compared with the mean level of one’s other abilities (Stoet & Geary, 2018). IIS reflects the ranking of one’s aptitudes in different abilities, irrespective of absolute performance (compared to other individuals).
Research has found robust sex differences in intra-individual strengths. For example, one study found that a group with high maths & high verbal ability included more women than men (n = 298; 63% - females). A group with high maths & moderate verbal ability included more males (n = 373; 30% - females) (Wang, Eccles & Kenny, 2013). Similarly, within most PISA countries boys had higher maths intra-individual strengths relative to girls; and girls showed higher intra-individual strengths in reading compared to boys (Stoet & Geary, 2015).
Studies have shown that people with maths IIS (high math relative to language skills) are more likely to pursue STEM career, while those with comparable levels of both skills are more likely to choose non-STEM occupation (Wang et al., 2013; Lubinski & Benbow, 2006). In educational practice, students are typically recommended to make educational and career choices based on their strengths and weaknesses (Gardner, 2016). This may not be the best approach for all students, because often the IIS are very small, and the absolute levels of ability allow students to pursue both STEM and humanities careers. Recent research suggested that students are more likely to act on IIS when more choice is available to them (Stoet & Geary, 2018).
This may explain the paradoxical finding that sex differences in pursuit of STEM careers increase with increased national gender equality and overall economic stability (Stoet & Geary, 2018). In this research, as a measure of gender equality Stoet & Geary (2018) employed the Global Gender Gap Index (GGGI) accessing the degree to which women fall behind men on 14 key indicators (e.g, tertiary education enrolment ratio, salaries, etc.). GGGI ranges from 0 to 1, where 1 shows complete parity of sexes. The study showed that more gender equal countries had lower presentation of women in STEM. For example, Finland which excels in gender equality with GGGI of 0.85 (World Economic Forum, 2015) had fewer than 25% of women among STEM graduates (Stoet & Geary, 2018). In contrast, United Arab Emirates with the lowest GGGI of 0.59 (Stoet & Geary, 2018) had almost 42% of women among STEM graduates (http://data.uis.unesco.org). The gender equality index in Russia is 0.69 (World Economic Forum, 2015). As mentioned above, women’s representation in Russia among graduates varies significantly by field, from significant underrepresentation (e.g. electronics) to over-representation (e.g. natural sciences) (Zhenshchiny i muzhchiny Rossii, 2016). This pattern of results suggests that increased economic stability may lead to greater choice and greater opportunity for women to pursue their interests and perceived strengths (Stoet & Geary, 2018). In contrast, higher economic risks make relatively highly payable STEM occupations more attractive, which may lead to increased women’s engagement in STEM (Stoet & Geary, 2018). In other words, in situations of economic instability, people with intra-individual strength in language/reading (over maths) are more likely to pursue STEM career (provided their absolute level of maths is adequate).
Problem Statement
Intra-individual strengths are one of the most under-explored factors of STEM gender gap. Further research is needed to replicate the previously found pattern and size of sex differences in intra-individual strength, using different measures.
Research Questions
The current study investigates the pattern of intra-individual strengths and absolute level of perfomance in mathematics and Russian language exam performance in students pursuing different university degrees in Russia. We examine the following hypotheses:
Hypothesis 1 (IIS). There are significant differences in intra-individual strengths between groups of students pursuing different degrees (Technical vs. Natural sciences vs. Humanities). Specifically, Humanities degree is associated with higher grades in Russian language relative to mathematics. In contrast, Technical and Natural Sciences degrees are associated with higher grades in maths relative to Russian language.
Hypothesis 2 (IIS). Intra-individual strengths of males and females have opposite profiles: males are relatively stronger in mathematics, and females are relatively stronger in Russian language.
Hypothesis 3 (Absolute level). For all fields, males on average outperform females in mathematics, and females outperform males in Russian language.
Hypothesis 4 (Absolute level). On average, Technical and Natural Sciences students show advantage in maths relative to students in Humanities; Humanities students outperform Technical and Natural Sciences students in Russian language
Purpose of the Study
The study aims to provide new insights into origins of STEM gender gap, contributing to improvements in educational practice.
Research Methods
Sample
Sample included Russian universities students (n = 788; mean age = 19.69, standard deviation = 2.09) from different fields of education: 282 students (112 females) – Technical field; 378 students (304 females) – Humanities; and 128 students (90 females) – Natural Sciences (see Table
Procedure
As a part of a large on-going study of spatial ability, participants filled in a demographic questionnaire that included questions about sex, field of education, and participant’s scores in the Unified State Exam in Russian language and Mathematics. Participants completed an online spatial ability test battery at their universities or homes.
All participants gave consent for their participation. No reward was given. The data collection was anonymous, with only ID numbers entered into the database.
Measures
USE exam grade.
Unified State Exam (USE) is an exam in the Russian Federation that every student takes on completion of 11 grades of formal education. Students who plan to enter a university must pass this exam. The USE in Russian language and mathematics are obligatory; this means that every student needs to pass these subjects in order to get a high school diploma. The results are also used by Universities as entry selection criteria, with different grade thresholds for different degrees and universities. USE grades range from 0 to 100, where 100 is the highest score. Before 2015, USE Maths was universal for all degrees, and it consisted of advanced maths’ problems. From 2015, there are two levels of USE Maths, including basic and advanced level. For entering STEM degrees, an advanced level of USE Maths is required. Students who choose to pursue Humanities degree can take either basic or advanced maths exam (Krasheninnikova, 2018). In the current study, Humanities either attended universities that required advanced maths level or were sitting USE exam before 2015. Therefore, all Humanities reported results of advanced USE Maths.
Intra-individual strengths.
Intra-individual strengths score (IIS) is calculated as the difference between maths and Russian language USE scores. For example, if a student has USE Maths score of 78, and USE Russian language score of 85, the IIS equals to 78 - 85 = -7. Therefore, a negative IIS indicates that one’s Maths’ grade is lower than Russian language’ grade.
Data analysis
For hypotheses 1 and 2 we applied 3 X 2 ANOVA with field of study (Technical, Humanities, Natural Sciences) and sex (males, females) as independent variables, and IIS as dependent variable. For hypotheses 3 and 4, we run the same ANOVA twice: firstly, with a dependent variable of USE Maths; secondly, with a dependent variable of USE Russian language.
Findings
Descriptive statistics
Table
Hypotheses 1 and 2 (IIS)
We found significant differences in IIS across degrees and sex: F(5, 782) = 29.54, p < .001, r2adj = .153. Main effect of sex was significant: F(1, 782) = 17.93, p < .001. Post-hoc analysis revealed significant weak sex differences for all degrees: Technical F(1, 782) = 4.71, p < .05, η2 = .006; Humanities F(1, 782) = 6.06, p < .05, η2 = .008; Natural Sciences F(1, 782) = 7.49, p < .05, η2 = .009 (See Figure
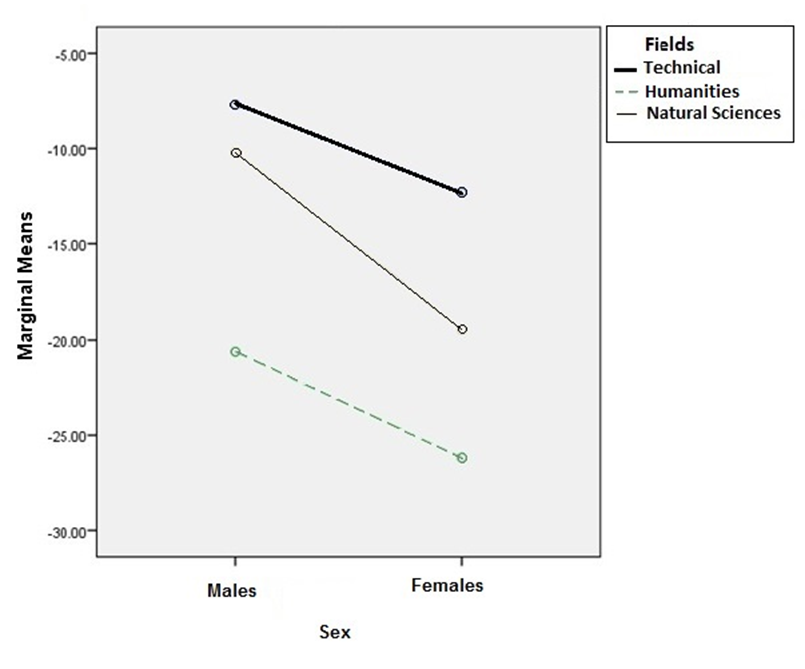
Main effect of degree was also significant: F(2, 782) = 37.54, p < .001. Post-hoc analysis revealed larger IIS for Technical degree in comparison with Natural Sciences (Cohen’s d = .45, p <.05); and Humanities (d = .93, p < .001). Natural Sciences have significantly larger IIS in comparison with Humanities (d = .42, p < .001).
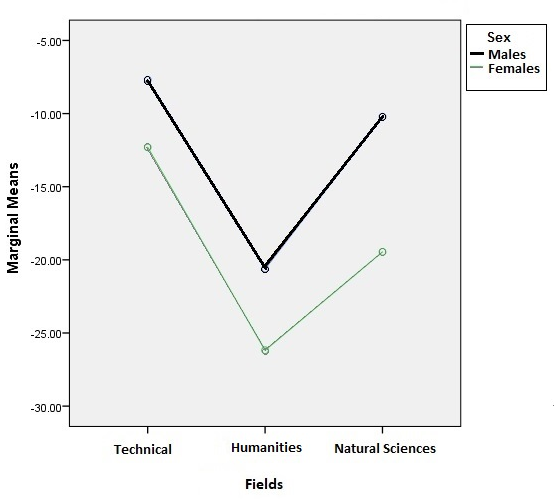
The Sex * Degree interaction was not significant, with IIS degree differences significant for both sexes: for males F(2, 782) = 14.21, p < .001, η2 = .035; for females F(2, 782) = 26.94, p < .001, η2 = .064 (See Figure
Hypotheses 3 and 4 (Absolute level)
USE Maths
ANOVA with USE Maths scores as dependent variable was overall significant, F(5, 782) = 21.98, r2adj = .118. The main effect of degree was significant: F(2, 782) = 51.34, p < .001, η2 = .116. Sex * Degree interaction, and main effect of sex were not significant.
Post-hoc analysis showed that simple effect of sex was significant only for Humanities, F(1, 782) = 5.58, p < .05, with negligible effect size (η2 = .007) in favour of girls. In contrast, there were no significant differences between sexes in USE Maths scores for Technical and Natural science degrees (See Figure
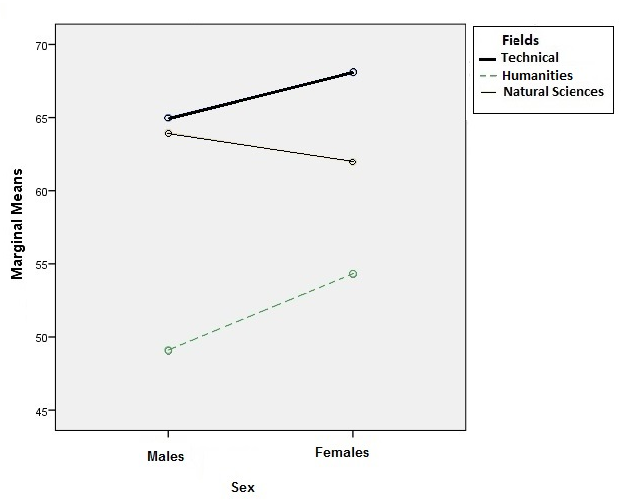
Simple effect of degree was significant for both sexes: males F(2, 782) = 24.02, p < .001, η2 = .058; females F(2, 782) = 29.69, p < .001, η2 = .071. Natural Sciences students outperformed Humanities students (d = .52, p < .001). Technical students outperformed Humanities students (d =.78, p<.001). No significant differences were found between Natural Sciences and Technical group.
On average, males from Humanities group demonstrated lower scores in USE Maths compared to males in Technical group (d = .97, p < .001) and Natural Sciences group (d = .73, p < .001). No significant differences were found between males from Technical group and Natural Sciences. Females from Technical group on average outperformed females from Natural Sciences group (d = .39, p < .05) and Humanities group (d = .83, p < .001). Females in Natural Sciences had on average higher USE Maths scores than females in Humanities (d = .45, p < .001).
USE Russian Language
ANOVA with USE Russian as a dependent variable found significant differences in USE Russian language scores across degrees and sexes, F(5, 782) = 15.23, r2adj = .083. Main effect of sex was significant, F(1, 782) = 52.54, p < .001, η2 = .063. Sex * Field interaction, and main effect of a field were not significant.
Post-hoc analysis showed that simple effect of sex was significant for all fields (see Figure
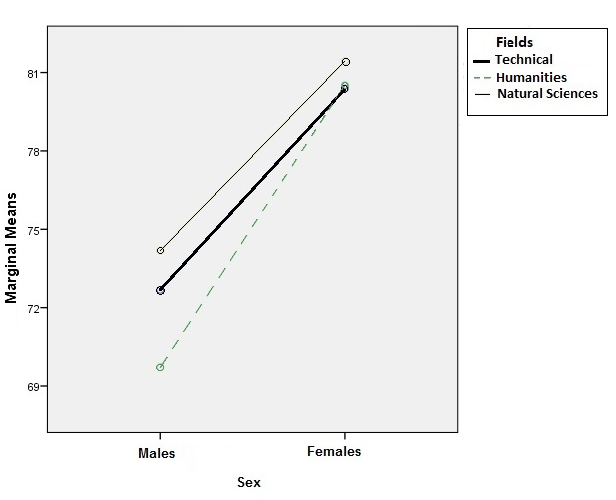
Simple effect of degree was not significant: USE Russian language scores did not differ across three groups. Natural Sciences students on average did not differ in Russian Exam from Technical and Humanities groups. A small significant advantage of the Technical group over Humanities group was observed (d = .2, p < .05).
Conclusion
The present study hypothesised that IIS between groups of students will differ by degree of study. Specifically, we expected Humanities students to show on average IIS in Russian; and Technical and Natural Sciences students to show an average IIS in mathematics. Contrary to the prediction, students in all groups showed an average advantage in Russian: for all degrees participants had smaller USE Maths relative to USE Russian language exam grades. This result contradicts previous findings (e.g. Wang et al., 2013; Lubinski & Benbow, 2006). A potential reason for this finding is that the advanced level of USE in Mathematics (taken by all participants in this study) is overall harder than the USE in Russian. Indeed, the advanced Maths USE contains complex problems of mathematical analysis and number theory at the level associated with level of undergraduate STEM study in the USA or Maths Olympiad level (Krasheninnikova, 2018).
Nevertheless, the size of IIS followed the predicted pattern as it varied across the fields of study (d = .42-.93): the smallest average IIS was observed in students pursuing Technical career; the largest IIS was found for Humanities students, and the average IIS for Natural Sciences was in-between (see Table
In regards to sex-differences, based on previous research (e.g. Stoet & Geary, 2015; Stoet & Geary, 2018), we hypothesised opposite profiles of IIS for males and females. The PISA study demonstrated a nearly universal pattern of girls’ IIS in reading and boys’ IIS in mathematics, including the PISA Russian sample (Stoet & Geary, 2018). As discussed above, the extreme difficulty of the advanced Maths USE is likely to mask this pattern in the present study. However, the observed smaller negative IIS values for boys (showing that boys received overall lower grades in Russian) suggest some difference in IIS for males and females, with negligible effect sizes (η2 = 0.006-0.009, across the three degrees). The small effect sizes are consistent with the PISA findings of smaller effect of sex on IIS in Russia than in many other countries (see Figure 2 in Stoet & Geary, 2018).
In regards to sex differences in absolute levels of performance, the present study found significant sex differences in the Russian USE, with females slightly outperforming males in all three fields of study (η2 = .01-.046). Moreover, this study has highlighted a significant underrepresentation of males in Humanities. This finding is consistent with some other research (e.g., Khasbulatova, 2016). Future research is needed to uncover the specific reasons for these results.
For mathematics, performance in USE was similar for males and females in all three fields of study. This result is inconsistent with some studies that demonstrated male advantage in maths (Stoet & Geary, 2013; Stoet & Geary, 2018). The absence of the sex differences may be related to the issue of scaling/difficulty of the USE exam. However, many previous studies failed to find male advantage (e.g., Burke & Mattis, 2007), and therefore the result may actually reflect the true similarity in performance between the sexes in Russia.
Paradoxically, the observed similarity in maths performance of Russian women & men may be to some extent related to a relatively high gender inequality. As already mentioned above, the GGGI for Russia is 0.69 (World Economic Forum, 2015), which indicates significant problems with gender equality overall. Moreover, statistics show that men on average have higher salaries than women in Russia (Gerry, Kim & Li, 2004). These and other socio-demographic factors may contribute to women’s efforts to succeed in their education and secure a stable career, often associated with STEM fields. In less economically developed countries, work-family balance preferences may be less important than economic considerations. For example, one study of high school students in Russia (n = 500, 55% – women) showed that only 3.7% of female students think that family obligations may be an obstacle for their career life (Savostina, Smirnova & Khasbulatova, 2017).
In addition, although sex differences in self-perceived ability exist in Russia, their role in career choices may be partly overpowered by other factors. For example, one study showed that 44.2% and 58.1% of women in comparison with 23 % and 25% of men were either in doubt in their capacities for STEM engagement or believed that they don’t have any abilities for STEM (Savostina et al., 2017). Despite this, 58.1% of women and 76.9 % of men were still interested in STEM higher education (Savostina et al., 2017).
As predicted, the study demonstrated that Technical group and Natural Sciences outperformed Humanities in maths (d = .78 and d = .52, respectively). For Russian language, Humanities outperformed Technical group (d = .2). No differences were found between Natural Sciences and Humanities in Russian language. The lack of differences may be associated with the fact that Natural Sciences require skills of solving problems often presented in the form of text (Halpern et al., 2007). Overall, the results of the present study are consistent with research suggesting that greater representation of women in Natural sciences over technical sciences is related to women's average strength in verbal abilities (Wang et al., 2013).
The main limitation of the present study is an opportunistic sample, with unequal numbers of students across the three fields of studies and sexes. Moreover, this study highlighted a methodological issue related to the uneven difficulty levels between the Russian and USE exams, which may have masked some of the patterns. Future research is needed to examine the IIS and absolute levels of achievement in STEM in comparison to other fields using different measures of achievement in large and diverse samples (school grades, University tests etc.). Better understanding of the socio-demographic and psychological processes underlying sex differences will lead to positive changes in access to opportunity and will facilitate evidence based educational and career advice.
Acknowledgments
This work was supported by the Russian Ministry for Education and Science project № 25.8905.2017/9.10. The reported study was funded by RFBR according to the research project № 18-313-00251 (analysis of literature).
References
- Burke, R. J., & Mattis, M. C. (2007). Women and minorities in science, technology, engineering, and mathematics: Upping the numbers. Cheltenham, UK and Northampton, MA, USA: Edward Elgar Publishing.
- Ceci, S. J., Ginther, D. K., Kahn, S., & Williams, W. M. (2014). Women in academic science: a changing landscape. Psychological Science in the Public Interest, 15, 75-141. DOI:10.1177/1529100614541236.
- Ceci, S. J., & Williams, W. M. (2007). Top researchers debate the evidence. Washington, DC: American Psychological Association.
- Ceci, S. J., & Williams, W. M. (2010). Sex differences in math-intensive fields. Current Directions in Psychological Science, 19(5), 275-279.
- Coluccia, E., & Louse, G. (2004). Gender differences in spatial orientation: A review. Journal of Environmental Psychology, 24, 329-340.
- Dweck, C. (2007). Is math a gift? Beliefs that put females at risk. In S. J. Ceci& W. M. Williams (Eds.), Why aren’t more women in 1460 science? Top researchers debate the evidence (pp. 47-55). Washington, DC, US: American Psychological Association.DOI:10.1037/11546-004.
- Eccles, J. S., Barber, B., & Jozefowicz, D. (1999). Linking gender to educational, occupational, and recreationalmchoice: applying the Eccles et al. model of achievement-related choices. In J. T. Spence (Ed.), Sexism and stereotypes in modern society: the gender science of Janet Taylor Spence (pp. 153-191). Washington: APA. DOI:10.1037/10277-007.
- Ferriman, K., Lubinski, D., & Benbow, C. P. (2009). Work preferences, life values, and personal views of top math/science graduate students and the profoundly gifted: Developmental changes and gender differences during emerging adulthood and parenthood. Journal of Personality and Social Psychology, 97, 517-532. DOI:10.1037/a0016030.
- Gardner, A. (2016). How important are GCSE choices when it comes to university? London, UK: Which? Retrieved from: http://university.which.co.uk/advice/gcse-choices-university/how-important-are-gcse-choices-when-it-comes-to-university
- Halpern, D.F., Benbow, C.P., Geary, D.C., Gur, R.C., Hyde, S. J. & Gernsbacher, M.A. (2007) The Science of Sex Differences in Science and Mathematics. Association for Psychological Science, 8(1), 1-51. DOI: 10.1111/j.1529-1006.2007.00032.x
- Harle, M., & Towns, M. (2011). A Review of Spatial Ability Literature, Its Connection to Chemistry, and Implications for Instruction. Journal of chemical education, 88(3), P. 351–360. DOI: 10.1021/ed900003n.
- Khasbulatova, О. А. (2016). Gendernye aspekty razvitiya STEM-obrazovaniya v Rossii [Gender aspects of STEM-education in Russia]. Zenshchina v rossijskom obshchestve, [Woman in Russian Society], 3(80), 3-15. [in Russian]
- Kovas, Y., Tikhomirova, T., Selita, F., Tosto, M.G.& Malykh, S. (2016). How Genetics can Help Education. In Kovas, Y., Malykh, S., Gaysina, D. (Eds.). Behavioural Genetics for Education (pp. 1 - 23). Palgrave Macmillan UK.
- Krasheninnikova, K. (2018). Bazovaya and profilnayamatematica: otlichiya [Base and profile mathematics: differences]. Retrieved from http://maximumtest.ru/post/bazovaya-i-profilnaya-matematika-otlichiya.html/ [in Russian]
- Leslie, S.-J., Cimpian, A., Meyer, M., & Freeland, E. (2015). Expectations of brilliance underlie gender distributions across academic disciplines. Science, 347, 262-265 DOI:10.1126/science.1261375
- Lubinski, D., & Benbow, C. P. (2006). Study of mathematically precocious youth after 35 years: uncovering antecedents for the development of math-science expertise. Perspectives on Psychological Science, 1, 316-345. DOI:10.1111/j.1745-6916.2006.00019.x.
- Moss-Racusin, C. A., Dovidio, J. F., Brescoll, V. L., Graham, M. J., & Handelsman, J. (2012). Science faculty’s subtle gender biases favoring male students. PNAS, 109, 16474-16479. DOI:10.1073/pnas.1211286109.
- Rimfield, K., Ayorech, Z., Dale, P.S., Kovas, Y., & Plomin, R. (2016) Genetics affects choice of academic subjects as well as achievement. Scientific Reports, 6. DOI:10.1038/srep26373
- Savostina, Smirnova, & Khasbulatova (2017). STEM: Proffesionalniye trayektorii molodezhi (Genderniy aspekt) [STEM: Professional trajectories of the youth (Gender aspect)]. Zhenshina v Rossiiskom obtschestve [Woman in Russian Society], 3(84), 33-44. DOI:10.21064/WinRS.2017.3.3. [in Russian]
- Shakeshaft, N.G. et al. (2016). Rotation is visualization, 3D is 2D: using a novel measure to investigate the genetics of special ability. Scientific Reports, 6.
- Stoet, G., & Geary, D.C. (2013). Sex differences in mathematics and reading achievement are inversely related: Within- and across-nation assessment of 10 years of PISA data. PLoS ONE, 8, e57988.
- Stoet, G., & Geary, D. C. (2015). Sex differences in academic achievement are not related to political, economic, or social equality. Intelligence, 48, 137-151. DOI: 10.1016/j.intell.2014.11.006
- Stoet, G., & Geary, D. C. (2018). The gender-equality paradox in science, technology, engineering, and mathematics education. Psychological science, 29(4), 581-593.
- Su, R., Rounds, J., & Armstrong, P. I. (2009). Men and things, women and people: a meta-analysis of sex differences in interests. Psychological Bulletin, 135, 859–884. DOI:10.1037/a0017364.
- Uttal, D. H., Meadow, N. G., Tipton, E.; Hand, L. L.; Alden, A. R.; Warren, Ch.; & Newcombe, N.S.. (2013). The Malleability of Spatial Skills: A Meta-Analysis of Training Studies. Psychological Bulletin,139(2), 352-402.
- Valla, J. M., & Ceci, S. J. (2014). Breadth-based models of women’s underrepresentation in STEM fields: an integrative commentary on Schmidt (2011) and Nye et al. (2012). Perspectives on Psychological Science, 9, 219-224. DOI:10.1177/1745691614522067.
- Voyer, D., & Voyer, S. D. (2014). Gender differences in scholastic achievement: a meta-analysis. Psychological Bulletin, 140, 1174-1204. DOI:10.1037/a0036620.
- Wai, J., Lubinski, D., & Benbow, C. P. (2009). Spatial ability for STEM domains: Aligning over 50 years of cumulative psychological knowledge solidifies its importance. Journal of Educational Psychology, 101(4), 817.
- Wai, J., Lubinski, D., Benbow, C. P., & Steiger, J. H. (2010). Accomplishment in science, technology, engineering, and mathematics (STEM) and its relation to STEM educational dose: a 25-year longitudinal study. Journal of Educational Psychology, 102, 860-871. DOI:10.1037/a0019454.
- Wai, J., Putallaz, M., & Makel, M. C. (2012). Studying intellectual outliers: Are there sex differences, and are the smart getting smarter? Current Directions in Psychological Science, 21, 382-390. DOI:10.1177/0963721412455052.
- Wang, M-T., & Degol, J.L. (2016) Gender Gap in Science, Technology, Engineering, and Mathematics (STEM): Current Knowledge, Implications for Practice, Policy, and Future Directions. Educational Psychology Review, 29(1), 119-140.
- Wang, M-T., Eccles, J. S., & Kenny, S. (2013). Not lack of ability but more choice: individual and gender differences in STEM career choice. Psychological Science, 24, 770-775. DOI:10.1177/0956797612458937.
- World Economic Forum (2015). The global gender gap report 2015. Geneva, Switzerland: Author.
- Zhenshchiny i muzhchiny Rossii (2016) [Women and men of Russia], Moscow. [in Russian]
Copyright information

This work is licensed under a Creative Commons Attribution-NonCommercial-NoDerivatives 4.0 International License.
About this article
Publication Date
23 November 2018
Article Doi
eBook ISBN
978-1-80296-048-8
Publisher
Future Academy
Volume
49
Print ISBN (optional)
-
Edition Number
1st Edition
Pages
1-840
Subjects
Educational psychology, child psychology, developmental psychology, cognitive psychology
Cite this article as:
Borodaeva, Z., Chipeeva, N., Maslennikova, E., Feklicheva, I., Soldatova, E., Esipenko, E., Sharafieva, K., Ismatullina, V., Malykh, S., & Kovas, Y. (2018). Stem Gender Gap And Intra-Individual Strengths In Maths And Russian Language. In S. Malykh, & E. Nikulchev (Eds.), Psychology and Education - ICPE 2018, vol 49. European Proceedings of Social and Behavioural Sciences (pp. 132-144). Future Academy. https://doi.org/10.15405/epsbs.2018.11.02.15