
Findings Of The National Study For The Preschool Education Quality In Russia


Abstract
The results of the first large-scale independent study of quality of preschool education in Russia are presented. The possibilities that educational environment of a preschool group provide for children are analysed. Data were obtained in 2016-2017 by expert observation with the instrument “Early Childhood Environment Rating Scale - revised edition” and extra expert questionnaire for “adult-child” ratio evaluation. In addition, a questionnaire for the teachers of preschool groups was used. With its help, factors that influence the quality of educational environment and its dynamics are identified. The results of two sample clusters (leaders of local ratings and randomly selected preschools) are compared for each year and between years. The quality of preschool education has improved from 2016 to 2017 (but still it is on the minimum level), regardless of the participation of preschools of the cluster in the study. However, in preschools, which took part in the second year, the quality has changed for the better more significantly than in “newcomers”. Randomly selected preschools showed better quality dynamics than leaders of local ratings. A correlation analysis is made of the dynamics of each preschool participating in the second year and the factors affecting the quality of educational environment. Most factors, such as age of a teacher, his/her experience, professional training program, being familiar with the instrument of evaluation, doesn’t have any significant influence. The awareness of teachers about the results of the assessment significantly influences, and the number of workshops where these results were discussed does not matter.
Keywords: Preschool educationquality assessmenteducational environmentECERSnational study
Introduction
Preschool age is very important period of a child’s development. Early childhood programs influence the whole life (Heckman et al., 2010) and especially a child’s further educational outcomes at school, as discussed by Barnett (1995) and the group of British researchers leading by K. Sylva (Sammons et al, 2015).
Contemporary early childhood education is variable: on one hand, the variability is determined by the diversity in approaches to education of children of different ages and individualization. It is inspired by the desire to take into consideration the characteristics and interests of children in the educational process. On the other hand, there are at the same time general requirements to the quality of preschool education due to modern ideas about educational outcomes and demands of other educational levels.
One of the solutions of this problem is providing the variability of general requirements for the quality of preschool education. It requires the creation of modern approaches to quality assessment.
So, the quality of preschool education should be the subject of particular attention in each country and community.
The problem of preschool education quality assessment in Russia
The Federal Law of Education in Russia, which was adopted in December 2012, and the Federal State Educational Standard for Preschools, which was legalised since September 2014, provide the idea of preschool education quality within three aspects: educational outcomes, the structure of the program and conditions for the program implementation. But children’s outcomes assessment is prohibited for program management purpose. The reason is flexibility of early childhood and unstable frames of age orientations (Zaporozhets, 1978). There are common practices in Russia which use the results of program structure assessment or parental satisfaction as the objective basis for quality management. But this approach doesn’t give the information about process quality which is about 40% of the quality concept, as Tietze discovered (2003). So, there is another – more fruitful, as we consider – way to assess preschool education quality. It is an educational environment evaluation. It helps to find out what kinds of opportunities each child and the whole preschool group get for emotional comfort, health and safety, learning and socialization.
ECERS-R as the main tool for ECE quality evaluation in Russia
The “Early Childhood Environment Rating Scale - revised edition” (ECERS-R) (Harms et al., 2005) was proved as an appropriate instrument for quality assessment in Russia. In 2014-2015 there was an approbation which discovered the distinctive ability of ECERS-R in preschools with objectively high and low quality (Shiyan et al., 2016). ECERS-R became the main tool in the study in Moscow which highlighted the advantages and risk areas of the common approach to preschool education (Remorenko et al., 2017).
Problem Statement
It is important to understand whether there is dynamics in the quality of preschool education in different clusters of Russian preschools, and whether participation in monitoring or any other factors can affect the quality.
Research Questions
-
Is there any dynamics of the quality of education from 2016 to 2017 for the sample of preschools that participate in the study?
Is there any difference in the dynamics of the quality of education between the clusters in general and within the clusters for preschools that participate in the study for the first time and for the second?
Are there any factors which the dynamics of quality of education depends on?
Purpose of the Study
The aim of the study is to determine the specific of the quality range and its dynamics for Russian preschools of two different types – leaders of local ratings and randomly selected ones.
Research Methods
Sample
423 preschools from 40 regions of Russia took part in the study in 2016; and in 2017 – 1301 institutions from 74 regions (approximately 2.6% of all Russian preschools, 87% of territories). 367 preschools participated in both years. The selection of preschools was executed by regional education ministries and expert teams under the project guidelines. 1/3 of the sample was composed of preschools that appeared to be municipal rating leaders (this cluster was nominally named “Best”). The remaining 2/3 of the sample consisted of randomly selected preschools (nominally categorized as “Random”).
Procedure
An observation of educational environment was performed by 155 trained experts. In the “newcomer” preschools one randomly selected class was observed. In the preschools which participated for the second time an expert observed the same class that in 2016. In both cases “children-adults” ratio was additionally examined through the observation. Also, sociometric and professional data about the staff was collected with the help of a questionnaire, such as the teacher’s age, professional experience, the type of the basic professional training program, the involvement in different in-service training programs during the last 3 years, the involvement in collaboration for constructing the curriculum, the age of children the teacher works with, the teacher’s awareness of evaluation criteria and the results of the study in 2016.
The 2017 score of preschools that participated in the study for the first time (Group 1) and for the second time (Group 2) was compared within “Best” and “Random” clusters. It also was compared with the 2016 scores in both clusters (in 2016 all participants belonged to Group 1 – “newcomers”).
The dynamics of each second-time participant was tracking. The preschools which had more than 0,18 score gap were considered to have dynamics, equal or less than 0,18 – no dynamics. This score gap was established according to the precision of comparison which was calculated based on the probable error of expert work that equalled 5%. That amounted to 0.35 from possible 7 scores, i.e. +/- 0.175 scores two-way and rounded to 0.18.
Ethical Considerations
The research was carried out in accordance with Code of Ethics of the Russian Psychological Society.
Findings
Comparison within and between clusters
The 2017 mean of general quality index for education environment amounted to the following: “Best” – 4.05 which is 0.17 points higher than in 2016 (sd = 1.78 with the confidence interval of <X>min=4.00, <X>max=4.09 (p ≤ 0.01)), and “Random”– 3.74 which is 0.37 points higher than in 2016 (sd = 1.68 with the confidence interval of <X>min=3.72, <X>max=3.76 (p≤ 0.01)).
According to the study findings presented in table
According to the figures in table
As table
The hypotheses about the similarity of the Group 1 in 2016 and in 2017 within clusters was tested with Welch Two Sample t-test for predictive confidence intervals. The results are presented in table
As the data in table
The worse score belongs to the subscale “Activities” in both years. In 2016 the mean was on the inadequate quality level, in 2017 it rose up to the minimum level and still is the worse among all subscales. The best score belongs to the subscale “Interaction”. In 2017 it rose up close to the good quality level.
Figure
There is one more common particularity of these two clusters. The analysis of standard deviation (table
“Adult-child” ratio
The “adult / child” ratio indicates that 2 or more adults are simultaneously engaged with children in the cluster “Best” in 41.2% of the total time of educational activity, in the cluster “Random” – in 41.8%. It makes sense to pay attention to this fact because the number of children in preschool groups is rather high: in the cluster “Best” average mean for children which present during an observation is 17.7, in “Random” – 16.5. But the maximum number a centre allows in a group is average 28.1 in the cluster “Best” and 26.6 in the cluster “Random”. Although 59.5% of preschools have more than 25 children in a group, 34.4% have 30-39 children, and 3% - 40 children or more (even up to 51 in “Random” and 55 in “Best”).
But the correlation analysis indicates no significant correlations between the general quality index and the involvement of 2 or more adults: in the cluster “Best” R=0.072, in the cluster “Random” R=0.052.
Dynamics of the 2016 and the 2017 scores in each preschool
56.60% of the preschools improved their general quality index with more than 0.18 points. The index of 23.40% of preschools did not change, and in 20% it decreased. Some items were identified as the most often improved, such as “Math/numbers”, “Discipline”, “Child-related display”, “Art” and so on. There were some items which changed very seldom, such us “Provisions for children with disabilities”, “Provisions for professional needs of staff”, “Promoting acceptance of diversity”, “Provisions for personal needs of staff”, “Supervision and evaluation of staff”, “Nap/rest”, “Indoor space” and so on.
The correlation analysis of factors which might affect the dynamics of the quality indicates that there are no significant correlations with the teacher’s age, professional experience, the type of the basic professional training program, the involvement in different in-service training programs, the involvement in collaboration for constructing the centre curriculum, the age of children the teacher works with and even the teacher’s awareness of evaluation criteria. But rather stable correlations between positive dynamics of the majority of subscales and the intervention with teachers were discovered (Rmin=0.189; Rmax=0.315). As we can see on figure
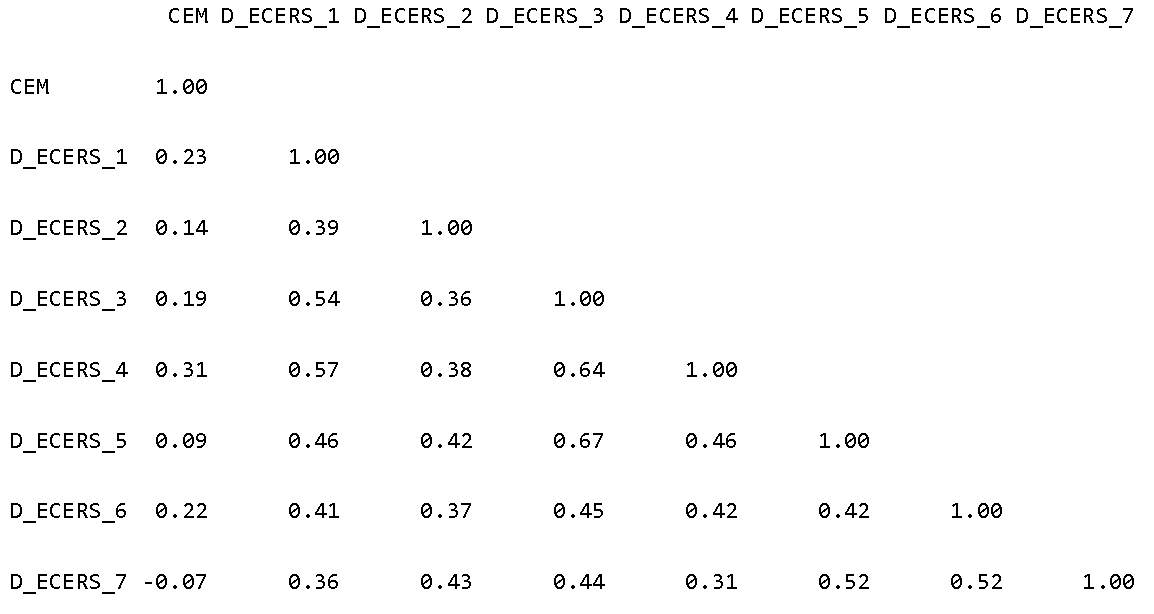
The intervention with teachers differs much. In some preschools the teachers whose classes were observed in 2016 didn’t know the evaluation scores. In some preschools the staff took part in workshops after the study but not the teacher who participated in the assessment. In some preschools the teacher took part in one workshop where the evaluation scores were discussed. And in the rest, there were several workshops with discussion of evaluation scores in which the teacher took part.
Thus, the dynamics of preschool groups in which the teacher took part in discussion of 2016 evaluation scores is better than in groups with minimum intervention or without it. E.g. the subscale “Activity”: no intervention – dynamics equalled -0.4 – 0.23, intervention without the teacher – dynamics equalled -0.27 – 0.47, intervention with score discussion once – dynamics equalled 0.31 – 0.83, intervention with score discussion several times – dynamics equalled 0.38 – 0.82.
Conclusion
Comparison within and between clusters
Preschools from both clusters that participated for the second time performed in 2017 better than the “newcomers” which provides the assumption about positive influence of such participation itself on ECE quality. The cluster “Random” increased the mean of general quality index for education environment more than the cluster “Best”. It indicates that the leaders of local ratings are less open to new experience or that they are already close to the maximum level of quality they can get in current situation.
The 2016 confidence intervals range for preschools in the cluster “Random” did not overlap with the 2017 range for the “newcomers” in the same cluster. It supports the assumption of a tendency towards improvement of preschool education quality irrespective of participation in the study.
The 2017 ranges of confidence intervals of “newcomers” and second-time participants did not overlap which allows regarding these groups as different
An analysis of the results on subscales discovers a general trend towards improving the quality of preschool education.
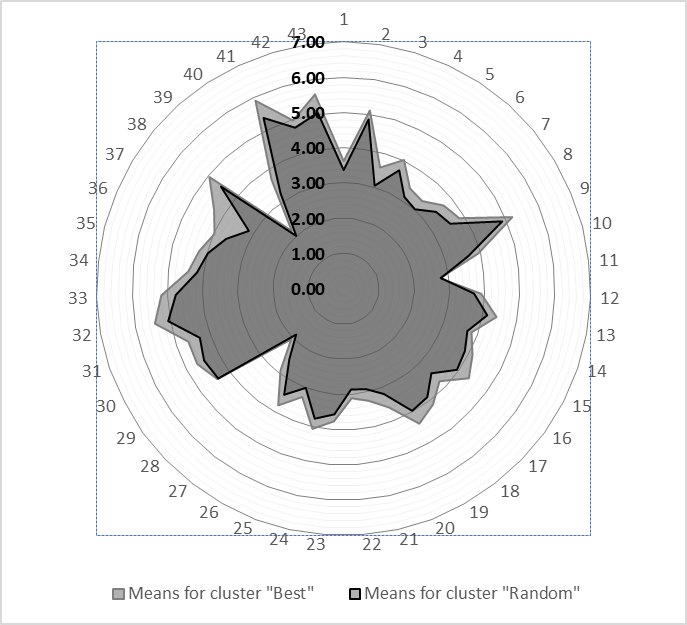
An analysis of the results on items in comparison of the two clusters presents some similarity of the quality profiles.
On the basis of the data obtained, it can be assumed that in the system of preschool education there is a general tendency to improve the quality of the educational environment, to make the social situation of development more child-oriented and personalized.
The fact of participation in the study proved to be a factor which stimulates the improvement of the quality. It means that the low scores on items are useful for the development of quality and, presumably, influence the formation of reflectiveness of the teachers.
A group of items with a low standard deviation indicates that the preschools in the sample turned out to be little different from each other. In this case, it means either the established norms of professional consciousness (the item “Provisions for children with disabilities”, etc.), or regulatory documents that do not allow the environment to be more flexible and child-oriented (e.g. “Nap/rest”). The study makes available for the authorities and principals the important data that allows them to carry out appropriate strategies in different areas of improving the educational environment.
“Adult-child” ratio
“Adult-child” ratio is not a significant factor which affects the quality of ECE in general, but it needs to be studied in every type of educational activities. It presumably can give different correlations.
Dynamics of the 2016 and the 2017 scores in each preschool
The teachers’ awareness of the assessment outcomes plays a significant role for positive dynamics, while the number of workshops did not influence it.
Acknowledgments
The authors are grateful to the Federal Service for Supervision in Education and Science for the initiative to conduct the study and the funding, the regional ministries for their assistance in organizing the study and the experts for the data collection work.
References
- Barnett, W. S. (1995). Long-term effects of early childhood programs on cognitive and school outcomes. Future of Children, 5(3), 25–50. DOI: 10.2307/1602366
- Harms, T., Clifford, R. M., & Cryer, D. (2005). Early Childhood Environment Rating Scale. Revised Edition. New York, NY, London, England: Teachers College Press.
- Heckman, J. J., Moon, S. H., Pinto, R., Savelyev, P. A., & Yavitz, A. (2010). The rate of return to the HighScope Perry Preschool Program. Journal of Public Economics, 94(1-2), 114-128. DOI: 10.3386/w15471
- Remorenko, I. M., Shiyan, O. A., Shiyan, I. B., Shmis, T. G., Le-van, T. N., Kozmina, Y. Y., & Sivak, E. V. (2017). Key problems of implementation of FES of preschool education based on the results of the study using the “Early Childhood Environment Rating Scale. Revised Edition (ECERS-R)”: “Moscow-36”. Modern preschool education, 2 (74), 16–31. [in Russian].
- Sammons, P., Toth, K., Sylva, K., Melhuish, E., Siraj, I., & Taggart, B. (2015). Preschool and early home learning effects on A-level outcomes. Effective Preschool, Primary & Secondary Education Project (EPPSE). [Research report from https://www.gov.uk/government/uploads/system/uploads/attachment_data/file/472867/RR472A_Preschool_and_early_home_learning_effects_on_A_level_outcomes.pdf]. Oxford, England: University of Oxford.
- Shiyan, I. B., Zadadaev, S. A., Le-van, T. N., & Shiyan, O. A. (2016). Approbation of Scales of preschool quality assessment ECERS-R in kindergartens of Moscow. The Bulletin of the Moscow City Pedagogical University. Pedagogy and Psychology, 2 (33), 77–92. [in Russian]
- Tietze, W., Viernickel, S., & Groot-Wilken B. (2003). Pedagogical quality in day care centers for children: A national catalogue of criteria. Weinheim, Germany: Beltz. [in German]
- Zaporozhets, A. V. (1978). The Importance of Early Childhood Periods for the Formation of Childhood Personality. In Ancyferova L. I. (Ed.). The Principle of Development in Psychology (p. 243–266), Moscow, Russia: Science [in Russian]
Copyright information

This work is licensed under a Creative Commons Attribution-NonCommercial-NoDerivatives 4.0 International License.
About this article
Publication Date
13 July 2018
Article Doi
eBook ISBN
978-1-80296-042-6
Publisher
Future Academy
Volume
43
Print ISBN (optional)
-
Edition Number
1st Edition
Pages
1-694
Subjects
Child psychology, developmental psychology, child care, child upbringing, family psychology
Cite this article as:
Shiyan, I., Zadadaev, S., Le-van, T., & Shiyan, O. (2018). Findings Of The National Study For The Preschool Education Quality In Russia. In S. Sheridan, & N. Veraksa (Eds.), Early Childhood Care and Education, vol 43. European Proceedings of Social and Behavioural Sciences (pp. 602-610). Future Academy. https://doi.org/10.15405/epsbs.2018.07.80