
Managing the Endurance Effort to Water Polo Players - Juniors III


Abstract
Water polo combines swimming and ball handling. Swimming uses 15.7-20.0 kilocalories per minute, more than any other form of physical activity. The complexity of the game divides the effort, for the field players, into 50-60% aerobic effort, 30-35% anaerobic lactic effort and 10-15% anaerobic alactic effort. Knowledge of the respiratory quotient, as a metabolic response to exercise, depends on the type of energy substrate used (carbohydrates, lipids or proteins), being particularly important for the correct diagnosis and management of higher aerobic effort in the training of athletes. Hypothesis: Using the respiratory quotient parameter to analyse the anaerobic threshold provides information on the correctness of preparation in the pre-established effort zone. Methods: The research is focused on the ascertaining pedagogical experiment with a single variable. Results: Data from the anaerobic threshold assessment reveal that: for the respiratory quotient, the mean value in basal metabolism is 1.04, and after exercise, it reaches 1.11; for the lactic acid, the mean value in basal metabolism is 2.27mmol, and after exercise, it reaches 8.29mmol. Conclusion: The preparation of junior athletes in their clubs was not done correctly, because, for this effort zone, they should have used the lipid metabolism as an energy supplier, not the carbohydrate one – the research hypothesis is validated
Keywords: Water polorespiratory quotientanaerobic thresholdendurance
Introduction
The game of water polo combines swimming and ball handling. Swimming uses 15.7-20.0 kilocalories per minute, more than any other form of physical activity (Wilmore & Costill, 2004, p. 148). The complexity of the game divides the effort, for the field players, into 50-60% aerobic effort, 30-35% anaerobic lactic effort and 10-15% anaerobic alactic effort (Smith, 1988, p. 331). It has been noticed that elite male water polo players have approximately 6 to 20% greater oxygen consumption than competitive swimmers (Smith, 1988, p. 328). Total swimming distance of elite male players during a water polo game ranges between 1,500 and 1,800m (Hohman & Frase, 1992, p. 316). The blood lactate values recorded in competition by water polo players range between 8 and 10mmol/L (Wilmore and Costill, 2004, p. 273). Data presented by specialists in the field reveal that the game of water polo falls, from a metabolic point of view, within the higher aerobic effort zone (VO2max), with anaerobic penetrations. Given the high percentage of aerobic work performed during a water polo game, this type of effort can be addressed very similarly to swimmers’ training in the anaerobic threshold zone (endurance/higher aerobiosis), where volumes ranging between 4,000 and 6,000m per day are used to train this system (Snyder, 2008, p. 19). Maximal aerobic capacity and endurance depend on the oxidation of energy substances; it is difficult to measure these items, because they are largely dependent on the available amount of lipids stored in the body (Guedj, Brunet, Girardier, & Moyen, 2006, p. 43); as to the oxidative metabolism of lipids, it depends on the amount of oxygen supplied. That is why the methodical stimulation of higher aerobic metabolism uses the concept of “aerobic threshold” in the training of athletes (Marinescu, 2003, p. 57). Contrary to the wrong ideas of coaches specialized in sports games, martial arts, gymnastics etc. (acyclic efforts), who claim that the training within metabolic effort zones only matches the cyclic sports disciplines, ergo-physiologists show that the mixed-type training (VO2max at the central level and peripheral AA) is mandatory, because it stimulates both the higher aerobiosis zone and the anaerobic alactic zone, including the amino acid metabolism; these are intensity exercises from 1.2 to 1.4 of submaximal VAM, and the AA lasts between 5 and 15 sec. at maximal intensity, the duration of active recovery being equal to or less than that of the exercise (Guedj et al., 2006, p. 46). We present the new concept cited above to support the idea that improving the anaerobic threshold zone and VO2max is particularly important, because it also prepares the anaerobic effort zones. We mention, in close connection with the research, that the performance in endurance activity relies on the following factors: a high VO2max, a high anaerobic threshold and a high economy of effort, which means a low VO2max for the same exercise intensity. Knowledge of the respiratory quotient (non-protein QR – the protein nitrogen is non-oxidizing), as a metabolic response to exercise, depends on the type of energy substrate used (carbohydrates, lipids or proteins), being particularly important for the correct diagnosis and management of higher aerobic effort in the training of athletes. We highlight that the metabolic zone of anaerobic threshold is more important in training than the metabolic effort zone with maximal oxygen consumption (Maglischo, 1982, p. 281). As an argument in our research, we used a specific test for the anaerobic threshold zone (20 x 50m free style), with a start every 50”).
Materials and methods
Premises
our research starts from the premise that there is a one-to-one relationship between respiratory quotient and anaerobic threshold, which provides valuable information for training the higher aerobiosis zone. Water polo coaches do not use this information to conduct endurance effort within metabolic zones and do not know the importance of the relationship between respiratory quotient and anaerobic threshold. The respiratory quotient value allows deducing the nature of the oxidized energy substrates; R = 0.70 indicates that the lipid substrate has been used during exercise (which is correct for the endurance effort/anaerobic threshold), and R ≥ 1-1.4 shows that the glycolytic substrate has been used in the endurance work, which is not effective in terms of the metabolic cost for sustaining the effort.
Purpose
to determine the respiratory quotient values in the specific endurance effort and to establish the energy substrate used to sustain the effort.
Hypothesis
using the respiratory quotient (R) parameter to analyse the anaerobic threshold provides information on the correctness of preparation in the pre-established effort zone.
The research subjects
are 20 athletes, basic players of two water polo clubs enrolled in the National Championship (“Steaua” School Sports Club 3 and “Emil Racoviță” Sports College). There were tested athletes in the 1997 age group; the test used to assess the anaerobic threshold zone (20 x 50m free style, with a start every 50”) was carried out on 17.12.2013 at the swimming pool within the Sports Complex of Izvorani.
Research methods
the research is focused on the ascertaining pedagogical experiment with a single variable. The test used aimed to assess the anaerobic threshold zone (20 x 50m free style, with a start every 50”). Mathematical and statistical methods: arithmetic mean, standard deviation, Pearson correlation coefficient, coefficient of determination (r2) and graphical representation (Popa, 2008, p. 164).
Description of the test and equipment used:
-
Anaerobic threshold assessment: the test (20 x 50m free style, with a start every 50sec.) consists in covering (by swimming) the distance of 50m free style, after a preliminary specific warm-up. This distance is repeated 20 times in a single series. The exercise is performed with a start every 50sec., and the break between repetitions is about 5-10sec., depending on the athletes’ level of preparation. The work intensity ranges between 80-90% of VO2max, and the duration of this test is about 17min.;
-
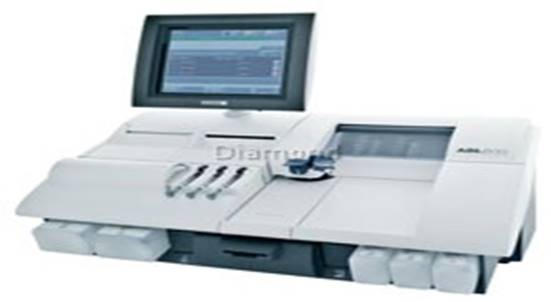
Equipment used to take blood samples: at that time, we were having a partnership with the National Institute for Sports Research (INCS) of Bucharest, represented by Mr Dorel Tocitu, PhD Researcher, who used the automatic blood gas analyser ABL835 to measure blood samples taken from the finger pulp under basal conditions, after various training stimuli and/or at different post-exercise recovery times (Ticală, 2015, p. 158).
-
Biochemical parameters measured:
-
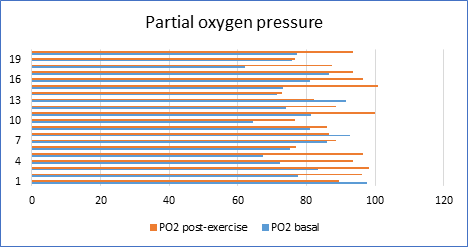
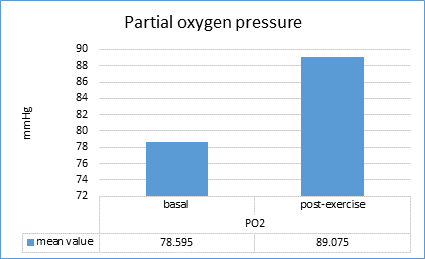
pO2 is the partial oxygen pressure in a gas phase in equilibrium with the blood and signifies the level of oxygen uptake by the lungs;
-
pCO2 is the partial pressure of carbon dioxide in a gas phase in equilibrium with the
-
blood. It is measured in mmHg. This parameter is a direct reflection of the relationship between metabolic rate and pulmonary ventilation;
-
R (respiratory quotient) – during exercise, it shows the metabolic cost, and under basal conditions, it shows whether there is a balance between the respiratory and muscular systems; R = VCO2/VO2 = 1;
-
LA – lactate is an extremely important indicator for assessing the predominant type of energogenesis during physical exercise and, depending on the concentration reached, it helps to assess the endurance capacity of the body.
-
Results
Table
For the pO2 parameter, the mean value recorded in basal metabolism is 78.595 mmHg, with a minimum value equal to 62 mmHg and a maximum value equal to 97.6 mmHg; standard deviation is ±9.346 mmHg, and the coefficient of variation is equal to 11.89% mmHg, which integrates the results recorded for this parameter into a relatively homogeneous group. During exercise, the recorded mean value is 89.075 mmHg, with a minimum value equal to 72.9 mmHg and a maximum value equal to 101 mmHg; standard deviation is ±8.432 mmHg, and the coefficient of variation is equal to 9.46% mmHg, which integrates the results recorded for this parameter into a homogeneous group. The PO2 values ranging between 80-100 mmHg are considered as normal values, and those lower or higher than these limits indicate an acid-base imbalance. (Table
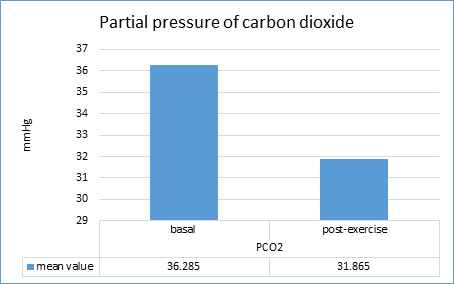
For the pCO2 parameter, the mean value recorded in basal metabolism is 36.285 mmHg, with a minimum value equal to 29.6 mmHg and a maximum value equal to 45.6 mmHg; standard deviation is ±3.939 mmHg, and the coefficient of variation is equal to 10.85% mmHg, which integrates the results recorded for this parameter into a relatively homogeneous group.
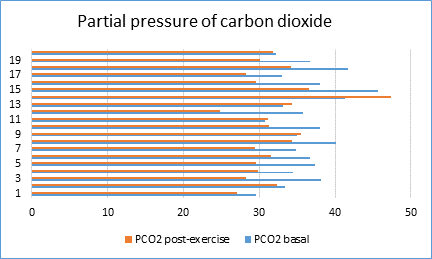
During exercise, the recorded mean value is 31.865 mmHg, with a minimum value equal to 24.8 mmHg and a maximum value equal to 47.4 mmHg; standard deviation is ±4.680 mmHg, and the coefficient of variation is equal to 14.68% mmHg, which integrates the results recorded for this parameter into a relatively homogeneous group. The pCO2 value in venous blood is 45 mmHg, and in arterial blood, 40 mmHg; these are considered as normal values (Table
As regards the evolution of R (respiratory quotient), the mean value recorded in basal metabolism is 1.04, with a minimum value equal to 0.96 and a maximum value equal to 1.16; standard deviation is ±0.04, and the coefficient of variation is equal to 3.84%, which integrates the results recorded for this parameter into a homogeneous group.
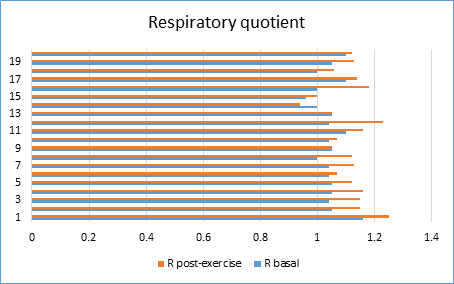
During exercise, the recorded mean value is 1.11, with a minimum value equal to 0.94 and a maximum value equal to 1.25; standard deviation is ±0.07, and the coefficient of variation is equal to 6.30%, which integrates the results recorded for this parameter into a homogeneous group. The value 0.94 is the only case that indicates the involvement of lipid metabolism in the metabolic support of the anaerobic threshold effort, while the values exceeding 1.1-1.2 etc. show that the energy substrate used during exercise is supported by glucose or glycogen. (Table

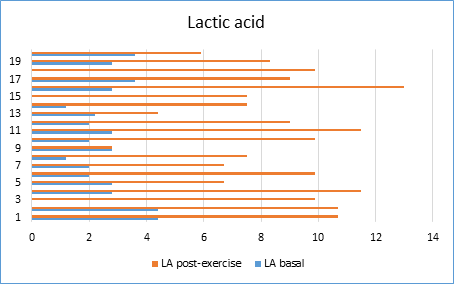
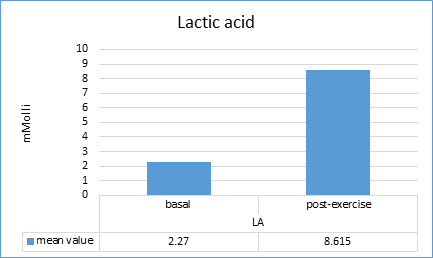
As regards the evolution of LA (lactic acid) parameter, the mean value recorded in basal metabolism is equal to 2.27 mMolli, with a minimum value equal to 0 mMolli and a maximum value equal to 4.4 mMolli; standard deviation is ±1.304 mMolli, and the coefficient of variation is equal to 57.26% mMolli, which integrates the results recorded for this parameter into a non-homogeneous group. During exercise, the recorded mean value is 8.294 mMolli, with a minimum value equal to 2.8 mMolli and a maximum value equal to 13 mMolli; standard deviation is ±2.529 mMolli, and the coefficient of variation is equal to 30.48% mMolli, which integrates the results recorded for this parameter into a non-homogeneous group. The mean value recorded for this parameter is 8.294 mMolli; it results that the metabolic cost of the performed effort is much higher than required by the metabolic zone of anaerobic threshold (4-6 mMolli). (Table

The Pearson coefficient of correlation (r) between the values of respiratory quotient (R) and lactic acid (LA) shows a moderate degree of association, r = 0.488 (Table
The effect size value is high; the coefficient of determination (r2) shows that the dispersion of each of the two parameters is influenced by the other parameter in a proportion of 23.8% (Table
Discussions and conclusions
Improving the anaerobic threshold is perhaps the most important training adaptation to increase performance in the endurance effort, may be even more important than improving maximal oxygen consumption (VO2max);
Improvement of the anaerobic threshold reflects the increases in VO2max, indicates a reduction in the production of acid lactic in active muscles and an increase in the elimination of lactic acid;
Knowing the respiratory quotient (R) indicates if the respiratory system is able to correctly sustain the exercise intensity with a metabolic cost appropriate to the performed effort and provides valuable information for zoning the metabolic effort;
As regards the respiratory quotient (R) assessment after an anaerobic threshold effort, the arithmetic mean R = 1.11 demonstrates that, in the investigated athletes, the energy substrate for sustaining the effort is the glucose or glycogen, and not the lipid substrate, as would have been correct for this higher aerobiosis zone – the research hypothesis is confirmed;
Analysis of the anaerobic threshold in terms of lactic acid (LA) correlated with the respiratory quotient (R), r = 0.488, has revealed that the athletes did not master the pace and rhythm specific to the metabolic effort zones. Also, knowing the values of the two parameters (R and anaerobic threshold) demonstrates that it is possible to achieve a scientific management of the training effort;
The lactic acid value, LA = 8.294, proves that the athletes respond to the anaerobic threshold effort through an effort intensity corresponding to the VO2max metabolic zone, which indicates the inadequacy of their training;
Water polo athletes do not master the pace and rhythm specific to the metabolic effort zones and coaches do not understand the importance of interdisciplinary knowledge for the scientific management of sports training.
References
- Guedj, E. B., Brunet, B., Girardier, J., & Moyen, B. (2006). Médicine du sport (7e édition). Paris: Masson.
- Hohman, A., & Frase, R. (1992). Analysis of swimming speed and energy metabolism in competitive water polo games (Swimming Science VI: Biomechanics and Medicine in Swimming). London.
- Maglischo, E. W. (1982). Swimming faster. USA: Mayfield Publishing Company.
- Marinescu, Gh. (2003). Nataţie – efort şi antrenament. Bucureşti: Bren.
- Popa, M. (2008). Statistică pentru psihologie – Teorie și aplicații SPSS (Ed. a II-a). Iași: Polirom.
- Ticală, L. (2015). Diagnoza capacității de efort la jucătorii de polo pe apă – juniori III (Teză de doctorat). UNEFS, București.
- Snyder, P. (2008). Water polo and teachers of aquatics. USA.
- Smith, H. (1988). Applied physiology of water polo. Sports Medicine.
- Wilmore, J., & Costill, D. (2004). Physiology of sport and exercise (3rd edition). Leeds: Human Kinetics.
Copyright information

This work is licensed under a Creative Commons Attribution-NonCommercial-NoDerivatives 4.0 International License.
About this article
Publication Date
05 March 2018
Article Doi
eBook ISBN
978-1-80296-035-8
Publisher
Future Academy
Volume
36
Print ISBN (optional)
-
Edition Number
1st Edition
Pages
1-484
Subjects
Sports, sport science, physical education, health psychology
Cite this article as:
Marinescu, G., Ticală, L. D., Rădulescu, A., Hoanță, D., & Dulceață, V. (2018). Managing the Endurance Effort to Water Polo Players - Juniors III. In V. Grigore, M. Stanescu, & M. Paunescu (Eds.), Physical Education, Sport and Kinetotherapy - ICPESK 2017, vol 36. European Proceedings of Social and Behavioural Sciences (pp. 166-176). Future Academy. https://doi.org/10.15405/epsbs.2018.03.22