
Organization And Analysis Of Psychological And Pedagogical Research Of The Score-Rating System


Abstract
Genetics represents the fastest developing discipline in the history of scientific enquiry. Genetic advances have implications for individuals and society, including matters related to law, ethics, education, medicine and philosophy. As such, it will be important for all people to be able to engage with genetic research, not just at the point that it becomes personally applicable, such as in medical treatment, but also more generally across many social domains. Given the ever-increasing impact of genetics on daily life, it is important to have a tool to evaluate what people know, think and feel about genetics and for this tool to be applicable across society. Previous studies have mainly focused on genetic literacy in medical domains with less attention paid to other applications. They have also largely focused on well-defined populations, such as undergraduate students and young adults. To overcome these limitations of previous research in this area, a consortium of psychologists, geneticists, lawyers, educationalists and ethicists have developed the International Genetic Literacy and Attitudes Survey (iGLAS). This paper presents the development, piloting and validation of this instrument. The resulting iGLAS provides a flexible, informative and quick tool for evaluating public knowledge and perceptions of genetics. In particular, it provides a tool that can be used across all demographics, allowing for tailored research with specific groups of interest.
Keywords: Public understanding of geneticsgenetic knowledgegenetic literacyvalidation
Introduction
We live in an era of advanced and advancing genomics research (Collins, 2010). It now takes approximately 30 minutes and less than $1000.00 to sequence an entire genome of a person. As the price and time for genetic testing continue to reduce, market forces suggest that whole genome sequencing will become routine practice for screening for genetic conditions in new born infants (Berg et al., 2017). Routine sequencing will also allow for identification of many more single mutation disorders that could be nullified or partially managed through environmental manipulations. Additionally, it will also reveal a great deal of probabilistic information about each person’s physical, educational, emotional and psychological development.
With the rate of genomic sequencing increasing, people will need to become genetically literate. Genetic literacy is a common term within the literature and has been defined as “sufficient knowledge and appreciation of genetic principles to allow informed decision-making for personal well-being and effective participation in social decisions on genetic issues” (Bowling et al., 2008). For example, genetic literacy would mean a good grasp of the concept of heritability. Heritability is a population based statistic estimating the relative influences of genetic factors on complex traits such as personality, physical and mental health, and education. Quantitative genetic studies, using twin, adoption and other family designs, have found all complex human traits to be heritable to some degree. For example, school achievement is substantially heritable, with genetic differences accounting for approximately 60% of the variation among primary school students (e.g., Kovas et al., 2013).
Genetic literacy also means understanding how an individual’s DNA sequence provides probabilistic predictive information about behaviour and health. With increasing computer processing power and the cost of genomic sequencing reducing, greater precision has become possible. A recently introduced Genome-wide Polygenic Scoring (GPS) technique allows for thousands of genotyped markers in a person’s DNA to be aggregated together to predict different traits. For example, in a recent study using this method, DNA information alone could explain 10% of the variation in school achievement of high school students (Selzam et al., 2017). Further research using GPS is likely to achieve even greater predictive power in many domains (Spiliopoulou et al., 2015).
Genetic literacy also includes understanding that for all complex traits, genetic variability within a population is so vast that two randomly selected individuals within a population can be more genetically different from each other than two randomly selected individuals from two diverse populations (Jorde & Wooding, 2004; Witherspoon et al., 2007). Moreover, any differences within and between populations can be due to environmental and/or genetic differences. For example, genetically identical orchids will thrive in a hothouse, but not in the desert; it is the environment that explains the differences in these populations, not genetics. As such, observed population differences at the phenotypic level cannot automatically be attributed to genetic differences between these populations. However, this concept seems to be poorly understood and is likely to be the source of much resistance to genetic research in areas such as education and intelligence.
The need to be genetically literate therefore extends beyond the medical domain and has relevance in many other areas, including education, law, social policy and philosophy. If genomic sequencing becomes routine, many important questions will need to be addressed. For example, who should have access to genomic data? Should parents be faced with vast amounts of probabilistic information about their new born child? Should the state have access to this information? What if something is indicated in a DNA test that a child might not want other people to know, such as the likelihood of their sexual preferences? Such questions are pressing, particularly as deciphering the genome is far from being complete. We know more today than we did yesterday, and will know considerably more tomorrow. As such, decisions about genetic testing not only relate to what is known now, but to potential future knowledge emerging during a lifetime.
Such information also rarely pertains just to the individual being tested. Genetic relatedness between family members invariably means that an individual’s decision to have their genome sequenced will have implications for family members. Discovery of a rare genetic disorder in one individual increases the chances of that condition being found in family members. For example, if someone finds out that they have a genetic disorder, are they morally and/or legally obliged to share this information with their siblings? In May 2015, a pregnant woman found out via her hospital that her recently deceased father had Huntington’s disease; a debilitating genetic condition that results in the death of brain cells, with symptoms usually beginning between the ages of 30 and 50. Huntington’s is an autosomal dominant condition (Dayalu and Albin, 2015), with a 50% risk for the child of inheriting the disease if just one of their parents has the condition. In this case, the woman’s father had refused to let doctors inform her of his condition, as he worried that she may commit suicide or terminate her pregnancy. However, his diagnosis was released to the daughter accidentally. Her own screening then revealed that she too would develop Huntington’s disease. The woman reported that she would have terminated her pregnancy had she been notified of the risk in time. She attempted to sue the National Health Service in the UK for not disclosing this information about her father, but a High Court Judge ruled that her case had no chance of success and struck it out (Dyer, 2015). Such issues will become significantly more common as genetic testing becomes more routine.
Further questions arise as genetic testing can be done just a few days after conception, with preimplantation genetic diagnosis becoming more routine in fertility treatments (Sermon et al., 2004). If such screening becomes routine for natural conception, then conditions such as Cystic Fibrosis, Huntington’s disease, Phenylketonuria and Sickle Cell Anaemia could theoretically be eradicated within a few generations. Whilst eradication may seem to be a desirable outcome, eradicating genetic diseases will likely result in complications. For example, people with Sickle Cell disease are resistant to malaria, as are carriers of the sickle cell trait (Eichner, 2007). Furthermore, many genes are pleiotropic - they influence a number of different traits. One recent study has identified a genetic variation in East Asians that is known to protect from coronary heart disease, but to increase risk for age related macular degeneration (Cheng et al. 2015). Certain traits, that are usually conceptualised in disease terms, such as Schizophrenia (Horrobin, 2001), would be selected against in successive generations if they were solely detrimental. However, such traits persist, suggesting some possible evolutionary advantage. Most importantly, genetic variation is essential for evolution, with reduction in variation in a species hindering its ability to adapt to dramatic changes in the environment.
The ability to select for and against traits therefore presents ethical and practical dilemmas. If parents select for traits they feel will be beneficial to their children, might this limit the diversity and richness of society? If parents decide to continue with a pregnancy of a child who will require extensive and expensive health care for the entirety of their life, should they be allowed to and should the state have to pay for that care? Should the child be allowed to sue their parents for not terminating the pregnancy, or selecting for better traits? Finally, will everyone be able to afford genetic tests and have access to the relevant advice, guidance and genetic counselling? Will healthcare and educational establishments be sufficiently resourced to use this information beneficially for individuals?
As a first step towards addressing the multitude of genetics related issues, it is necessary to evaluate the level of genetic literacy and attitudes towards genetics across the population.
Problem Statement
Previous studies of genetic literacy have mainly focused on genetic literacy in medical domains/personal well-being, with less attention paid to other applications of genetics (e.g. Erby, Roter, Larson, & Cho, 2008; Hooker et al., 2014; Hott et al., 2002; Molster, Charles, Samanek, & O’Leary, 2008; Pearson & Liu-Thompkins, 2012; Saul, 2013). They have also largely focused on well-defined populations such as undergraduate students and young adults (Carver et al., 2017; Fitzgerald-Butt et al., 2016). This research is limited, as it does not provide a comprehensive picture of genetic literacy in the population. Therefore, more comprehensive assessment instruments are required to capture the different aspects of genetic knowledge and its application across different socio demographic groups. The ultimate goal of this research is to aid the development of training and information tools to improve people’s genetic literacy. This will allow people to: become more engaged with important genetic developments; make informed decisions about their own health and that of their family; and engage in social debates about how genetic information should be stored, accessed and used in various domains such as law, education and society.
Research Questions
To overcome limitations of previous research, a consortium of psychologists, geneticists, lawyers, educationalists and ethicists (The Accessible Genetics Consortium – TAGC) have developed the International Genetic Literacy and Attitudes Survey (iGLAS). iGLAS has been designed to evaluate what people know, think and feel about genetics and its multiple applications, including law, ethics, education and medicine. iGLAS is designed for population-wide administration, including different ages, occupations and education levels. iGLAS has multiple applications, including to identify: areas in which people have poor genetic knowledge; potential differences in knowledge across different demographic groups; and sources of information and misinformation and their impact on people’s knowledge and opinions.
Purpose of the Study
The present study has two major aims: (1) to develop, pilot and validate the international population-wide assessment instrument – the International Genetic Literacy and Attitudes Survey (iGLAS); and (2) to make iGLAS available as a resource for research and educational purposes.
Research Methods
Development of the iGLAS instrument began in April 2015, as a collaborative venture between behavioural geneticists, psychologists, educationalists, lawyers and ethicists. These experts met to discuss issues related to applications of genetics and genetic communication. The collaboration led to the identification of key areas to be assessed by iGLAS, including knowledge related to differences within and across populations; gene/environment interplay; and determinism. The collaborative team then worked on compiling a list of specific items to be included in the instrument, leading to 81 initial items, grouped into: 28 items on genetic knowledge (GK); 8 items on heritability estimates; 17 items on opinions/attitudes; and 28 items on demographics.
Genetic Knowledge: Each member of the focus group was asked to supply questions that they felt would evaluate a reasonable (non-specialist) level of genetic knowledge. As the survey was to be disseminated online, questions had to be in a multiple-choice format with 1 correct and up to 3 incorrect options. All items were evaluated and any duplicates were combined into a single item. This resulted in 28 initial items assessing Genetic Knowledge (GK). Previous research established 6 main and 43 sub concepts as benchmarks of genetic content for non-major courses in the USA (Hott et al., 2002). As shown in table
1 , each of the items selected to measure GK in the first iGLAS pilot were mapped onto these 6 main concepts.
Many of the concepts established in previous research (e.g., Hott et al., 2002; Bowling et al., 2008) discuss genetics in medical and pathological (disease) terms. iGLAS is intended to also capture public perception and understanding of the more behavioural and sociological aspects of genetics, which to date have been poorly studied. As can be seen from table
It was decided not to include “don’t know” options for the GK questions in iGLAS. Research has indicated that inclusion of a “don’t know” option can encourage participants to disengage from a study (Oppenheim, 2000). Additionally, when pressed, participants answer at an above chance level even if they do not think they know the correct answer (Mondak and Davis, 2001).
With a multiple choice format, it is expected that score ranges will be restricted as participants are provided with only limited options for their responses. For example, a multiple-choice question with 4 options will be right 25% of the time, even if answers are given randomly.
After several phases of screening, the first version of iGLAS was implemented using Qualtrics software (Qualtrics, Provo, UT). The validation then proceeded in 3 stages: Pilot 1 (iGLAS-P1), Pilot 2 (iGLAS-P2) and a test-retest analysis (iGLAS-P3).
Findings
Pilot 1: iGLAS-P1
iGLAS-P1 was disseminated on line, primarily through social media (e.g. Facebook). Participants had to be 18 years or older, with no upper age limit. Participation in this pilot was restricted to those who had at least a degree level qualification.
The following occupations were represented: 7 university lecturers; 38 university students; 14 parents; 2 primary care givers; 5 legal practitioners; 4 medical practitioners; 5 teachers; 8 government employees. Participants could select more than one option, so respondents may have been both parents and university lecturers, for example. This item was found to be too restrictive and so was addressed for iGLAS-P2. A section focusing on careers was included in iGLAS-P2. Several broad categories were presented to participants, with the option to add their own specific job role. To identify parents, participants were also asked if they had any children, and if so, if any of them were under the age of 16. The majority of the remaining demographic information was retained unchanged in iGLAS-P2. However, the item about ethnicity was excluded from iGLAS-P2, as it was felt this may alienate some participants, particularly given the sometimes-contentious relationship between genetics and race in previous literature (e.g. Herrnstein & Murray, 1996).
Level of Education: The categories used in iGLAS-P1 were selected as suitable for UK participants. For iGLAS-P2 these were revised to be more internationally applicable. Categories were added for pre-school certificate and tertiary education (further education in the UK, continuing education in the USA). Postgraduate education was subdivided into masters, doctoral and post-doctoral categories, resulting in 7 educational categories in iGLAS-P2.
One item in iGLAS-P1 (“In which country did you grow up”) was judged by the participants to be vague. Instead, two separate items were included in iGLAS-P2. “In which country did you receive your secondary education” and “What is your current country of residence”.
Based on the results of iGLAS-P1 and feedback from participants, for the question about sources of guidance, additional options were added for iGLAS-P2: “Seek Religious Guidance” and “Refer to self-help literature”.
In iGLAS-P1 items related to religiosity, spirituality and political ideology were represented on slider scales. Participants who opted not to answer these items would have had responses recorded as zero, which would have indicated a meaningful score. To eradicate possible complications related to this, skip logic was added to iGLAS-P2, so that participants could opt out of answering questions about religion, spirituality and politics. The item on which popular science topics participants are interested in was shown to provide little useful data within the scope of iGLAS, and so was removed from iGLAS-P2. The question about confidence to discuss science topics participants did not feel they were experts in was also removed from iGLAS-P2, as it could not be corroborated with actual scientific knowledge.
Analysis was conducted on the pilot data to see if the GK scores fitted a single factor model. A Root-mean-square Error of Approximation (RMSEA) of 0.084 (90% confidence intervals 0.048 – NA) indicates a poor fit to a single factor model; a value of .06 or less is indicative of an acceptable model (Brown, 2015). Further, a parallel factor analysis revealed potentially 5 factors in the data, when compared to simulated data. Therefore, the questions included in iGLAS-P1 do not support any underlying factorial structure.
As a single factor model did not fit the data, neither McDonald’s Omega nor Cronbach’s Alpha could be used to evaluate the internal reliability of the measure. Instead, an evaluation of the items, based on the responses, was conducted in consultation with several behavioural genetics experts. Guiding principles in the selection and refinement of items were clarity of language and precision of items. Another consideration was utility of knowledge: items aimed to evaluate how equipped participants are to discuss genetics in a meaningful way, rather than evaluate their knowledge of complex genetic, genomic and epigenetic processes.
For iGLAS-P2 16 items were removed (see table in Appendix 1 for justifications); 3 items were retained unchanged; 11 items were rephrased for clarity and to reflect that iGLAS-P2 would be conducted internationally; and 4 new items were added. This resulted in 18 GK items.
For 3 items (IQ, Motivation and Sexuality), responses included the full range of heritability estimates, suggesting these items may be quite divisive and that some participants saw these traits as either entirely genetic or entirely environmental.
For iGLAS-P2 it was felt that the term “heritability” was too easy to misinterpret. Therefore, the principle question in this section was reworded to: “On a scale of 0-100 how important are genetic differences between people in explaining individual differences in the following traits:” For clarity, sexuality was reworded to sexual orientation. To allow comparison with heritability estimates in the scientific literature, depression was more specifically defined as clinical depression.
It was felt that having all items in this section on the same scale (1-7) would increase the chance of common method variance (Lindell and Whitney, 2001). Where appropriate to the question, some scales were altered and a marker variable, specifically intended to address common method variance was included: Second language learning should be mandatory throughout compulsory education. For iGLAS-P2 3 items were retained unchanged; 6 were rephrased for clarity (including one item being split in two); 5 items were removed; and 5 new items were added. These additional items included two vignettes intended to evaluate how people think genetics should be used in court cases and how influential they believe genetic influences are in the perseverance of violent tendencies in the absence of environmental influences (see table in Appendix 1). These vignettes were included to make iGLAS more engaging and thought provoking.
iGLAS-P2 was disseminated online via social media (e.g., https://facebook.com, https://vk.com and https://www.reddit.com/r/AMA). Participants were also recruited through an undergraduate research participation scheme at the University of London, with 112 students completing iGLAS-P2 at the same time on 17/11/2016.
From the free text option in the careers section it was evident that an option for Engineering, Computing and ICT was missing, and this was added to the final version of iGLAS.
1785 participants were parents: 936 had one child; 642 had 2 children; and 207 had 3 or more children. 1462 parents reported having children under the age of 16; 329 reported that their children were not under the age of 16; giving a total of 1791. Therefore, 6 participants did not report having children, but then reported the age of their children. Skip logic was applied to the final version of iGLAS, so that participants were only asked how many of their children were over 16 if they selected yes to having children.
With the exception of the item asking participants whether they might seek guidance from a psychic (Skew = 2.44, Kurtosis = 5.68), all opinion items showed suitably normal distributions. All items were retained in the final iGLAS.
Analysis was conducted to see if the GK scores from iGLAS-P2 fitted a factor model. A Root-mean-square Error of Approximation (RMSEA) of .034 (90% confidence intervals 0.032 – 0.036) suggested a good fit to a plausible model. However, when compared to 20 simulations of random data, Eigenvalues suggest loadings onto 7 factors. As such, the questions included in iGLAS-P2 do not support any underlying single factor to genetic knowledge. This is to be expected, as GK is likely to represent a diverse knowledge base rather than a unitary construct, especially for those who have not specifically studied genetics. For example, parents may have a better understanding of genetic relatedness in siblings than non-parents, but are no more likely to be able to identify the base units of DNA.
A whole range of responses emerged for heritability of all traits, with importance of genetic factors rated from 0 to 100% (see Table
All heritability items were included unchanged in the final iGLAS.
The first of these items was included to evaluate how likely participants are to engage with personal medical genetics. This is thought to be a key question in relation to engagement with genetics and so was retained for the final iGLAS. The item related to scientific development was excluded from the final iGLAS.
In iGLAS-P2 one item was included to evaluate Common Method Variance: Second language learning should be mandatory at school. This item was selected as it was thought to have no theoretical correlation with the other opinion items. However, it showed significant correlation with 13 items at <.05, indicating that this item was not performing to task. Alternatives were considered, such as the inclusion of several items asking respondents to select a designated response so that demand characteristics could be evaluated. However, iGLAS is intended to be a quick and accessible measure of genetic knowledge and opinions, and inclusion of several such items would be too disruptive in such a short measure. To reduce the effects of common method variance, iGLAS uses varied presentations of questions: multiple choice, Likert and slider scales.
Two items from the GK section of iGLAS-P2 and iGLAS-P3 were combined into a single item. Participants’ ability to answer the question ‘On average, how much of the variable DNA is the same in siblings?’ was dependent on their ability to answer the prior question ‘What is variable DNA’. Instead, the following single item was included in the final version of iGLAS: All humans differ in the amount of DNA they share. How much of this differing DNA do siblings usually share?. The final iGLAS measure therefore consists of 17 genetic knowledge questions. The test-retest evaluation suggested that simply completing iGLAS does not lead to significant increases in genetic knowledge. To make iGLAS more attractive and useful to participants, it was decided to provide feedback for each of the GK items in iGLAS, as well as an overall GK score - directly on completion of the questionnaire. This feedback not only includes information about whether the participant’s response was correct, but also some additional information about the concept being assessed through that item.
The two vignettes were removed from the opinions section of the Final version of iGLAS and presented separately. Two additional items were added to the final iGLAS opinions section: I believe that genetic manipulation, such as gene editing, should be allowed for the prevention and treatment of disease and I believe that genetic manipulation, such as gene editing, should be allowed so that people can improve themselves and / or their children. These items were included after further consultation with genetic experts as it was felt that previous versions of iGLAS did not cover these important topics.
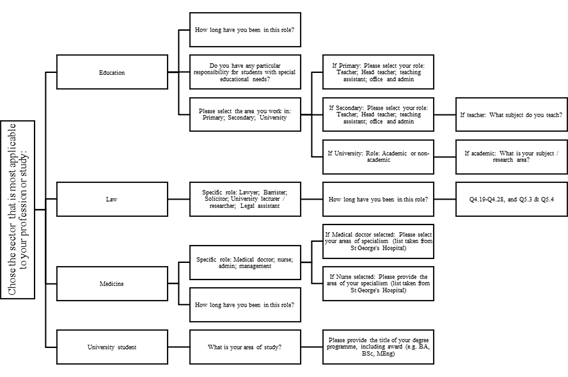
To be able to investigate certain groups further, the final iGLAS includes additional items for selected occupations: Law, Education and Medicine. These more in-depth assessments add additional 2-5 minutes to the total testing time. Further items can be added to explore other groups of interest in-depth. Display logic was employed so that such items would only be presented to participants who had identified the appropriate career. For example, if a participant identifies their career as “education”, they are then presented with questions about their specific role, with teachers being asked whether they work in primary or secondary school and their years of employment as a teacher. Secondary school teachers are then asked which subject(s) they teach, but primary school teachers are not. Details of this tailoring, which can be added to as research develops, can be found in Figure
The demographic section of the final iGLAS consists of 14 base questions. Parents are asked to identify how many of their children are under the age of 16. The opinions section of iGLAS consists of 17 items, of which 15 were retained from iGlAS-P2. The following 2 items were added after consultation with experts in legal and ethical genomics, both assessed on a 7-point Likert scale from Strongly disagree to Strongly agree: (1)
The final iGLAS is designed for flexible use, by adding items tapping into knowledge or opinions of specific groups of interest. For example, we developed a version of iGLAS that focuses on ethical and legal implications of genetics. This version is currently being tested with participants who identify their career as “Law”, who complete several additional items and vignettes. Further developments of iGLAS can include additional specific items for other career paths of interest, such as medicine and education. Specified career paths also include additional demographic items as indicated in Figure
Conclusion
The present study was intended to develop a tool for evaluating the general public’s awareness of genetics. iGLAS does not just focus on medical applications, as has often been the case in previous studies, but also assesses general and social applications of genetics. iGLAS also evaluates what people think and feel about genetics and personal genomics. The genetic knowledge section of iGLAS provides a quick and usable evaluation of what people understand about genetic concepts that are necessary for engagement in contemporary debate. The opinions section of iGLAS covers a broad array of contemporary issues and the demographic details allow for useful stratification, so that appropriate interventions and educational tools can be used for different groups (e.g., professionals, students). The provision of an overall genetic knowledge score and feedback on each item should help participants learn from their engagement with this study and improve their ability to engage in genetics research and debates.
The flexibility of iGLAS is its particular strength. Previous studies on public engagement with genetics have targeted specified populations, most often undergraduate students and young adults. iGLAS can be applied effectively to diverse populations. In addition, it allows for tailoring, to enable research with specific groups, including those previously poorly represented. The design of iGLAS also accommodates new adaptations in response to rapid advances in genetic research and related societal issues.
Using iGLAS
The final version of iGLAS is available here: https://goldpsych.eu.qualtrics.com/jfe/form/SV_0oG9w9iDMrJ9l2t
iGLAS is free to use and is available on request from the authors. We welcome collaborations, including adaptations to other languages and joint data analyses.
To cite iGLAS, reference this paper and include the following link: https://goldpsych.eu.qualtrics.com/jfe/form/SV_0oG9w9iDMrJ9l2t
Acknowledgments
This work is supported by the Ministry of Education and Science of the Russian Federation within the project No. 25.8663.2017/9.10
References
- Berg, J. S., Agrawal, P. B., Bailey, D. B., Beggs, A. H., Brenner, S. E., Brower, A. M., … Wise, A. L. (2017). Newborn Sequencing in Genomic Medicine and Public Health. Pediatrics, e20162252.
- Bowling, B. V., Acra, E. E., Wang, L., Myers, M. F., Dean, G. E., Markle, G. C., … Huether, C. A. (2008). Development and Evaluation of a Genetics Literacy Assessment Instrument for Undergraduates. Genetics, 178(1), 15–22.
- Carver, R. B., Castéra, J., Gericke, N., Evangelista, N. A. M., & El-Hani, C. N. (2017). Young Adults’ Belief in Genetic Determinism, and Knowledge and Attitudes towards Modern Genetics and Genomics: The PUGGS Questionnaire. PLOS ONE, 12(1), e0169808.
- Cheng, C.-Y., Yamashiro, K., Chen, L. J., Ahn, J., Huang, L., Huang, L., … Wong, T. Y. (2015). New loci and coding variants confer risk for age-related macular degeneration in East Asians. Nature Communications, 6, ncomms7063.
- Collins, F. S. (2010). The Language of Life: DNA and the Revolution in Personalized Medicine (1 edition). New York: Harper.
- Dayalu, P., & Albin, R. L. (2015). Huntington Disease. Neurologic Clinics, 33(1), 101–114.
- Dyer, C. (2015). Woman with gene for Huntington’s disease fails in attempt to sue her father’s doctors for failing to alert her. BMJ, 350, h2864.
- Eichner, E. R. (2007). Sickle Cell Trait. Journal of Sport Rehabilitation, 16(3), 197–203.
- Erby, L. H., Roter, D., Larson, S., & Cho, J. (2008). The rapid estimate of adult literacy in genetics (REAL-G): A means to assess literacy deficits in the context of genetics. American Journal of Medical Genetics Part A, 146A(2), 174–181.
- Fitzgerald-Butt, S. M., Bodine, A., Fry, K. M., Ash, J., Zaidi, A. N., Garg, V., … McBride, K. L. (2016). Measuring genetic knowledge: a brief survey instrument for adolescents and adults. Clinical Genetics, 89(2), 235–243.
- Herrnstein, R. J., & Murray, C. (1996). Bell Curve: Intelligence and Class Structure in American Life (1st Free Press Pbk. Ed edition). New York: Simon & Schuster Ltd.
- Hooker, G. W., Peay, H., Erby, L., Bayless, T., Biesecker, B. B., & Roter, D. L. (2014). Genetic Literacy and Patient Perceptions of IBD Testing Utility and Disease Control: A Randomized Vignette Study of Genetic Testing. Inflammatory Bowel Diseases, 20(5), 901–908.
- Horrobin, D. F. (2001). The Madness of Adam and Eve: How Schizophrenia Shaped Humanity. London ; New York: Bantam Press.
- Hott, A., Huether, C., McInerney, J., Christianson, C., Fowler, R., Bender, H., … Karp, R. (2002). Genetics Content In Introductory Biology Courses For Non-Science Majors: Theory And Practice. Bioscience, 1024–1035.
- Jorde, L. B., & Wooding, S. P. (2004). Genetic variation, classification and ‘race’. Nature Genetics, 36,
- Kovas, Y., Voronin, I., Kaydalov, A., Malykh, S. B., Dale, P. S., & Plomin, R. (2013). Literacy and Numeracy Are More Heritable Than Intelligence in Primary School. Psychological Science, 24(10), 2048–2056.
- Lindell, M. K., & Whitney, D. J. (2001). Accounting for common method variance in cross-sectional research designs. Journal of Applied Psychology, 86(1), 114–121.
- Molster, C., Charles, T., Samanek, A., & O’Leary, P. (2008). Australian Study on Public Knowledge of Human Genetics and Health. Public Health Genomics, 12(2), 84–91.
- Mondak, J. J., & Davis, B. C. (2001). Asked and Answered: Knowledge Levels When We Will Not Take “Don’t Know” for an Answer. Political Behavior, 23(3), 199–224.
- Oppenheim, A. N. (2000). Questionnaire Design, Interviewing and Attitude Measurement. Bloomsbury Publishing.
- Pearson, Y. E., & Liu-Thompkins, Y. (2012). Consuming Direct-to-Consumer Genetic Tests: The Role of Genetic Literacy and Knowledge Calibration. Journal of Public Policy & Marketing, 31(1), 42–57.
- Plomin, R., DeFries, J. C., Knopik, V. S., & Neiderhiser, J. M. (2016). Top 10 Replicated Findings From Behavioral Genetics. Perspectives on Psychological Science, 11(1), 3–23.
- Saul, R. A. (2013). Genetic and Genomic Literacy in Pediatric Primary Care. Pediatrics, 132(Supplement 3), S198–S202.
- Selzam, S., Krapohl, E., von Stumm, S., O’Reilly, P. F., Rimfeld, K., Kovas, Y., … Plomin, R. (2017). Predicting educational achievement from DNA. Molecular Psychiatry, 22(2), 267–272.
- Sermon, K., Van Steirteghem, A., & Liebaers, I. (2004). Preimplantation genetic diagnosis. The Lancet, 363(9421), 1633–1641.
- Spiliopoulou, A., Nagy, R., Bermingham, M. L., Huffman, J. E., Hayward, C., Vitart, V., … Haley, C. S. (2015). Genomic prediction of complex human traits: relatedness, trait architecture and predictive meta-models. Human Molecular Genetics, 24(14), 4167–4182.
- Witherspoon, D. J., Wooding, S., Rogers, A. R., Marchani, E. E., Watkins, W. S., Batzer, M. A., & Jorde, L. B. (2007). Genetic Similarities Within and Between Human Populations. Genetics, 176(1), 351–359.
Copyright information

This work is licensed under a Creative Commons Attribution-NonCommercial-NoDerivatives 4.0 International License.
About this article
Publication Date
13 December 2017
Article Doi
eBook ISBN
978-1-80296-032-7
Publisher
Future Academy
Volume
33
Print ISBN (optional)
-
Edition Number
1st Edition
Pages
1-481
Subjects
Cognitive theory, educational equipment, educational technology, computer-aided learning (CAL), psycholinguistics
Cite this article as:
Vyzhigin, A. Y. (2017). Organization And Analysis Of Psychological And Pedagogical Research Of The Score-Rating System. In S. B. Malykh, & E. V. Nikulchev (Eds.), Psychology and Education - ICPE 2017, vol 33. European Proceedings of Social and Behavioural Sciences (pp. 472-481). Future Academy. https://doi.org/10.15405/epsbs.2017.12.50