
Enhancing The Reliability Of Measurements And Evaluations Based On Service Quality Models


Abstract
Problem statement: The application of different service quality measurements and evaluations in higher educational context and the utilization and reliability of results are examined. Research questions: What are the difficulties in the measurement and evaluation of specific service quality dimensions? How can the reliability of such service quality measurements be enhanced? Purpose of the study: This paper introduces the application and the results of a student satisfaction questionnaire based on fuzzy Likert scale used for evaluating lecturers’ performance at the Budapest University of Technology and Economics. Research methods: In order to capture and accurately measure the diversity, subjectivity and imprecision inherent to students’ evaluations, a methodology based on fuzzy numbers having sigmoid membership functions has been proposed. By applying the principles of Dombi’s Pliant Arithmetics, the evaluations can be aggregated and statistically analysed in a convenient way. Findings: Fuzzy-numbers based questionnaires result in a more precise reflection of human thinking and judgement. The Pliant Arithmetic-based approach allows us to aggregate the parameters of the left and right hand sides of the fuzzy number separately. This property results in a much simpler statistical analysis of the gathered data than the methods previously proposed in the literature. Conclusions: The proposed methodology can be utilized in two ways. It can either be applied to identify lecturers’ strengths and weaknesses in order to develop their teaching skills or to compare and analyse various students’ evaluations. The results can serve as a base for establishing teaching regulations and discovering best practices as well.
Keywords: Service qualityLikert scalefuzzy approach
Introduction
Nowadays, tertiary institutions are being called to account for the quality of educational services that they provide. While more accountability in higher education is desirable, the tools and mechanisms for its achievement are part of a hot debate in the relevant literature. The following questions naturally arise when it comes to the assessment of higher educational services. How can higher education (HE) institutions assess the quality of educational services they offer? How can they know reliably whether the expectations of customers and stakeholders of HE, primarily of students are met or not? If HE institutions wish to answer the previously addressed questions, they need suitable monitoring procedures and reliable methodologies to evaluate service quality and to identify the appropriate measure units to evaluate the achieved service performance level (Lupo, 2013, De Battisti et al., 2005; 2010) as HE services cannot be controlled or measured by classical measuring techniques and conventional measure units.
Measuring service quality and the satisfaction of stakeholders including students in HE is mainly realized through the application of Likert scales. The widely applied service quality models in HE including SERVQUAL (De Oliviera et al., 2009; Yousapronpaiboon, 2014), SERVPERF (Bayraktaroglu and Atrek, 2010; Brochado, 2009) and HEdPERF (Abdullah, 2005, 2006a, 2006b) are all based on 7-point Likert scales that vary from 1 (strongly disagree) to 7 (strongly agree) using different service quality domains. Measuring satisfaction in case of most HE stakeholders and peer evaluations are also based on the utilization of the traditional Likert scale (Gruber et al., 2010; Douglas and Douglas, 2006; Liu and Carless, 2006).
Problem Statement
Over the past decades there has been a trend toward fostering ratings with different data sources of teaching performance which could serve and broaden the evidence base used to evaluate courses and assess the quality of teaching. To serve this purpose, our Faculty has developed an internal quality enhancement system in order to further develop its teaching programs and practices in the academic year 2015/2016. Based on the relevant literature and taking international practices into consideration, a semester-long peer review of teaching program has been launched at the Faculty. The questionnaires applied to evaluate lecturers’ classroom performance include the observation of lectures, midterm tests and/or exams. Since the students’ satisfaction is highly dependent on the methods used to evaluate their performance during the semester, the peer review program has also been completed by the evaluation of midterm tests and exams by students right after the midterm test or exams (besides the aforementioned end of the term course evaluations). This kind of feedback is of high importance not only from the observed lecturer’s, but from the faculty’s point of view as well. The questionnaires filled out both by peer reviewees and students consist of two main parts: a numerical scale assessment in case of which most of the aspects of the lecturer’s performance is evaluated using a traditional Likert-scale and there is a second part standing for narrative comments. Despite the advantages of the peer review program and the positive feedbacks coming from the participants, three main problems of student feedbacks have been found that can affect the reliability of results originating from the process of peer reviewing, namely, the uncertainty inherent among the evaluations, the variation of lecturers’ performance within the semester and the lack of methods available to compare different students’ narrative evaluations.
Research Questions
Recent literature argues that the use of Likert scales reduces the subtlety of human perceptions as individuals can hardly use an exact number to express their opinion about a given situation. As an alternative, linguistic assessment is preferred to represent that specific numerical value (Herrera and Herrera-Viedma, 2000; Herrera et al., 1999; Kacprzyk, 1986; Chen, 2001). In order to consider human perceptions, the fuzzy set theory is increasingly applied in these situations as they improve successfully the reliability of service process measurements and evaluations.
In designing questionnaires concerning variables which cannot be directly measured by means of exact numerical values but can be graded to some extent (like perceived service quality, satisfaction, perception, attitude), commonly employed scales are Likert ones. It is a discrete scale by choosing the most appropriate ‘values’ within a class according to the rater’s judgement, opinion, valuation (Gil and González-Rodríguez, 2012) and lead to ordinal data from a set of pre-fixed categories. When Likert-type data are analysed for statistical purposes, the techniques to analyse them are quite limited (Lubiano et al., 2016). Different studies have been carried out to discuss the reliability of the analysis of these responses pointing out that increasing the number of responses results in an increase of information and reliability (Lozano et al., 2008).
Rating items in a questionnaire can be considered as a complex task (Jonessen, 2000) as raters make multiple decisions under uncertainty. Likert-type scales have several weaknesses and do not ease the task of the rater (Jamieson, 2004; Carifio and Perla, 2007). The number of ‘values’ to choose from is small (Gil and González-Rodríguez, 2012) which means that the variability, diversity and subjectivity associated with an accurate rating is usually lost. Another disadvantage originates from the fact that when values are encoded by their relative position in accordance with a certain ranking, differences between codes cannot be interpreted as differences in their magnitude. It means that only statistical conclusions addressed to ordinal data can be reliable and relevant information can be lost (Lubiano et al., 2016). To some extent the ideal solution would be increasing the number of choices, but it cannot be achieved by using a natural language (Sowa, 2013). If the aim is to exploit individual differences in responding to questionnaires, there is a need for a rich and expressive scale in “something can be meaningful although we cannot name it” (Ghneim, 2013). To manage these disadvantages there is an alternate approach which takes into account that the nature of most attributes concerning evaluations, judgements involve subjectivity and certain imprecision. One of our research questions arose here: Is it possible from methodological point of view to handle the aforementioned problems in our peer evaluation program by alternate approaches?
Hesketh et al. (1988) proposed the fuzzy rating scale without respondents being constrained to choose among a few pre-specified questions. This kind of scale has the ability to model the imprecision of human rating evaluations, formalize them mathematically, to ‘precisiate’ them in a continuous way, and to develop mathematical computation with them (de Sáa et al., 2015; Calcagní and Lombardi, 2014; Gil and González-Rodríguez, 2012). This approach leads to a fuzzy-valued response format enabling a variability and accuracy which would not be captured when using a Likert scale. The fuzzy-scale is rich and expressive enough to find a value in it fitting appropriately the valuation, opinion, judgement involving subjective perceptions in most real life situations. Fuzzy rating scales have been intensively applied in higher education context to measure quality related issues (see e.g. Basaran et al.,2011; Lalla et al., 2005; Yu et al., 2016; Lupo, 2013; Liu et al., 2015; Venkatesan and Fragomeni, 2008). Based on the relevant literature the next research issue was addressed by applying a fuzzy-scale in case of student evaluations in the framework of the peer review program and analyze the benefits of fuzzy scales compared to traditional Likert scales.
Purpose of the Study
Since students are the most important stakeholders of higher education and they are those who have direct interactions with the lecturers, they are considered to be the most reliable source of information regarding quality assessments. Some problems arise in connection with student satisfaction measurement. Usually, students take into account their relationship with the lecturer when judging teaching quality, even if the goal of this measurement is to gain objective information. The own opinion of students is strongly influenced by others and students tend to express a “common opinion” on quality. The third problem inherent in student evaluations is the contrasting perceptions as time goes on. Students have quite different feelings right after the midterm test, after getting to know their results and after successfully passing the course, that is, their judgement on teaching quality is continuously reconsidered. All of the three factors lead to different but parallel existing perceptions and opinions. Moreover, the performance of a lecturer is often unbalanced and fluctuates during the lecture or as the semester goes on. In these situations, it could be quite difficult to choose a single number which can depict the performance. If respondents are constrained to choose a given number on a traditional Likert scale, it could be assumed that this number will represent an average performance during the whole lecture or regarding all dimensions along which lecturers’ performance are evaluated. This average performance is seldom representative and not always sufficient enough to identify strengths and weaknesses. Moreover, the retrospective statistics including the mean, the range and the standard deviation computed based on these evaluations are more likely to reflect the differences between the various students’ judgements than the variability of the lecturer’s performance.
Narrative comments are of high importance and kindly welcomed from the lecturers’ points of view. They emphasize the evidence on which students base their evaluations and the selection of lecturers’ strengths and weaknesses. They can reflect the variability of the observed lecturer’s performance or the contrasting perceptions of students as well. On the contrary, these narrative comments are difficult to analyse and the lack of simple methods to deal with linguistic feedbacks led to an insufficient elaboration of these kinds of feedbacks. It means that by comparing and evaluating different lecturers’ performance based only on the numerical assessment, a remarkable part of the information gained is either lost or is not taken into account, which cannot serve the purposes of the Faculty as a whole.
This paper focuses on a challenging problem which is related to how to handle properly the inherent uncertainty of human perceptions. Namely, we illustrate new ways to interpret and analyse fuzzy data coming out from a special case of survey, the so-called fuzzy rating scale-based questionnaire applied in the peer review program at our Faculty to evaluate lecturers’ teaching performance. The proposed fuzzy Likert scale can help to overcome the aforementioned difficulties. This approach can help to deal with vagueness arising either from uncertainty of the students or from the fluctuation of the observed lecturer’s performance. By providing a fuzzy Likert scale to evaluate the lecture, students can express their uncertainty, their contrasting perceptions and the variability of the observed lecturer’s performance in a quantitative way. The more the uncertainty associated with the judgement and the more unbalanced the observed lecturer’s performance are, the more spread out the fuzzy number is. Following Dombi's Pliant Inequality Model (Dombi, 2009) and Theorem 1, introduced in Section
Research Methods
In the followings the theoretical background of the proposed methodology is shortly discussed.
Fuzzy Numbers as Intersections of Two Soft Inequalities
In our approach, the values on a Likert-scale are represented by fuzzy numbers; that is, instead of expressing an opinion by selecting a particular x crisp value on the scale, we allow the evaluator to select an “approximately x“ value that is given by a fuzzy number. We will use sigmoid functions to compose the membership functions of fuzzy numbers.
where and is nonzero.
The main properties of the sigmoid function are as follows.
Range. The range of is the interval
Continuity. is continuous in
Monotony.
If , then is strictly monotonously increasing
If , then is strictly monotonously decreasing
Limits.
,
Role of parameters.
Parameter is the locus at which has the value 0.5
The slope of at is ; that is, the parameter determines the gradient of function curve at
Figure
Definition 2. The Dombi intersection of the fuzzy sets and that are given by the membership functions and , respectively, is the fuzzy set with membership function :
where , , , and denotes the Dombi intersection operator.
If we apply the Dombi intersection to and with , we get
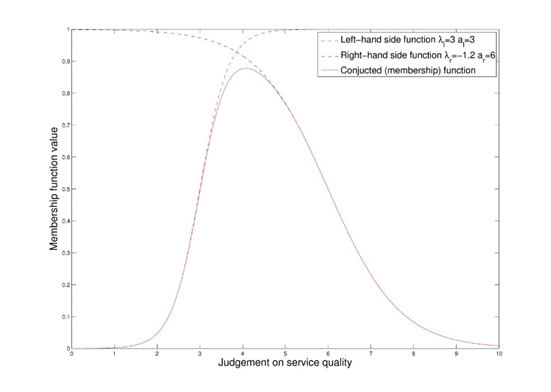
Utilizing Definition 1 we get:
Figure
Proof. See Dombi (2009).
The parameters and of the sigmoid function can be unambiguously given by determining two points of the function curve. The sigmoid function neither takes the value 0, nor the value 1, these are its limits. In practical applications, it may be useful if the function is given by two points which have vertical coordinates close to 0 and 1. Let be a small positive value, for example , and ,
If we wish to take the values of and at and , respectively, the parameters and need to be set as follows:
,
where .
This approach enables us to represent the “approximately ” value by the parameter triple . Namely, “approximately ” can be given as the Dombi intersection of the increasing sigmoid fuzzy membership function and the decreasing sigmoid fuzzy membership function , where
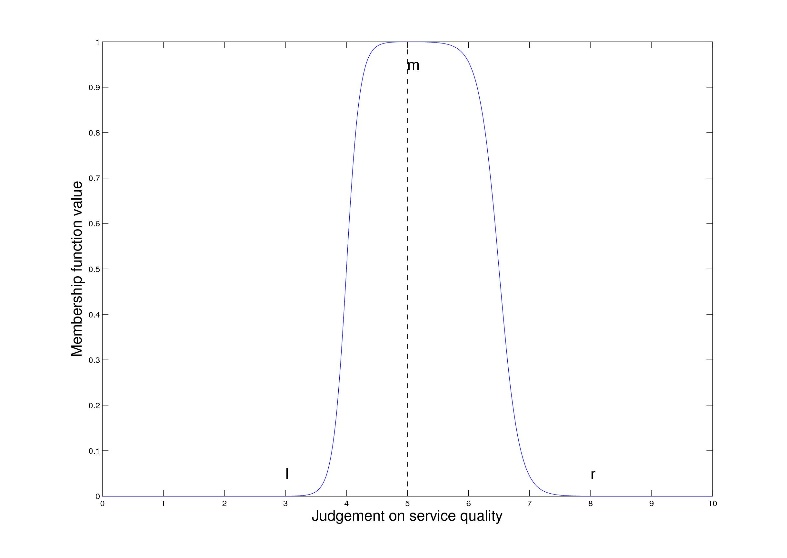
Figure
Findings
Figure
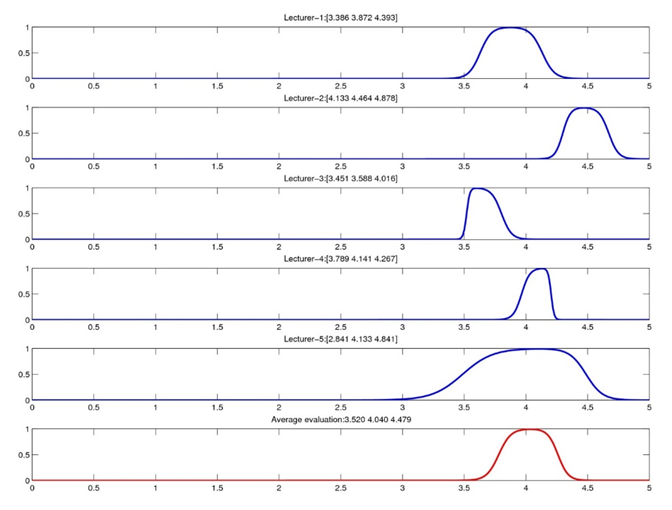
In case of Lecturer 1 altogether 12 students have been asked to use the fuzzy Likert scale to evaluate the lecturer’s performance. Figure
Table
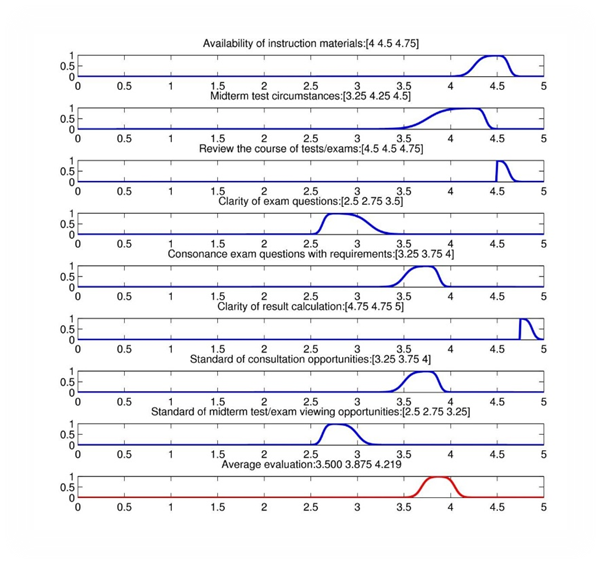
It can be concluded that the centre of the fuzzy numbers representing the most probable response and the mean of the crisp evaluations do not differ significantly. The width and the location of the 95% confidence interval of the expected value of the crisp evaluation usually coincides with the fuzzy evaluation; however, in case of average crisp evaluations, that are estimated based on a larger sample, the confidence interval becomes tighter. It should be emphasized, however, that there is no mathematical connection between fuzzy and crisp evaluations; while fuzzy evaluations represent a possibilistic, crisp judgements appear for a probabilistic approach.
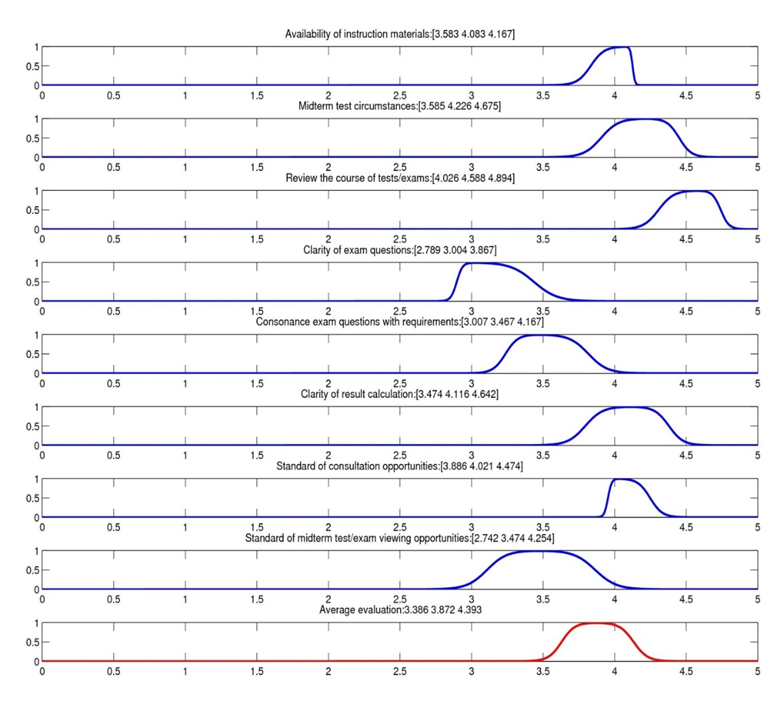
Similar to Lecturer 1, the average performance in each dimension have been computed for the other 4 lecturers as well. Based on those evaluations, the average performance of the lecturers is shown in Figure
Conclusion
The evaluation of service quality conducted either by students, peer reviewers or other stakeholders is mainly realized by the application of Likert-scales. Likert-scales are easy-to-use, however, when utilized to judge service quality, there are some shortcoming as they are not able to reflect subjectivity and certain imprecision inherent to personal judgements. A viable alternative technique by giving an answer to the problems arising from the application of Likert-type scales can be a fuzzy rating scale that is rich and expressive enough to find a value fitting approximately the judgement of raters. By applying Dombi’s Pliant Inequality Model, the gained responses can be statistically analysed in a convenient way.
The usefulness of fuzzy rating scales has been demonstrated through the application a fuzzy Likert-scale to evaluate lecturers’ performance in the peer review process launched at Budapest University of Technology and Economics, Faculty Economic and Social Sciences. The proposed methodology can express both the uncertainty in the evaluation of the reviewees and the variability of the reviewed colleague’s performance during a single lecture in a quantitative way. The computed average evaluations based on the Pliant Inequality Model can foster the Faculty to compare different lecturers’ performance more reliably and to identify best practices as well. Based on the results and due to the simple application, the suggested method may be considered as a new, viable technique. Besides peer evaluation, the application of the presented methodology arises in evaluations where Likert-type scales are applied traditionally, namely e.g. in the case of student satisfaction, job satisfaction, employee satisfaction measurement.
Acknowledgments
The presentation of this paper at the 8th ICEEPSY Conference has been supported by Pallas Athéné Domus Animae Foundation.
References
- Abdullah, F. (2005), “HEdPERF versus SERVPERF: The quest for ideal measuring instrument of service quality in higher education sector”, Quality Assurance in education, Vol. 13, No. 4, pp.305-328.
- Abdullah, F. (2006a), “Measuring service quality in higher education: HEdPERF versus SERVPERF”, Marketing Intelligence & Planning, Vol. 24, No.1, pp.31-47.
- Abdullah, F. (2006b), “The development of HEdPERF: a new measuring instrument of service quality for the higher education sector”, International Journal of Consumer Studies, Vol. 30, No. 6, pp.569-581.
- Başaran, M.A., Kalaycı, N. and Atay, M.T. (2011), “A novel hybrid method for better evaluation: Evaluating university instructors teaching performance by combining conventional content analysis with fuzzy rule based systems”, Expert Systems with Applications, Vol. 38, No. 10, pp.12565-12568.
- Bayraktaroglu, G. and Atrek, B. (2010), “Testing the superiority and dimensionality of SERVQUAL vs. SERVPERF in higher education”, The Quality Management Journal, Vol. 17, No. 1, pp.47-59.
- Brochado, A., (2009), “Comparing alternative instruments to measure service quality in higher education“, Quality Assurance in Education, Vol. 17, No. 2., pp.174-190.
- Calcagnì, A. and Lombardi, L. (2014), “Dynamic Fuzzy Rating Tracker (DYFRAT): a novel methodology for modeling real-time dynamic cognitive processes in rating scales”, Applied Soft Computing, Vol. 24, pp.948-961.
- Carifio, J. and Perla, R.J. (2007), “Ten common misunderstandings, misconceptions, persistent myths and urban legends about Likert scales and Likert response formats and their antidotes”, Journal of Social Sciences, Vol. 3, No. 3, pp.106-116.
- Chen, T.C. (2001), “Applying linguistic decision-making method to deal with service evaluation problems”, International Journal of Uncertainty, Fuzziness and Knowledge Based Systems, Vol. 9, No. 1, pp.103-114.
- De Battisti, F., Nicolini, G. and Salini, S. (2005), “The Rasch model to measure service quality”, The ICFAI Journal of Services Marketing, Vol. 3, No. 3, pp.58-80.
- De Battisti, F., Nicolini, G., and Salini, S. (2010), “The Rasch model in customer satisfaction survey data“, Quality Technology & Quantitative Management, Vol. 7. No. 1,pp.15–34.
- De Oliveira, O.J. and Ferreira, E.C. (2009), “Adaptation and application of the SERVQUAL scale in higher education” paper presented at POMS 20th Annual Conference, 1-4 May 2009, Orlando, Florida USA.
- De Sáa, S.D.L.R., Gil, M.Á., González-Rodríguez, G., López, M.T. and Lubiano, M.A. (2015), “Fuzzy rating scale-based questionnaires and their statistical analysis”, IEEE Transactions on Fuzzy Systems, Vol. 23, No. 1, pp.111-126.
- Dombi, J. (2008), “Towards a General Class of Operators for Fuzzy Systems”, IEEE T Fuzzy Syst, Vol. 16, No. 2, pp.477–484.
- Dombi, J. (2009), “Pliant Arithmetics and Pliant Arithmetic Operations”, Acta Polytech Hun, Vol. 6, No. 5, pp.19–49.
- Douglas, J. and Douglas, A. (2006), “Evaluating teaching quality”, Quality in Higher Education, Vol. 12 No. 1, pp. 3-12.
- Ghneim, J. (2013), “Fuzzy concept”, Encyclopedia of Psychometrics, pp.61-68.
- Gil, M.Á. and González-Rodríguez, G. (2012), “Fuzzy vs. Likert scale in statistics” In Trillas, E., Bonissone, P.P., Magdalena, L. and Kacprzyk, J. (Eds.): Combining experimentation and theory, Springer, Berlin Heidelberg, pp.407-420.
- Gil, M.Á., Lubiano, M.A., de Sáa, S.D.L.R., Sinova, B. (2015) “Analyzing data from a fuzzy rating scale based questionnaire. A case study”, Psicothema, Vol. 27, No. 2, pp. 182-191.
- Gruber, T., Fub, S., Voss, R., and Zikuda, M.G. (2010), “Examining student satisfaction with higher education services - Using a new measurement tool”, International Journal of Public Sector Management, Vol. 23, No.2, pp.105-123
- Herrera, F., López, E., Mendana, C. and Rodríguez, M.A. (1999), “Solving an assignment-selection problem with verbal information and using genetic algorithms 2.”, European Journal of Operational Research, Vol. 119, No.2, pp. 326-337.
- Herrera, F., Herrera-Viedma, E. (2000), “Choice functions and mechanisms for linguistic preference relations”, European Journal of Operational Research, Vol. 120, No. 1, pp.144-161.
- Hesketh, B., Pryor, R., Gleitzman, M. and Hesketh, T. (1988), “Practical applications and psychometric evaluation of a computerized fuzzy graphic rating scale”, Advances in Psychology, Vol. 56, pp.425-454.
- Jamieson, S. (2004), “Likert scales: how to (ab) use them”, Medical Education, Vol. 38, No. 12, pp.1217-1218.
- Jonessen, D. H. (2000), “Integrating problem solving into instructional design” In Dempsey, J. and Reiser, R.A.(Eds.), Trends and issues on instructional design and technology, Prentice-Hall, Upper Saddle River, NJ
- Kacprzyk, J. (1986), “Towards a ’human-consistent’ multistage decision making and control models using fuzzy sets and fuzzy logic”, Fuzzy Sets and Systems, Vol. 18, No. 3, pp.299-314.
- Lalla, M., Facchinetti, G. and Mastroleo, G. (2005), “Ordinal scales and fuzzy set systems to measure agreement: an application to the evaluation of teaching activity”, Quality & Quantity, Vol. 38, No. 5, pp.577-601.
- Liu, N., and Carless. D. (2006), “Peer Feedback: The Learning Element of Peer Assessment.”Teaching in Higher Education, Vol. 11, No. 3, pp. 279–290.
- Liu, R., Cui, L., Zeng, G., Wu, H., Wang, C., Yan, S. and Yan, B. (2015), “Applying the fuzzy SERVQUAL method to measure the service quality in certification and inspection industry”, Applied Soft Computing, Vol. 26, pp.508-512.
- Lozano, L.M., García-Cueto, E. and Muñiz, J. (2008), “Effect of the number of response categories on the reliability and validity of rating scales”, Methodology, Vol. 4, No. 2, pp.73-79.
- Lubiano, M.A., de Sáa, S.D.L.R., Montenegro, M., Sinova, B. and Gil, M.Á. (2016.), “Descriptive analysis of responses to items in questionnaires. Why not using a fuzzy rating scale?”, Information Sciences, 360, pp.131-148.
- Lupo, T. (2013), “A fuzzy ServQual based method for reliable measurements of education quality in Italian higher education area”, Expert systems with applications, Vol. 40, No. 17, pp.7096-7110.
- Sowa, J.F. (2013), “What Is the Source of Fuzziness?”, In Seiging, R., Trillas, E., Moraga, C. and Termini, S. (Eds.), On Fuzziness, Springer Berlin, Heidelberg, pp.645-652.
- Venkatesan, S. and Fragomeni, S., 2008. Evaluating learning outcomes in PBL using fuzzy logic techniques. In 19th Annual Conference of the Australasian Association for Engineering Education: To Industry and Beyond; Proceedings of the (p. 534). Institution of Engineers, Australia
- Yousapronpaiboon, K., (2014), “SERVQUAL: Measuring higher education service quality in Thailand”, Procedia-Social and Behavioral Sciences, 116, pp.1088-1095.
- Yu, C.M., Tsang, H.T. and Chen, K.S. (2016), “Developing a performance evaluation matrix to enhance the learner satisfaction of an e-learning system”, Total Quality Management & Business Excellence, Published online 19 Sept 2016, http://dx.doi.org/10.1080/14783363.2016.1233809.
Copyright information

This work is licensed under a Creative Commons Attribution-NonCommercial-NoDerivatives 4.0 International License.
About this article
Publication Date
16 October 2017
Article Doi
eBook ISBN
978-1-80296-030-3
Publisher
Future Academy
Volume
31
Print ISBN (optional)
-
Edition Number
1st Edition
Pages
1-1026
Subjects
Education, educational psychology, counselling psychology
Cite this article as:
Tóth, Z. E., Árva, G., & Surman, V. (2017). Enhancing The Reliability Of Measurements And Evaluations Based On Service Quality Models. In Z. Bekirogullari, M. Y. Minas, & R. X. Thambusamy (Eds.), ICEEPSY 2017: Education and Educational Psychology, vol 31. European Proceedings of Social and Behavioural Sciences (pp. 642-653). Future Academy. https://doi.org/10.15405/epsbs.2017.10.61