
Influence Of Prior Academic Performance On The Adaptation Of Students To University


Abstract
One of the issues that are particularly interesting to many researches is the adaptation period of first-year students. Often, the transition from childhood to maturity and independence takes place at higher educational institutions. First-year students find themselves entering the process of adaptation. All in all, student adaptation might take two or even three semesters. According to the existing body of research, prior school performance is one of the most influential factors on student adaptation. Using correlational and structural analysis, the relations between secondary school examination results and performance over the first semester (during the adaptation period) of the physics students at Kazan Federal University have been studied. By the end of the first stage of our analysis, we established that there was an insignificant difference between secondary school examination results and the results demonstrated over the first semester which confirms that these two performance indicators are related. In this article, we also present the algorithm of working with correlational matrix. These materials can be used by teachers, tutors and researches who are interested in related topics.
Keywords: Adaptationfirst-year studentgradecorrelational matrix
Introduction
The period of studying at university has long been attracting attention of philosophers, psychologists, sociologists and teachers. A university student who is working hard and acquiring theoretical knowledge today will be applying this knowledge tomorrow in their professional life. Employers are invested in students obtaining high quality professional education. In view of this, the process of student adaptation is not without interest for scholars. Often, the transition from childhood to maturity and independence takes place at higher educational institutions. First-year students find themselves entering the process of adaptation. All in all, student adaptation might take two or even three semesters. In some cases, adaptation can last over the whole period of studying at university. High academic performance is one of the indicators of successful adaptation (Solovjev, 2004) which, according to a number of researchers, depends on the results of final school examinations (Havenson, Solovjeva, 2014; Maijorova, 2014; Zamkov and Pereseckij, 2013). These researchers used a variety of methods but we have decided to use the correlational and structural matrix analysis of data (Garnaeva, Kuznetsov, Nefediev, 2008) to identify hidden factors.
Explore Importance of the Problem
The process of student adaptation has been studied from a range of different perspectives. For instance, the interdependence of stress and adaptation is investigated in the work of Aurel Ion Clinciu (2013); physiology and adaptation (Panikhina, 2011), psychological and psychophysiological factors of different social groups and their influence on adaptation – (Notova et al., 2015), the motivation of adaptation and mental health of students (Bailey and Phillips, 2015), social media presence and adaptation (Nalbone et al., 2016), family relationships and psychological wellbeing within one’s family and adaptation (Wintre and Yaffe, 2000), adaptation and relationship difficulties with parents and friends, the process of detachment from previous life and isolation (Lehmann, 2014; Gabdrakhmanova, 2017), social adaptation of students (Elgina, 2010; Grigoryan, 2014), academic adaptation of students (Zhegulskaya, 2011), adaptation of international students (Nadeem Akhtar, Pratt and Shan Bo, 2015), assimilation of rural students to life in urban areas (Xiulan, 2015), a methodological system that supports first-year students and helps adaptation (Poptsov and Surovikina, 2012), designing a module-based study plan (Garnaeva et al., 2015), introducing new educational forms (Gabdrakhmanova et al., 2015), facilitating successful adaptation through collaborative creative work of students and their teachers (Khuziakhmetov and Gabdrakhmanova, 2016); using IT to help students adapt (Garnaeva et al., 2015), and finally, social activities and academic performance (Nuñez, 2009). During the qualification courses for teachers of higher educational institutions, the issue of adaptation is discussed (Temnikova et al., 2015). This is only a fraction of the body of literature on student adaptation.
Comparative analysis of data
The method of comparative analysis is extensively used (Graf, 2016; Mahoney, 2004; Skocpol Theda and Somers, 1980). Several scholars (Shegolova and Surovtsova, 2015; Poldin, 2011) compared secondary school examination results with the results of the first semester. Using a correlational matrix and its structural analysis allows to uncover a number of hidden factors that influence the process of adaptation.
Status of a Problem
In order to investigate this issue, we have studied the works that are devoted to:
-Theory and practice of modern higher education
-Student-focused research
-Social adaptation
-Research methodology
Analysing these and many other works on this issue we came to see that there is some research devoted to the relation between secondary school examination results and the results of the first semester, however this issue needs to be studied deeply. We argue that using correlational and structural analysis provides invaluable insight into the relation between secondary school examination results and the results of the first semester. This way we are contributing to the existing body of methodology.
Hypothesis
We have formed the following hypothesis:
Is there any relation between secondary school examination results and the results of the first semester for the first-year physics students at Kazan Federal University? What are the most influential factors besides those that are already known (an increased workload, a high number of new disciplines, the necessity to start new relationships with other students, teachers, etc)
Materials and Methods
Goals of the research
Over the course of our research work the following objectives have been completed: 1) reading through psycho-pedagogic literature on the theory and practice of the modern higher education, social adaptation problems of students, and research methods; 2) identifying indicators, 3) defining our methodology, 4) selecting the sample of students for our research; 5) drawing conclusions from the results of our analytical work.
Theoretical and empirical methods
To test the hypothesis, a number of methods were used:
Theoretical methods: theoretical analysis and synthesis of the philosophical, methodological, pedagogic, psychological, social and scientific literature, generalization, and comparison;
Empirical methods: documentation analysis, qualitative and quantitative analysis of the findings, statistical and mathematical research methods.
Basis of the research
This research was based at the Institute of Physics of Kazan Federal University.
Description of the experiment and algorithm of the work using correlation and structural analysis
We selected correlational and structural analysis as diagnostic tools (Garnaeva et al., 2008). This analysis enabled us to identify hidden factors that influence the process of adaptation.
The sample for the research was selected among first-year students of the Institute of Physics across all study programmes. The total number of the participants was 262. The total number of sub-groups was 15 (the sample was divided into sub-groups according to students’ specializations: geodesies and distance zoning, nano- and microsystemic technologies, pedagogic education, etc.) We selected the following parameters for this analysis: the average grades for all secondary school examinations (three examinations), the average grades for the first semester, and the average scores for the first semester examinations.
Our findings (the level of performance of first-year students) were put into a data matrix in which the rows were the participants and the columns were the grades. The three first columns were filled with entry examinations results, the rest – with the grades for the first semester.
The number of students is N in the matrix and the number of parameters is n. The matrix looks like this:
In this matrix, ziJ indicates the value of j-parameter for i-student. The data matrix needs to be converted to a standardised form in which the mean value of all parameters equals zero and the mean values of dispersion are the same numbers. This standard matrix looks like X=xiJ.
Then we introduce the sample correlation coefficient to the matrix (meaning the correlation coefficient is derived from the sample items presented in the data matrix). The value of the correlation coefficient shows that the parameters are related. Therefore, many data processing activities can be performed through working with correlational matrixes.
The main goal of processing the correlational data matrix is to divide all the matrix elements into disjoint subsets G1, …, GL (aggregates) so that the values of the relations Rij between the items in the same subset are as large as possible, while the values of the relations Rij between the items in different subsets are as small as possible. This approach is the essential for processing our empirical material effectively. It is important to understand that the reasons behind some parameters being closely related in a subset can lie in hidden factors which might be influencing the parameters more than anything. This is why the real meaning of parameters in one subset can be a hint for a researcher as to which significant internal factor defines hidden characteristics. Everything that was said above indicates that there is an opportunity for applying a different approach (not just factor analysis) to uncover significant factors.
The main approach to complete the task of aggregating the correlational matrix requires an appropriate function to be introduced depending on how exactly the items are divided into L aggregates G1, …, GL and on the fact that the “good” way of item aggregation corresponds to the experimental value of the function. Function is determined as;
,
where mk is the number of items aggregated. The condition ij is introduced so that the value of the internal relation between items would not affect the result of aggregation. The function equals to the average sum of all values within each aggregate, while the measuring coefficient is proportional to the size of the aggregate. In view of this, the maximization of F leads to aggregates that are large in size becoming ‘thicker’ (with higher value of average relations among items) while smaller aggregates remain less ‘thick’. The algorithm for finding the local extremum of the function is as follows: at each step of the algorithm an item from the aggregate to which it belongs at a particular step is consecutively transferred to all other aggregates (starting from the first one). During each transfer, the function is newly calculated and compared to the value that was prior to transferring. If after transferring the value of the function increases, then the item remains in the new aggregate. At this point, this particular algorithm ends. If after transferring to all other aggregates the value of function does not increase, at least once then the item remains in its original aggregate. At all other steps of the algorithm the rest of the items are transferred. The algorithm stops after there is no more change in the aggregate when items are checked.
The described algorithm allows to get the average values of the tested parameters along with their sample variance and items of the correlation matrix as well as to divide the items of the correlation matrix into aggregates based on particular factors.
Further data analysis is carried out by using a graph plotted for each selected aggregate (factor). In order to simplify their structure, these graphs can be created by taking into account the value of the relation between the corresponding parameters and the degree of reliability. Creating these graphs allows to visualize the structure of the correlation for the tested parameters and to compare it with other structures for different subgroups of participants. At the same time, it is easy to find the differences and identify the strongest correlations which helps you see what you are looking for.
However, when a correlation matrix is processed to ensure a sufficient validity of the results, it is necessary to perform a sufficient number of measurements. Furthermore, some aggregation methods may have an insufficient level of sensitivity (when aggregates are formed) in the case of many parameters.
For the integral mapping of the interaction of the two subsystems A and B it is convenient to introduce the information entropies H(A), H(B), H(A,B) which are based on the correlation matrix. In this case, the conditional information entropy H(A|B) and H(B|A) can be viewed as a measure of the influence between two subsystems while the correlation entropy H(A:B) indicates the closeness of subsystems.
Results
Methods and results of the experiment
The Institute of Physics KFU offers several professional degree programmes. Prospective students get accepted onto university degree programmes in accordance with their final examinations results for the key subjects. Modules that are offered over the first semesters can be devoted to the same subjects that students took in high school but not necessarily. When analysing academic performance, we compared the scores/grades for the university modules with the scores/grades that were most closely related to them in school subjects.
The following parameters are measured for the first-year students in the Institute of Physics KFU (Geodesy and Earth Remote Probing programme).
Requirements:
1.Final school exam in physics
2.Final school exam in mathematics
3.Final school exam in Russian language
4.Astronomy exam grade
5.Semester score in astronomy
6.Examination score in astronomy
7.Mathematics exam grade
8.Semester score in math
9.Examination score in math
10.Physics exam grade
11.Semester score in physics
12.Examination score in physics
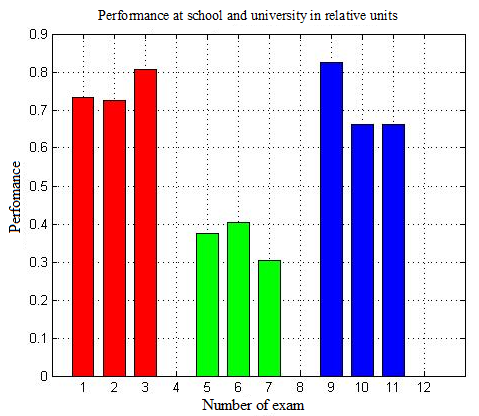
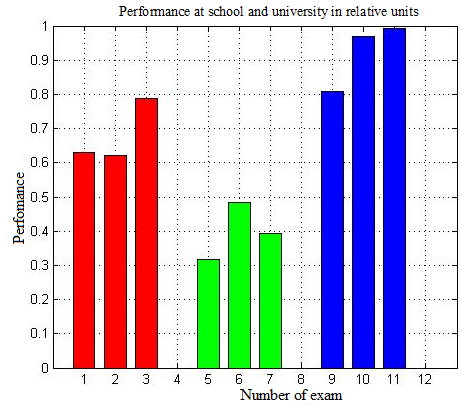
Figure
These performance figures demonstrate that results for school final exams, interim assessments, and overall results for the first semester are very similar by value. Thus, students are adapting to university life successfully.
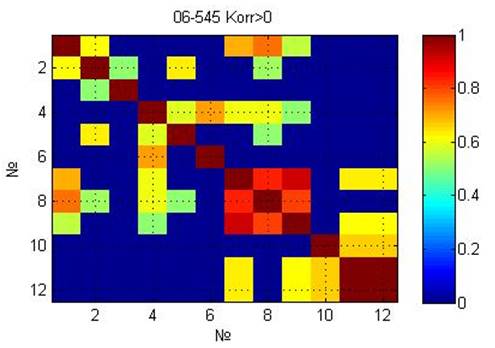
The calculation of correlation coefficients of reliability of the results:
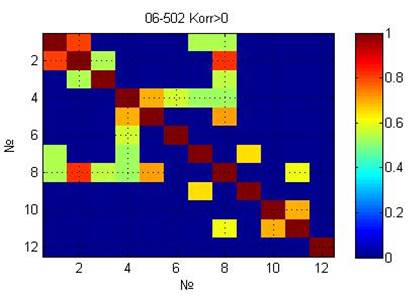
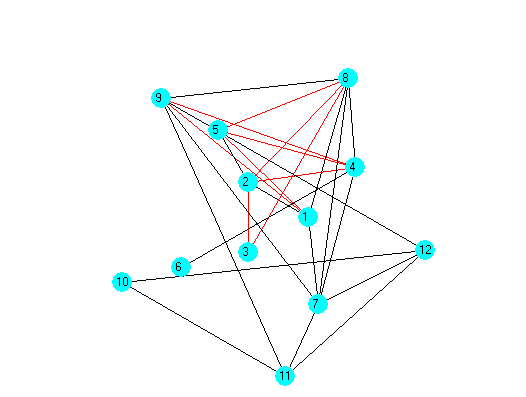
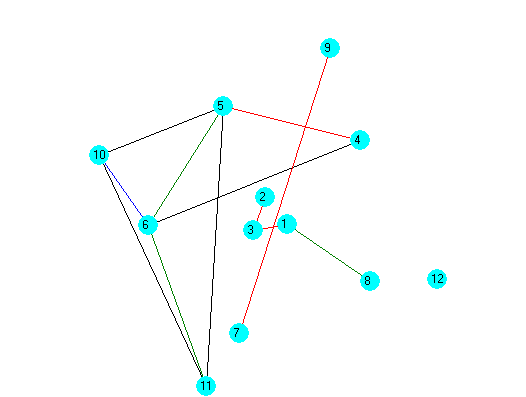
The structure of the correlation matrix can be presented as a weighted graph (Figure
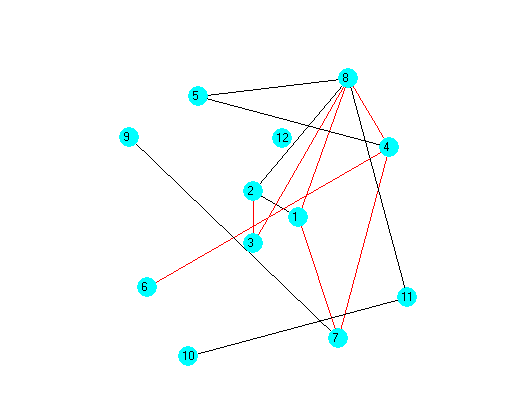
The graph structural analysis is performed using information entropy. The following objects were selected: object A (1 – final school examination in physics, 2 – final school examination in math, 3 – final school examination in Russian language); object B (4 – astronomy examination grade, 5 – semester score in astronomy, 6 – examination score in astronomy, 7 – math examination grade, 8 – semester score in math, 9 – examination score in math, 10 – physics examination grade, 11 – semester score in physics, 12 – examination score in physics).
We have calculated the following values of information entropy: H(A)=0.33; H(B)=0.18; H(A|B)=-0.03; H(B|A)=-0.18; H(A:B)=0.36; H(A,B)=0.15.
In the conditional information entropy H(A|B)> H(B|A), the subsystem A has a stronger influence on the subsystem B than vice versa. Thus, the performance level on final school examinations has an influence on the level of achievement in KFU over the 1st semester in the sample group of students.
Сorrelation entropy H(A:B)=0.36 is an integrated measure for the interaction or the proximity of two sub-systems, i.e. performance on final school examinations and academic performance over the 1st semester.
The following parameters are measured for the first-year students in the Institute of Physics KFU (Nanotechnologies and microsystem technologies programme)
Requirements:
1. Final school exam in physics
2.Final school exam in mathematics
3.Final school exam in Russian language
4.Analytic geometry exam grade
5.Semester score in analytic geometry
6.Examination score in analytic geometry
7.Physics exam grade
8.Semester score in physics
9.Examination score in physics
10.Chemistry exam grade
11.Semester score in chemistry
12.Examination score in chemistry
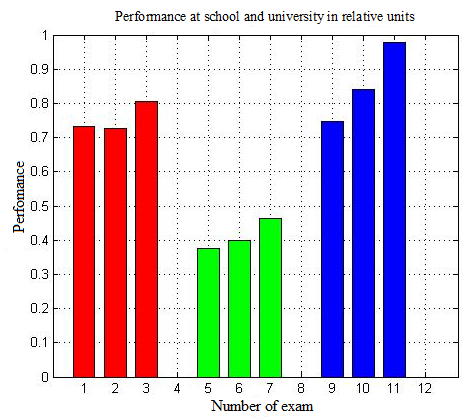
Figure
These performance figures demonstrate that results for school final exams, interim assessments and overall results for the first semester are very similar by value. Thus, students are adapting to university life successfully.
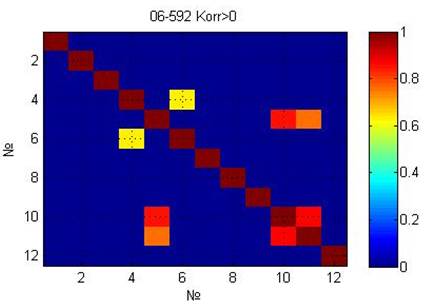
The calculation of correlation coefficients of reliability of the results:
The structure of the correlation matrix can be presented as a weighted graph (Figure
The graph structural analysis is performed using information entropy. The following objects were selected: object A (1 – final school examination in physics, 2 – final school examination in math, 3 – final school examination in Russian language); object B (4 – analytic geometry examination grade, 5 – semester score in analytic geometry, 6 – examination score in analytic geometry, 7 – physics examination grade, 8 – semester score in physics, 9 – examination score in physics, 10 – chemistry examination grade, 11 – semester score in chemistry, 12 – examination score in chemistry).
We have calculated the following values of information entropy: H(A)=0.33; H(B)=0.3; H(A|B)=-0.09; H(B|A)=-0.12; H(A:B)=0.42; H(A,B)=0.21.
In the conditional information entropy H(A|B)> H(B|A), the subsystem A has a stronger influence on the subsystem B than vice versa. Thus, the performance level on final school examinations has an influence on the level of achievement in KFU over the 1st semester in the sample group of students.
Correlation entropy H(A:B)=0.42 is an integrated measure for the interaction or the proximity of two sub-systems, i.e. performance on final school examinations and academic performance over the 1st semester.
The following parameters are measured for the first-year students in the Institute of Physics KFU (Teacher education programme)
Requirements:
1. Final school exam in physics
2. Final school exam in mathematics
3. Final school exam in Russian language
4. Linear algebra and analytic geometry exam grade
5. Semester score in linear algebra and analytic geometry
6. Examination score in linear algebra and analytic geometry
7. The basics of pedagogy exam grade
8. Semester score in the basics of pedagogy
9. Examination score in the basics of pedagogy
10. Russia in the context of world history exam grade
11. Semester score in Russia in the context of world history
12. Examination score in Russia in the context of world history
Figure
These performance figures demonstrate that results for school final exams, interim assessments, and overall results for the first semester are very similar by value. Thus, students are adapting to university life successfully.
The calculation of correlation coefficients of reliability of the results:
The structure of the correlation matrix can be presented as a weighted graph (Figure
The graph structural analysis is performed using information entropy. The following objects were selected: object A (1 – final school examination in physics, 2 – final school examination in math, 3 – final school examination in Russian language); object B (4 – linear algebra and analytic geometry examination grade, 5 – semester score in linear algebra and analytic geometry, 6 – examination score in linear algebra and analytic geometry, 7 – the basics of pedagogy examination grade, 8 – semester score in the basics of pedagogy, 9 – examination score in the basics of pedagogy, 10 – Russia in the context of world history examination grade, 11 – semester score in Russia in the context of world history, 12 – examination score in Russia in the context of world history).
We have calculated the following values of information entropy: H(A)=0.33; H(B)=0.2; H(A|B)=-0.06; H(B|A)=-0.19; H(A:B)=0.39; H(A,B)=0.13.
In the conditional information entropy H(A|B)> H(B|A), the subsystem A has a stronger influence on the subsystem B than vice versa. Thus, the performance level on final school examinations has an influence on the level of achievement in KFU over the 1st semester in the sample group of students.
Correlation entropy H(A:B)=0.36 is an integrated measure for the interaction or the proximity of two sub-systems, i.e. performance on final school examinations and academic performance over the 1st semester.
In all three groups, we got similar results.
Discussions
There are a lot of problematic issues surrounding the process of young people leaving schools and entering universities and thus changing their social roles. Many scholars have been studying the correlation between final school examinations and the academic performance that they demonstrate once they begin their programme at university. The reliability and validity in this study was achieved through the application of modern research methodology using psycho-pedagogical and methodological resources; through the application of theoretical and experimental research methods.
Conclusion
The findings of this study demonstrate the following:
1.The relation between final school results and results over the first university semester (the results achieved by students over their adaptation period) was successfully established, the data entered in the correlation matrix indicate that there is a strong correlation between school performance levels and university performance levels over the adaptation period.
2.Hidden factors which could influence the relation between final school examinations and university performance over the adaptation period were not found.
3.It is necessary to carry out further research. The next stage will involve analyzing the performance of students who have completed the first year and the second year of studies.
Recommendations
For researchers;
The materials of this article will be of interest to the researchers who are focused on issues related to the adaptation of first-year students in higher educational institutions. The correlation matrix might help determine hidden factor that might be influencing the characteristics of the studied object.
For practitioners;
The materials of this article will be of interest to the academic staff of higher educational institutions because the materials can help enrich practical work with first-year students in higher educational institutions.
Acknowledgements
The work is performed according to the Russian Government Program of Competitive Growth of Kazan Federal University.
References
- Akhtar, N., Pratt, C. B., & Bo, S. (2015). Factors in the cross-cultural adaptation of African students in Chinese universities. Journal of Research in International Education, 14(2), 98-113.
- Bailey, T.H. & Phillips, L.J. (2015). The influence of motivation and adaptation on students’ subjective well-being, meaning in life and academic performance. Higher Education Research & Development, 25, 201-216.
- Clinciu, A. I. (2013). Adaptation and stress for the first year university students. Procedia-Social and Behavioral Sciences, 78, 718-722.
- Elgina, L.S. (2010). Socialnaya adaptaciya studentov v vuze. [Social adaptation of students at the University]. Vestnik Buryatskogo gosudarstvennogo universiteta [Bulletin of the Buryat state University], 5, 162-166.
- Gabdrakhmanova, R.G. (2015). Modern forms of organization of educational activity of students. Kazanskiy pedagogicheskiy zhurnal [Kazan pedagogical journal], 3 (110), 79-82..
- Gabdrakhmanova, R.G.& Khuziakhmetov, А.N. (2017). Relationship of ecology and socialization of schoolchildren personality. Modern Journal of Language Teaching Methods, 7(3), 562-569.
- Gabdrakhmanova, R.G., Khusainova, R.M., Chirkina, S.E., Asafova, E.V., Golovanova, I.I., & Telegina, N.V. (2015). Development of training courses is an integral part of the work on an educational project. Psihologicheskaya nauka i obrazovanie (psyedu.ru Psychological Science and Education) [Psychological science and education (psyedu. ru Psychological Science and Education)], 7 (4), 73-93.
- Garnaeva, G.I., Aganov, A.V., Nefediev, L.A., Nizamova, E.I. (2015). Pedagogical technology and modular training in the development of education. Kazanskiy pedagogicheskiy zhurnal [Kazan pedagogical journal], 3 (110), 10-23.
- Garnaeva, G.I., Kuznetsov, E., Nefediev, L.A. (2008). Structural studies of student performance, faculty of physical TGGPU. Vestnik TGGPU [Bulletin of TGGPU], 4 (15), 10-13.
- Garnaeva, G.I., Nizamova, E.I., Temnikav, D.A. (2015). The role of network information resources in the management of research activities of students. Kazanskiy pedagogicheskiy zhurnal [Kazan pedagogical journal], 3(110), 90-95.
- Graf, L. (2016). The rise of work-based academic education in Austria, Germany and Switzerland. Journal of Vocational Education & Training, 68(1), 1-16.
- Grigoryan, E.G. (2014). The problem of social adaptation of first-year students in a technical University. Kultura i obrazovanie [Culture and education], 12, Retrieved from http://vestnik-rzi.ru/2014/12/2735
- Havenson, T.E. & Solovjeva, A.A. (2014). Communication of the results of the Unified state examination and academic performance. Voprosy obrazovaniya [The issues of education], 1, 176−199.
- Khuziakhmetov, A. N., & Gabdrakhmanova, R. G. (2016). Creativity in joint activity of teacher and student in the learning process. IEJME: Mathematics Education, 11(4), 735-745.
- Lehmann, W. (2014). Habitus Transformation and Hidden Injuries Successful Working-class University Students. Sociology of Education, 87, 11-15.
- Mahoney, J. (2004). Comparative-historical methodology. Annu. Rev. Sociol., 30, 81-101.
- Maijorova, N.B. (2014). Contradictions of the use and development of the education system. Fundamentalnye i prikladnye issledovaniya v sovremennom mire [Fundamental and applied studies in the modern world], 2(7), 58−65.
- Nalbone, D. P., Kovach, R. J., Fish, J. N., McCoy, K. M., Jones, K. E., & Wright, H. R. (2016). Social Networking Web Sites as a Tool for Student Transitions: Purposive Use of Social Networking Web Sites for the First-Year Experience. Journal of College Student Retention: Research, Theory & Practice, 17(4), 489-512.
- Notova, S.V., Kiyaeva, E.V., Alidzhanova, I.E., Akimov, S.S. (2015). Indicators of psychophysiological adaptation of students from different social groups. Ekologiya cheloveka [Human ecology], 11, 41–47.
- Nuñez, A.M. (2009). Organizational Effects on First-Year Students' Academic Outcomes at a New Public Research University. Journal of College Student Retention: Research, Theory & Practice, 10(4), 525-541.
- Panikhina, A.V. (2011). Physiology of adaptation of first-year students to studies at higher educational institutions. Bull Exp Biol Med, 151, 278-279.
- Poldin, O.V. (2011). Prognozirovanie uspevaemosti v vuze po rezultatam EGE [The prediction of academic performance on the exam]. Prikladnaya ekonometrika [Applied econometrics], 1 (21), 56−69.
- Poptsov, A.N. & Surovikina, S.A. (2012). The analysis of the notion of "adaptation" and its diagnosis in the process of teaching physics first-year students of branch of the Polytechnic University. Sovremennye problemy nauki i obrazovaniya [Modern problems of science and education], 2, 132-141.
- Skocpol, T. & Somers, M. (1980). The Uses of Comparative History in Macrosocial Inquiry. Comparative Studies in Society and History, 22(2), 174 – 197.
- Solovjev, V.N. (2004). The influence of adaptation and motivation training on academic performance of students. Fundamentalnye issledovaniya [Fundamental research], 5, 81-83.
- Temnikova, D.A., Garnaeva, G.I., Aganov, A.V. (2015). Model for training teachers in large educational groups. Kazanskiy pedagogicheskiy zhurnal [Kazan pedagogical journal], 3 (110), 83-86.
- Wintre, M. G. & Yaffe, M. (2000). First-Year Students’ Adjustment to University Life as a Function of Relationships with Parents. Journal of Adolescent Research, 15, 19-37.
- Xiulan, Yu. (2015). From Passive Assimilation to Active Integration: The Adaptation of Rural College Students to Cities. Chinese Education & Society (Published Online), 24, 92-104.
- Zamkov, O.O. & Pereseckij, A.A. (2013). EGE i akademicheskie uspehi studentov bakalavriata MIEF NIU VShE [Exam and academic success of undergraduate students of the ICEF HSE]. Prikladnaya ekonometrika [Applied econometrics], 30 (2), 93−114.
- Zhegulskaya, Y.V. (2011). Factors academic adaptation of first-year students (on the example of Kemerovo state University of culture and arts). Vestnik Kemerovskogo gosudarstvennogo universiteta kultury i iskusstv [Bulletin of the Kemerovo state University of culture and arts], 15, 130-138.
Copyright information

This work is licensed under a Creative Commons Attribution-NonCommercial-NoDerivatives 4.0 International License.
About this article
Publication Date
31 August 2017
Article Doi
eBook ISBN
978-1-80296-028-0
Publisher
Future Academy
Volume
29
Print ISBN (optional)
-
Edition Number
1st Edition
Pages
1-960
Subjects
Teacher, teacher training, teaching skills, teaching techniques
Cite this article as:
Gabdrakhmanova, R. G., Garnaeva, G. I., & Nefediev, L. A. (2017). Influence Of Prior Academic Performance On The Adaptation Of Students To University. In R. Valeeva (Ed.), Teacher Education - IFTE 2017, vol 29. European Proceedings of Social and Behavioural Sciences (pp. 174-188). Future Academy. https://doi.org/10.15405/epsbs.2017.08.02.22