
Innovative Mathematical Model of Optimization the Tour Operators Number in Boundary Regions


Abstract
The article demonstrates the application of a mathematical model in a decision-making process of relevant committees and agencies of the Russian Federation subjects that control the tourist industry. The mathematical apparatus of the queuing theory is applied as an instrument of assessment of the organization level of the Trans-Baikal Territory tourism industry and used for optimizing the number of tour operators. The optimal number of tour operators for minimizing the total cost of the pursuit of activities by the subjects of tourism is defined. The developed model can be used in decision making by those authorities which are responsible for the developing tourism in the region. The efficiency of management of the Trans-Baikal Territory tourism industry with the use of the constructed model is assessed. The peculiarities of innovation activity in the tourism industry are shown as well. The application of the developed activities is shown by the example of the Trans-Baikal territory.
Keywords: Managementinnovation activitytourismtourism industryqueuing theory
Introduction
There are several key areas of the innovative activity in the tourism industry:
- Introduction of new products and services;
- The use of new technologies in the production of traditional products;
- The use of tourist resources not previously used;
- The use of advanced information and telecommunications technologies;
- Development of emerging markets (Monich, 2011).
Purpose of study
Important aspects of innovation are the issues on how to optimize the parameters characteristic of the subjects of innovation. In this behalf, it is advisable to calculate the optimal number of tour operators in the region on the basis of relevant parameters.
Management of innovation activity includes design-basis justification of goals and objectives for the particular period of time. Thus, by the goal of management we mean the required or desired state of the system in the planning period, expressed as a set of economic, administrative, scientific and innovative features. The purpose of this work is application of the mathematical model of the queuing theory to the tourism industry of the frontier subject of the Russian Federation as part of innovative activity management in tourism. By the innovation activity we mean the implementation of organizational innovations. (Timothy, 2001; Vodeb, 2010). In accordance with the intended goal, we have identified the following objectives:
Research methods
The mathematical apparatus of the queuing theory is applied as an instrument of assessment of the Trans-Baikal Territory tourism industry organization level and used for optimizing the number of tour operators.
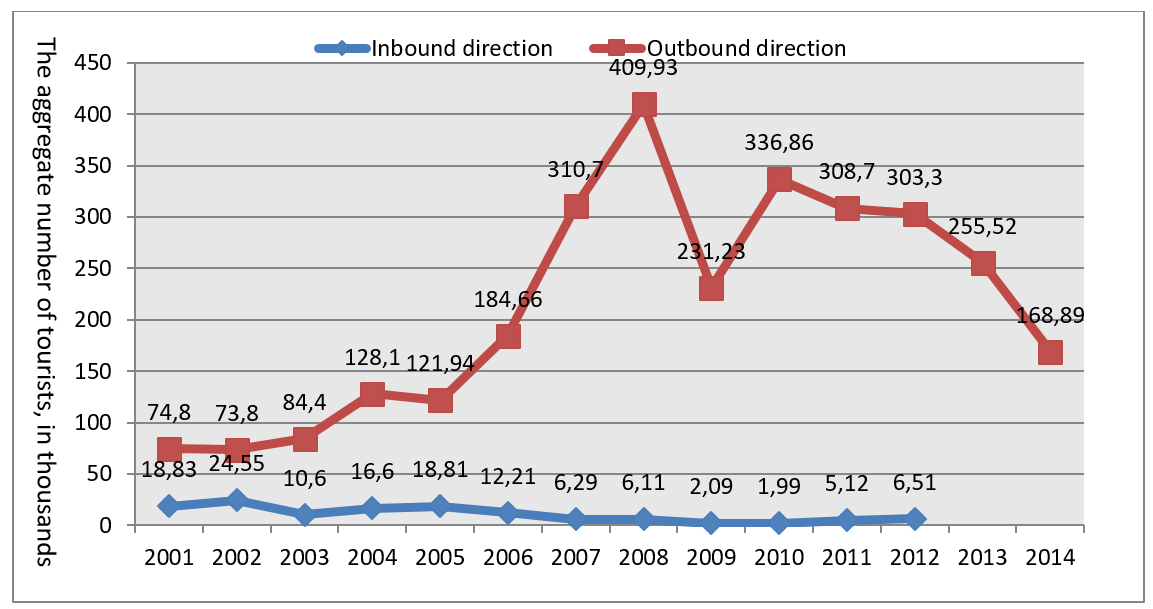
Analyzing outbound flow from Trans-Baikal Territory
Currently, testing and commissioning the bilateral IT system of electronic document management and online security in the framework of the Visa-Free Travel Agreement between Russia and China are conducted. This system can be regarded both as a product innovation and as an innovative service offered to tour operators operating in China and specializing in formation of tourist groups (Monich, 2011). Such changes in the follow-up of the Agreement can affect the organizational form and structure of the tourism of regions bordering with China, including the number of tour operators there. When it comes to managing the tourist industry in the RF subjects bordering with China,
We are going to investigate the period from 2006 to 2010. In this period, in 2009, the tourist flow had reached the maximum value and then started decreasing which is still continuing. According to the destination structure of the outbound flow from the Trans-Baikal Territory, the share of tourists sent to China has been increasing steadily, and by 2008, it reached 97.1% of all served tourists. It should be noted that in 2008, the number of tourists who went from the Trans-Baikal Territory to China amounted to 420,379 people, among them 409,930 (97.5%) travelled under the Agreement. Thus, in 2008, the tourists flow under the Agreement amounted to (0.971 * 0.975) * 100% = 94.7% of the total number of outgoing tourists. We have chosen 2008 as the peak year for outbound flow to the People’s Republic of China.
Every year, the lists of tour operators being parties of this Agreement are published on the websites of the State Administration and the China National Tourism Administration (CNTA, China). The number of tour operators included in the Agreement is the biggest in the border regions. For a Trans-Baikal Territory company, there must be a letter of the
The mathematical model for optimization of the number of tour operators
The analyzed system qualifies as the regret function for waiting systems which is as follows:
Fn,wait=CexpecM0+CdtN0+Сen (1)
where C wait is total loss as a consequence of waiting for services; M0 is the average number of tourist groups, waiting for services; Cdt is the cost of downtime of the tour operator in unit time (if there are no applications for a tour); N0 is the average number of companies that have no application for registration of a group; Сe is the operation cost per time unit; n is the number of tour operators;
In order to determine values of the Cwait, Cdt and Сe costs, 10 executives of Trans-Baikal Territory tour operators were surveyed.
The losses associated with waiting for inception of services by tourists groups at a time (Cwait), were usually associated with the loss of profits in connection with business of all operators of a company and their inability to accept an application for a tour registration. In such situation, a group could refer to a competitor and thereby deprive the tour operator of profits.
In the course of calculating the cost of the tour operator downtime in unit time (Cdt), we summed up costs on commercial activity in case of absence of requests. The following parameters were considered:
The operation cost per time unit (Сe) was associated with pursuit of travel company activities during providing customer service. Generally, the following elements were included:
The executive of each company identified averages for these costs. The ratio between the parameters for all tour operators is clearly expressed and is appropriate to the following proportion: C wait : Cdt: Сe == 0.004: 0.880 : 1. According to the mathematical model, when calculating the cost function, we used disjunction of conjunctions (see Eq. 1). In terms of calculations, the ratio of costs parameters is more important than their absolute figures in rubles. We took the average values of ten companies as indicators:
Cwait= 12(thous.rub./day) (2)
Cdt= 2700(thous.rub./year) (3)
Ce= 3060(thous.rub./year) (4)
In addition to the costs parameters described above, the following original values were also taken as input data.
1. The number of tour operators in 2006-2010 and the number of served tourists for this period under the Agreement. The relevant data are given in Table
2. The number of tourist groups and the average service time for one group. Inflow of application from a tourist group is random. Statistics of the arrival rate showed that the incoming requests form the Poisson stream. It is expedient to introduce the groups to the tourists number ratio, k = 100.
To determine the optimal number of tour operators and relevant assessments of their workflow management in 2010, a software package under Microsoft Visual Studio 2010 coded in C# developed by the authors was used. The description of assessments and the results are shown in Table
, (5)
wherePo is the likelihood that all tour operators are free;
n is the number of tour operators in the system, is reduced density of the requests flow;
The average number of busy tour operators in the system (Nb) is equal to the reduced density of the requests flow (α):
(6)
, (7)
where No is the average number of companies that have no requests.
, (8)
where K3 is the load factor of a tour operator.
, (9)
whereKdt is the downtime factor of a tour operator.
, (10)
where M0 is the average number of groups waiting for the start of tour forming.
,(11)
where is the average waiting time before the start of tour forming;
is the number of tourist groups.
, (12)
where is the likelihood that all companies are engaged in the formation of the tour;
, (13)
where is the average number of groups in the course of service and in wait for service;
Findings
We can make the following conclusions based on the data obtained from Table
The actual costs of the company may not be the same as reflected in statistical reports. Therefore, the developed model can be improved by taking into account the impact of the shadow economy on tourism (Burov, &Atanov, &Andrijanov, & Sudakova, 2014).
Conclusions
We applied the software package for calculation of the optimum number of operators for a period of 5 years from 2006 to 2010. We provide the obtained data in Table
The sharp increase in the number of tour operators for the period from 2009 to 2010 happened due to the fact that many subdivisions of tour operators decided to work with China by their own, by creating separate companies. Similar restructuring trends are nationwide (Stepanova, 2016). For example, under the annex to the Agreement, the following entities of the Moscow Region being de facto integrated under the single brand were added in 2011: "Pegas", "Pegas Tours", "Pegas touristic".
Such businesses can be regarded as one single tour operator with a variety of sales channels. Similarly, the divisions of the Chinese Society for Tourism (CST) in Manzhouli and Hailar are registered as two independent companies and are included into the list of the Chinese part. In 2008, the optimum and the actual numbers of tour operators were equal. The 2008 was a year of prosperity of tourism related to the Chinese direction. The subsequent decline in tourist flow and an increase of the number of tour operators in 2009 and 2010, respectively, affected the entire tourism industry negatively. Currently, management of the tourism sector in the Trans-Baikal Territory is not effective enough. Such restructuring of the tourism industry and fragmentation of tour operators to the large number of small tour operators, has led to price competition. Tourism focused on price reduction instead of competing by improving tourism products (Kovács, & Nagy, 2013)
The urgency of application of mathematical apparatus for management of innovative activity in the tourist sector is revealed. The efficiency of management of the Trans-Baikal Territory tourism sector with the use of the constructed model is assessed. The optimal number of tour operators for minimizing the total cost of pursuit of activities by the subjects of tourism is defined.
References
- Burov, V.Y., Atanov, N.I., Andrijanov, V.N., Sudakova, T.M. (2014). Shadow economy and corruption as a form of economic crime. Criminology Journal of Baikal National University of Economics and Law, 4, 65–74. (In Russian).
- Jusoh, J., Mohamed, B. (2006). Tourists Infrastructure Provision Versus Successful Destinations; Case Study: Langkawi Island. Proceedings of 12th Asia Pacific Tourism Association & 4th Asia Pacific ChRie. June 26—29, Hualien, Taiwan. 873–879.
- Kovács, I., Nagy, G. (2013). Tourism in peripheric regions — the possibilities of thematic routes. Analele UniversităŃii din Oradea, 2, 220–228.
- Monich, I. P. (2011). The Management of the Innovative Activities in Tourism. Bulletin of Transbaikal State University, 11, 9-14. (In Russian).
- Monich, I. P., Kisloschaev, P.A. (2014). Systematic approach to the management of the tourism industry in the region on the example of the Transbaikal Territory. Baikal State University News of ISEA, 4, 45-50.
- Panasiuk, A. (2007). Tourism infrastructure as a determinant of regional development. Ekonomika ir vadyba: aktualij os ir perspektyvos, 1 (8), 212— 215.
- Spiriajevas, E. (2008). The impact of tourism factor for development of the south-east Baltic coastal — border regions. GeoJournal of Tourism and Geosites, 2, 118–128.
- Stepanova, S.V. (2016). General Trends and Features of Tourism Infrastructure Development in Russia’s Regions. Bulletin of Moscow University. SERIES 6: Economy, 3-2016, 68-84.
- Timothy, D. (2001). Tourism and political boundaries (Routledge advances in tourism, 8). London: Routledge.
- Vodeb, K. (2010) Cross-border regions as potential tourist destinations along the Slovene Groatian frontier. Tourism and hospitality management, 2, 219—228.
Copyright information

This work is licensed under a Creative Commons Attribution-NonCommercial-NoDerivatives 4.0 International License.
About this article
Publication Date
20 July 2017
Article Doi
eBook ISBN
978-1-80296-025-9
Publisher
Future Academy
Volume
26
Print ISBN (optional)
Edition Number
1st Edition
Pages
1-1055
Subjects
Business, public relations, innovation, competition
Cite this article as:
Monich, I. (2017). Innovative Mathematical Model of Optimization the Tour Operators Number in Boundary Regions. In K. Anna Yurevna, A. Igor Borisovich, W. Martin de Jong, & M. Nikita Vladimirovich (Eds.), Responsible Research and Innovation, vol 26. European Proceedings of Social and Behavioural Sciences (pp. 667-673). Future Academy. https://doi.org/10.15405/epsbs.2017.07.02.86