
Insurers and Insured Individuals Interaction as Basis for Persistent Agricultural Production Process


Abstract
The paper is focused on the issue of determining correct insurance rates, which are a key point in the interaction between insurers and the insured from the authors’ perspective. It should be noted that insurance is one of the tools supporting a continuous and uninterrupted production process, contributing to stability and persistence of achieved living standards. However, insurance rates determined incorrectly can cause either a downfall of insurance companies with insurance even worsening instability or unavailability of insurance services making pointless the instruments of ensuring stability. Insurance rates can be calculated in agricultural insurance on the base of conventional models, but rates might be understated in this case for an insurance company due to correlation of losses according to separate contracts. The authors propose a simulation model involving correlation of losses according to separate contracts to eliminate this shortcoming. Business activity outcomes of insured and non-insured farmers are analyzed. Simulation is carried out assuming the normalcy of crop yield distribution. Simulation relies on the approaches suggesting an insured event occurrence and losses arising according to separate insurance contracts. The final model results from the total probability formula. The developed model makes it possible to improve validity of insurance rates and affordability of insurance services for farmers without gaining in collapse risks of insurance companies.
Keywords: Simulationcorrelationriskagricultural insurance
Introduction
A risk is an avoidable component of any expanded production. Crop insurance is a very important instrument used by farmers to mitigate risks and cover losses caused by adverse natural conditions (Perez-Blanco, Delacamara & Gomez, 2015). Agricultural income insurance guarantees a fraction of the expected income to farmers in exchange of a regular payment (Ifft, Kuethe & Morehart, 2015; Kindaev & Moiseev, 2016). Therefore, mechanisms of mitigating risks implemented via insurance funds are in demand in economy. Insurance is a form of protecting public production and insurance fund-raising. It is quite natural that optimization of insurance funds is an issue relevant for insurance. Here interests of insurers can be contrary to those of the insured. Insurers tend to increase insurance rates due to correlation of losses in agricultural insurance, in case of a small territory suffering from an “unsuccessful” year, the insured might agree with these rates, but awareness of risks is changed in some “good years”; as the result, the insured demand reduction in insurance rates (Trifonov, Grichin, & Kovaleva, 2014).
Methods
The stated contradiction can be overcome by means of mathematical simulation. However, conventional models of insurance presuppose independence of losses in various insurance contracts. A model eliminating this inaccuracy is analyzed in this paper. The results of simulation allow analyzing the interaction between insurers and the insured.
Model of loss distribution and individual losses
Likehood of losses occurring
We consider a conventional approach to deal with individual losses (Falin & Falin, 2004):
(1)
Where – indicator function of losses occurring, – insurance compensation after losses occurring. The mean insurance compensation is mathematical expectation of random variable :
.
When crops insuring, it is proposed in (Baskakov, Кrylova, Selivanova & et al, 2016) to consider a drop in crop yield by share exceeding its mean value in the particular area over the last five years as criterion of losses occurring is:
(2)
Where – crop yields in year i.
We note that crop yield depends on a lot of factors, some of them are accidental (rainfall, average daily temperature over the period of vegetation), although there are also determined factors (grade of quality, amount of used fertilizers etc.) (Posypanov, Dolgodvorov & Zherukov, 2016). Therefore, a crop yield can be viewed as a function dependent on determined and stochastic factors:
,
Where – a set of determined factors influencing on the crop yield, – a set of stochastic factors effecting on the crop yield (Tashchiyan, Sushko & Grichin, 2015).
Assuming linearity of function and sufficient quantity of factors in set , we can suggest in terms of the central limit theorem that random variable has normal distribution with the function of density:
,(3)
Where – mathematical expectation – standard deviation .
Relying on the above-mentioned, is modeled according to distribution (3). The probability of event is calculated as (2). (4)
Random variable has normal distribution with mathematical expectation and standard deviation . Taking into account the result of (4), we obtain:
(5)
Where – Laplace’s function.
We point out that relation is variation coefficient of the crop yield. Hence, result (5) for is written as .
Results
Distribution of individual losses
We study the model of losses distribution. We proceed from the assumption that in case of an insured event losses are calculated as follows (Baskakov, Кrylova, Selivanova & et al, 2016; Lizunkov, Marchuk & Podzorova, 2015; Malushko, 2015; Kindaev & Moiseev, 2016):
(6)
where – mean farmers’ price per 1000 kilograms of a crop formed in the subject of the Russian Federation over a year before year i, when an insurance contract was signed according to the data of the Federal State Statistics Service; – area under crop. Provided that and are determined, distribution of the value described by formula (4) is calculated as random variable . As all are similar independent random variables with distribution (3), has also normal distribution with parameters and . The following parameters of normal distribution are obtained for , . The distribution function of random variable is written as equality (1):
(7)
Let us consider result (7) for diverse :
for .
For we obtain:
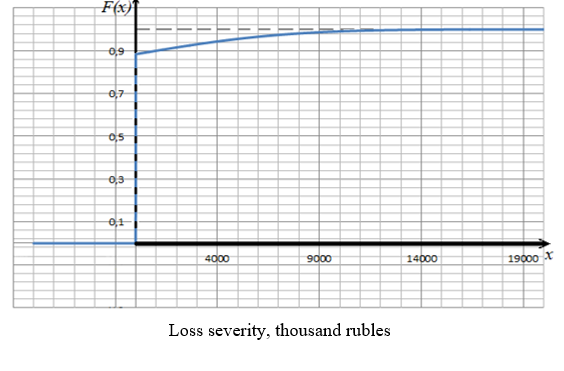
When calculating the distribution function of random variable , the distribution function of random variable was used mainly:
and the conditional distribution function of random is:
.
The distribution function of individual losses is plotted in Figure
Risk model for losses of cultivating crops
We address the simulation risk model for losses of cultivating crops. The model of individual risk of insurance is taken as a basis on assumption of involving the whole insurance market. Many scientists of the world develop tools for risks management (Ogurtsov & et al, 2008; Ibarra & Skees, 2007; Juyun, 2010; Yaghoubi & et al, 2011; Aimin, 2010). Let be a loss in terms of insurance contract – a part of a total insurance premium put to the insurance fund according to insurance contract – input capital of an insurer in this insurance portfolio. Here the value of
(8)
is an overall insurance fund or remaining assets of an insurance company for a certain set of insurance contracts (insurance portfolio). On assumption the insurance company involves an entire insurance market, is a determined value.
We consider forming . We suppose to be calculated as a certain share of an insurable value of yield, which is a product of a price and a planned harvest:
,(9)
– share (rate) of an insured value put to the insurance fund and equal in all insurance contracts.
It is not quite correct to deal with random variables as with the independent ones. It is more precise to consider random vector .
A set of uncorrelated normally distributed random variables can be obtained via standard procedures of generating random variables. However, we deal with random vector with normal distribution according to the correlation matrix different from a unit. Let us consider a generation algorithm of such vector.
We address a random vector distributed according to multidimensional normal law . It is the value that can be viewed as a model of crop yield of farmers in a particular area. The further study requires consideration of a normalized random variable:
(10)
Where - mathematical expectation and - standard deviation. As we noted above, covariance matrix is not a diagonal one, therefore, matrix (covariance matrix of random vector ) is not a unity matrix. We address linear transformation , where is non-degenerate matrix . In this case, . We searchmatrix , where is a diagonal matrix. Here, we suppose to be a random vector consisting of uncorrelated normally distributed components.
The problem stated above is a problem of matrix diagonalization . The eigenvectors of correlation matrix are to be determined for solution of the stated problem, matrix consists of these vectors. The eigenvalues influence on the dispersion of vector .
As the result, the following generation procedure of a random normal vector is obtained with a pre-set matrix of pair correlation:
1) determining a positively defined symmetric matrix of pair correlations with size ;
2) calculating eigenvalues . As matrix is symmetric and positively defined, the problem can be solved, and ;
3) determining an eigenvector for each eigenvalue ;
4) compiling matrix of eigenvectors as of matrix columns;
5) generating normal independent random variables , and and ;
6) carrying out linear transformation .
As the result of this algorithm implementation, we obtain a vector consisting of N random components with zero mathematical expectation and unit dispersion with preset matrix of correlations. Making the transformation inverse to transformation (10), required vector is obtained.
Results of simulation
We apply the algorithm formed above for agriculture, for cultivating oats, in particular. Ideally, from the researcher’s perspective, farm operations could be randomly assigned crop insurance coverage as a part of a controlled experiment (Qiujie Zheng, Holly Wang & Qing Hua Shi, 2014; Malushko, 2016; Nesteruk & Momot, 2014). We consider a 27-dimensional random variable and generate 250 values in package MATLAB. On the base of empirical information on oats yield over the period 1981 to 2013 in districts of Penza region, we estimate a correlation matrix used as input data. Applying this matrix and the above-mentioned algorithm, we obtain 250 probable results of crop yields. Relying on formulae (2–6), we calculate results of insuring oats at diverse rates of insurance fees (see Formula (9)). The results of simulation are given in Table
We deal with the algorithm without taking into account the correlation of data to compare the obtained results. The above-mentioned procedure is used. The results of algorithm implementation are given in Table
It is seen in Table
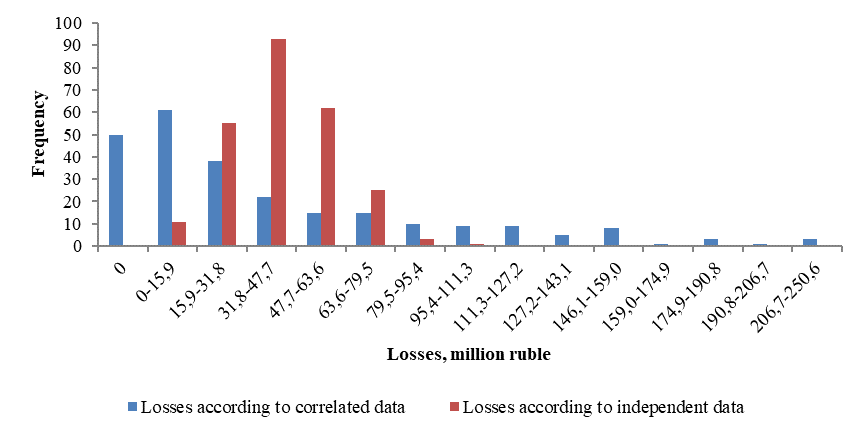
As one can see in Figure and Tables, all insured farmers are likely to bear losses at the same time, as the result, an insurance company might face significant financial losses, but no company can overcome these risks even if the insurance rate is high. If the insurance rate is too high to form insurance fees, the insured might refuse to insure themselves; that is also not profitable to anybody (Shabashev, Trifonov & Verzhitsky, 2014). Taking into consideration that Penza Region is in the area of risk farming, the likehood of a “bad” year is quite significant.
Conclusion
The following conclusions can be made:
1. A calculated value can be understated significantly when using conventional formulae for determination of insured risks caused by the drop in crop yield provided that an insurance portfolio is formed of nearby farms. We note that a wrongly assessed risk might be insignificant for some years under favorable conditions, although the consequences might be disastrous in a “bad” year.
2. When forming an insurance portfolio of nearby farms, one should probably make emergency funds of insurance companies over some years and compensate insurance losses in a “bad” year by reserves accumulated in previous years.
3. A risk can be reduced via widening the area of insurance. However, it is possible only for big companies.
To sum up, insurance is one of the most efficient tools of risk management in agriculture. Management of such risks is based on correct calculating current value of future payments, as the consequence, on adequate simulation of financial and insurance risk processes.
Acknowledgements
This research is funded by RFBR, grant 16-36-00275 mol_a.
References
- Aimin, H. (2010). Uncertainty, Risk Aversion and Risk Management in Agriculture. Agriculture and Agricultural Science Procedia, 1, 152-156.
- Baskakov, V.N., Кrylova, Е.К., Selivanova, А.V. &et al (2016). Insurance of crops and perennial plantings with state support: actuarian expertise. (in Russian) Strakhovanie urozhaya selskokhozyaistvennykh kultur I posadok mnogoletnikh nasazhdeniy s gosudarstvennoy podderzhkoy: aktuarnaya expertiza; ed. by Prof. V.N. Baskakov, 320.
- Falin, G.I. & Falin, A.I. (2004). Theory of risk for actuarians in tasks. (in Russian) Teoriya riska dlya aktuariev v zadachakh. Nauchny mir, 240.
- Ibarra, H. &Skees, J. (2007). Innovation in risk transfer for natural hazards impacting agriculture. Environmental Hazards, 7, 1, 62-69.
- Ifft, J., Kuethe, T. &Morehart, M. (2015). Does federal crop insurance lead to higher farm debt use? Evidence from the Agricultural Resource Management Survey (ARMS), Agricultural Finance Review, Vol. 75, Iss 3, 349 – 367.
- Juyun, Y. (2010). The Optimization Path and the Integration Mechanism of Agricultural Insurance in the Charge of Government. Agriculture and Agricultural Science Procedia, 1, 258-261.
- Kindaev, A.Yu. & Moiseev, A.V. (2016). Problems of interaction between insurance companies and farmers. (in Russian) Problemy vzaimodeystviya strakhovoi kompanii s selskokhosyaistvennymi organizatsiyami. Vestnik of Samara State University for Economics, 5(139), 72-76.
- Lizunkov, V. G., Marchuk, V. I. & Podzorova, E. A. (2015). Identification of Criteria, Features and Levels of Economic and Managerial Competencies Development for Bachelors in Mechanical Engineering. Procedia - Social and Behavioral Sciences, 2015, Vol. 206, 388-393.
- Malushko, E.Y. (2016). Developing economic and managerial competencies of bachelors in mechanical engineering. SHS Web of Conferences, 28, Article number 01063, URL : http://www.shs-conferences.org/articles/shsconf/abs/2016/06/shsconf_rptss2016_01063/shsconf_rptss2016_01063.html.
- Malushko, E.Yu. (2015). Use of virtual learning system for educating students with disabilities and special needs. 2nd international multidisciplinary scientific conference on social sciences & arts SGEM 2016: conference proceedings, Book 1. Psychology & psychiatry, sociology & healthcare, education, Volume 2, 26 Aug.-01 Sept. 2015,Albena, Bulgary, 1155-1160.
- Malushko, E.Yu. (2016). Applied use of ISPRING software products to address the issues of training, monitoring and control in the organization. (in Russian) Prikladnoye primeneniye programmnykh produktov ISPRING dlya resheniya voprosov obucheniya, kontrolya i upravleniya v organizatsii. Proceedings of VII International Scientific Practical Conference “Innovative Technologies in Engineering”, Yurga Technological Institute, Tomsk: Publishing house of Tomsk Polytechnic University, 282-284.
- Nesteruk, D.N. & Momot, M.V. (2014). Information Technology of Estimation and Forecasting Innovative Activity Based on Distributed Data Input. Applied Mechanics and Materials, Vol. 682, 579-585.
- Ogurtsov, V.A., Van Asseldonk, M.P.A.M. &Huirne, R.B.M. (2008). Assessing and modelling catastrophic risk perceptions and attitudes in agriculture: a review. NJAS - Wageningen Journal of Life Sciences, 56, 1–2, 39-58.
- Perez-Blanco, C.D., Delacamara, G. & Gomez, C.M. (2015). Revealing the willingness to pay for income insurance in agriculture, Journal of Risk Research, DOI:
- Posypanov, G.S., Dolgodvorov, V.Е. & Zherukov, B.H. (2016). Plant science. (in Russian) Rastenievodstvo, 612.
- Qiujie Zheng, H. Holly Wang & Qing Hua Shi (2014) Estimating bivariate yield distributions and crop insurance premiums using nonparametric methods, Applied Economics, 46:18, 2108-2118
- Shabashev, V.A., Trifonov, V.A. &Verzhitsky, D.G. (2014). The problems of developing the ecological market of the region. Applied Mechanics and Materials, Vol. 682, 591-595.
- Suzdalova, M.A., Politsinskaya, E.V. &Sushko, A.V. (2015). About the problem of professional personnel shortage in mechanical engineering industry and ways of solving. Procedia - Social and Behavioral Sciences, Vol. 206, 394-398.
- Tashchiyan, G.O., Sushko, A.V. & Grichin, S.V. (2015). Microsoft Business Solutions-Axapta as a basis for automated monitoring of high technology products competitiveness.IOP Conference Series: Materials Science and Engineering, Vol. 91, Article number 012065, 1-6.
- Trifonov, V.A., Grichin, S.V. & Kovaleva, M.A. (2014). Price differentiation as economic and mathematical model of increasing the competitive pover of a company.Applied Mechanics and Materials, Vol. 682, 606-612.
- Yaghoubi, J., Shokri, M. E. & Gholiniy, J. M. (2011). Assessing agricultural insurance agents’ attitude towards e-learning application in teaching them. Procedia-Social and Behavioral Sciences, 15, 2923-2926.
Copyright information

This work is licensed under a Creative Commons Attribution-NonCommercial-NoDerivatives 4.0 International License.
About this article
Publication Date
20 July 2017
Article Doi
eBook ISBN
978-1-80296-025-9
Publisher
Future Academy
Volume
26
Print ISBN (optional)
Edition Number
1st Edition
Pages
1-1055
Subjects
Business, public relations, innovation, competition
Cite this article as:
Moiseev, A., Lizunkov, V., & Kindaev, A. (2017). Insurers and Insured Individuals Interaction as Basis for Persistent Agricultural Production Process. In K. Anna Yurevna, A. Igor Borisovich, W. Martin de Jong, & M. Nikita Vladimirovich (Eds.), Responsible Research and Innovation, vol 26. European Proceedings of Social and Behavioural Sciences (pp. 532-540). Future Academy. https://doi.org/10.15405/epsbs.2017.07.02.68