
Inefficiency in Organizations and Wellbeing


Abstract
Can an organization be considered as a living organism? In which terms can external causes change an organization? How can we reinforce the coherence of an organization? What are the side effects of such approach? The aim of this study is to explain the organization’s failures while respecting the different corporate agents (from shareholders to employees). The key point is the way of using the existing methods: tests, counting, financial analysis and so on. The solution we propose is based on a socio-cognitive understanding of the group or sub-groups of people which allows us to explain behaviours. Results from a lot of experiences have completely confirmed our hypothesis that the efficiency of an organization can be drastically increased by suppressing human deadlocks due to a wrong adequation between people, jobs and places. Reinforcing the internal cohesion of an organization leads to an independence regarding external factors, or a better adaptability to the environmental situation. More than that, this kind of analysis provides an increase of wellbeing for every member of an organization. Few studies investigate the impact of human wellbeing in business. It is highly relevant to consider personal socio-cognitive variables as a coping mechanism that may be useful to improve organization’s profits. Our research corroborates significant relationships between human and ecological attitudes, and sustainable profits achieved by the organization.
Keywords: Financial analysishuman wellbeingsocio-cognitive understandingbusiness
Introduction
“Happiness” at work. After having been launched in 2000 by Google, this term has by now acquired a large popularity, though it is as a matter of fact erroneous. One should rather use the vocable «satisfaction», knowing that satisfaction is the result of an effort. The consequence of true satisfaction is interest and, hence, true efficiency in work. Experiments show that children at liberty to choose their own learning process develop more quickly and will learn better than those who are burdened with a predetermined learning rhythm (Fink, 2003; Kayser, 2011; Laplane et al., 2015). Such kind of an experiment recently conducted in France (Jean-Lurçat nursery school in Gennevilliers, 2011-2014) by Céline Alvarez is totally trial (Alvarez, 2016). “My objective”, explained Mrs Alvarez, “was to propose an environment based on the great principles of human being blooming, thanks to the contribution of the neurosciences and work of Maria Montessori.” Why should not the same approach be effective in organizations? Adults also crave to learn and to discover, so let us offer them an environment enabling them to do so and let us observe the results.
The author was thus induced to investigate theoretically about this topic. The present work is also based upon theories introduced by three major scientific and medical researchers: Hans Selye, whose first paper about stress was issued in 1936 in “Nature”; Lev Vygotski, who, in 1926, published the basis of what is presently known as the socio-cognitive theory; Paul Diel (1953) who created the Psychology of Motivation in 1947.
The method used by the author, called SCIA (socio-cognitive intelligent approach), has been developed since 2005-2007 in cooperation with Smirnov, & Lashkova (2011). Its purpose is to evaluate the potential of the persons towards any issue of the organization they belong to. This method has been first tested and validated on more than 70 small or medium sized organizations before being applied in very large organizations. The results have been beyond the forecasts because using this method has led to strengthening of the wellbeing of every individual at work. This wellbeing in turn raised cravings for a better ecological integration of the organization in its own environment.
A company is a complex organization having several functions. These functions interact with each other. Analysing these interactions as well as the economic dynamics by the way of the persons belonging to an organization allows studying consequences in the short and medium term.
Any organization must know and evaluate its customers' projects to evaluate the possible risks to be taken. This method allows us to compare various projects in a rational and uniform way, to rate them in an objective manner and thus to be able to take essential decisions (Reinert, 1990). The results are quantified graphs based on the collected data as will be shown hereafter.
A project is carried by a whole team and not only by a General Manager or a President. Systematically using such tool would be a major asset and a pledge of security concerning the R.O.I. (Return On Investment) of projects.
Starting point
What was the real starting point of this research? A customer, the operational President of a branch of a large industrial firm addressed my company “ActiveManagement” with this sentence “I know, without knowing while knowing what does not go well within my organization, so can you help me to define this problem?” This sentence shows the degree of intuition a leader may have while pointing the feebleness of such ill-founded intuition (Solotareff, 2007, 2011a, 2012). This inaccuracy will impact the whole organization and each member of this organization will feel more or less uneasy because of this blur which will prevent a clear definition of the tasks to be achieved. Identification and clarification of this blur leads to a release of energies and brings wellbeing in all the tasks to be achieved. On the contrary, if nothing is done to clarify it, then the blame is put on external events as the alleged causes of this internal inefficiency of the organization.
Objectives
How is one to solve the internal problems of an organization (“internal” as implied in the term “internal medicine”)? An internal problem is a dysfunction of the organization to be overcome, involving several factors all of which are dependent on each other. Improving one of these factors separately often leads to the worsening of another one. (For example: improving the cash-flow by reducing stocks often leads directly to a degradation of the service to customers by lengthening the deadlines).
In studying this problem, the author arrived at the conclusion that the evil of the organization is in the elements constituting this organization, namely the place of people in the organization and their individual feelings, more than in the quality of management or the figures collected by the way of an audit. Analyzing the persons in the context of the organization allows the author to raise the questions of the wellbeing at work. This wellbeing is related to the satisfaction of the person in his or her job. How then can we make the employees satisfied, proud of themselves? Which is the right place of an employee in an organization, which is the right job for this particular person considering his or her personal abilities?
Specifications
Specifications were laid down on this basis. The following constraints were drawn up in order to diagnose the causes of “discomfort” in the organization:
identification of the three principal disturbing factors;
demonstration of undeniable results to the Board as well as to the employees and Unions;
duration of the investigation: one week.
Major problem
Can one equate a human organization with a living organism? If so, how should it be studied?
Methods
How to diagnose and not to audit? The purpose of the study is to detect flaws and internal problems of an organization while respecting the people inside the organization. First of all, let us define the term "satisfaction": Satisfaction is the result of an effort. Which method should be used in this case? The answer is given by the analysis of the subject in itself and by its objective: human satisfaction. The method used must therefore take into account the attitude of people, through their own reactions as well as through their inner personal feelings (such as an ability to fall asleep easily, to smile, to communicate without aggression etc.). Being a part of a group, every person is assessing the socio-cognitive potential of this group. This potential becomes the key to interpret the group's reactions to any topic discussed.
We have developed a set of tools which is used to measure all the key points of an organization which suffers from internal problems. The obtained results are quantitative. They are shown without any comments or judgment. The point is all data are gathered among employees who have to participate and to feed the database in order to be involved. This participation motivates and already creates a good dynamics. Through the analysis and thanks to the means and variance, all outlier points can be removed. The computer allows all types of combination from simple analysis to strategic positioning of people in the organization predicting the way each subgroup will behave and interact with others. It is a powerful tool for human resources who seek the right place for the right person in the right job (which is the most difficult problem).
In parallel, a correlation can be observed between the organization's results and its own structure.
Software is written in an oriented-object language on web servers in order to be available all over the world. Computers are just a tool, and do not replace the consultancy, because human personal interviews or observations cannot be replaced by a computer. The human contact is mandatory; this creates already a tremendous hope for a restructuring plan. Moreover, consultants can capture all informal information, and detect what is wrong in the atmosphere not according to their own feelings but with a set of questions they have to answer every day. It is necessary to mention again that the application of statistical analysis provides an objective report of the present situation of this organization. We have also been using such software as Iramuteq and DtmVic.
Findings
Organization seen as a living organism
Let us use analogies: what is a living organism? Every living organism is born, grows and dies. A living organism is composed of several systems interacting with each other. The simplest organism is unicellular and has got a membrane separating it from the outside world. It absorbs, transforms and rejects outside material, which is similar to the operation of a simple commercial firm. The most complex organization is the human being who has got several systems: the nervous system, the blood system, the respiratory system, the digestive system, the lymphatic system.
Our demonstration consists of measuring the coherence between the different players in the studied organization and of showing that the higher coherence matches the greatest efficiency of the organization.
Consistency is addressed using different measures and tools to understand the problematics of organizations; efficiency is measured by the ability to achieve the goal, namely an increase in earnings for companies, success in competitions for a football club and so on.
Let us review the various tools developed and see how we can measure the coherence obtained. At the same time, if the consistency is improved, let us check if the results are also improving.
In our studies, we noticed that the more the group increases its cohesion, the greater the feeling of wellbeing is for every individual. This "wellbeing" is actually a real satisfaction relying on a given effort because, if the goal is reached, it is because a certain amount of work has been done. For example, Porsche is a firm whose employees are proud of the quality of their vehicles, and it is also the most profitable car manufacturer. To win a competition is really satisfying because there has been an actual training and effort made to achieve the goal. If the winning team is largely superior to the losing one, the resulting satisfaction will be smaller than if both teams are of the same level.
Convergence of views
The method allows one to detect if the employees' vision differs from the leaders' vision and if the various leaders' vision differs from the shareholders' one. Here is how:
Let us take an example: Q1 is a question addressed to employees of hierarchical level n-3 with the quantification from 1 to 7. After all, the responses have been collected, average and variance are calculated. The result may be 2.3 on average with a variance of 1.2. The same question put to the employees of hierarchical level n-2, i.e. their direct managers, can lead to an average of 4.4 for evaluation with a variance of 0.3.
What matters is not the numbers but the difference between these figures which actually measures a sort of disagreement between two groups of people. (For example, some will evaluate that there is enough cleanliness in the company because of an evaluation of 2.3 which seems satisfactory to them whereas for others, the level should be up to 4.4. What is important in this case is not a feeling of different groups, but a feeling measured statistically using a common basis of intuitive evaluation).
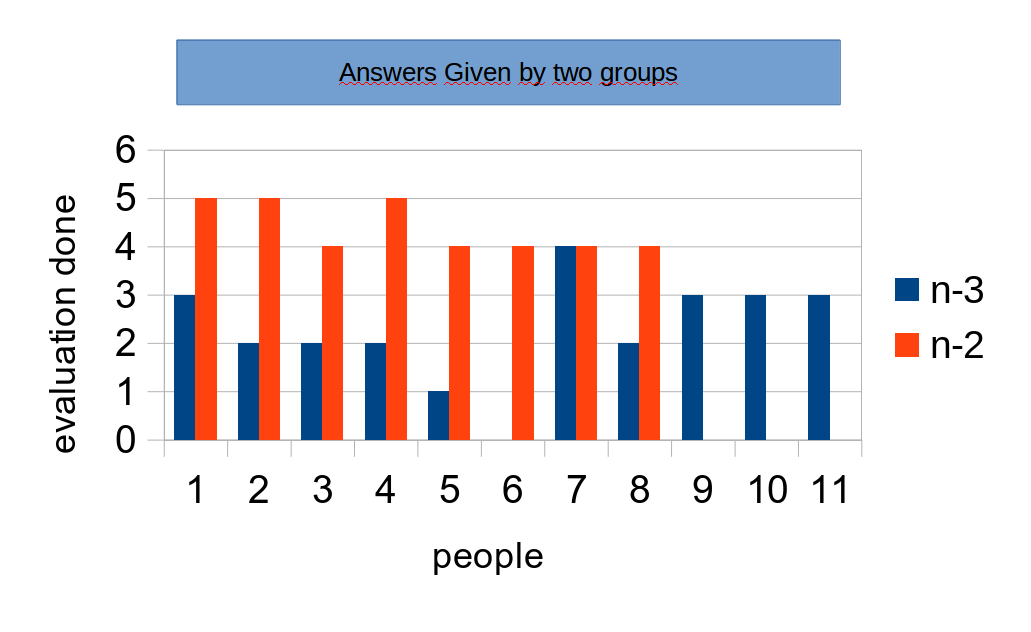
Confidence intervals between these two measures do not overlap, thus demonstrating that the visions of management level n-3 and n-2 are different. How then can managers and employees communicate? They do not trust each other anymore. Each has a different vision of the same subject.
Having representing it on a graph (see Figure
Figure
Drawing internal problems in an organization
The problemogram (a term devised by the author) can take into account different components of discomfort or internal problems. A ranking based on the importance and frequency allows, starting from the list of all the identified problems, to draw a picture of the problems identified, their occurrence, importance, urgency to draw up an Eisenhower matrix. Here is an example: let us include such problems to the list as “Export Taxes” as it is a major problem occurring every day; “Taxes” occurs as well, but once a month when reports to administration have to be done; “Unskilled employees”; “Low quality of parts due to bad tools or misused tools; there is permanent complaint about salaries; contracts are not well established, without defined terms and conditions; and finally “$ value “ – an external dependency of the exchange rate with dollar.
This frame can be represented by the scheme in Figure
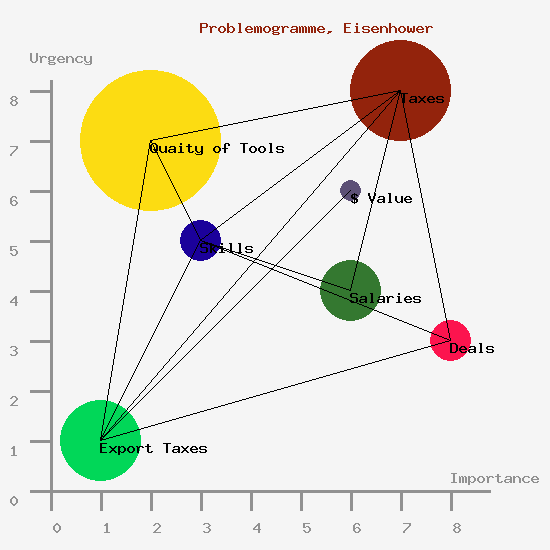
In Figure
In the previous example, it becomes clear that problem 3 of the qualification of people, which is actually a very small problem to overcome, can solve many other problems. Furthermore, it is an internal problem. The second problem arises due to dependencies related to tax problems 1 and 2. This problem can be solved by negotiating with the government to substantially break the deadlock. So the immediate actions to be taken are: first of all, to educate and to train people, to organize courses, and, in the second place, to negotiate with the administration.
Deadlocks situations are common in business, and this is the most effective way to find the best strategy. We have to keep in mind that recurring problems are the source of a lot of demotivation and inefficiency. This demotivation makes people passive, nervous and could lead to "burnout". Thus, we introduce the frequency which shows the degree of nervousness created in the company.
Detection of motivating forces in organization
The semantic analysis allows establishing the center of interests of the people concerned. As a matter of fact, according to the subject of the free question asked, such as: "what does a goal mean for you?", we may analyze the answer in its semantics form via a statistical analysis which allows us to point out subjects which concern most people. According to the groups and subgroups of individuals, it is possible to define what topics are to be addressed as major ones. With this knowledge, we can focus on subjects which will be well perceived and which will have the best impact. Again, we see that the consistency of values among different individuals is fundamental. This analysis highlights the groups of people who do not share the same values as the organization.
Let us consider the case by the example of the navy:
It is clear from the following example that there are three categories of staff: the command post that has values for the military mission, honor, motherland; noncommissioned officers (NCOs), whose operational positions are concentrated on the profession which obliges them to deal with "very sophisticated on-board machinery" that exists only on warships; and, finally, sailors ― people who are waiting for orders and having respect to their execution.
Communication exists only through discipline and not through the feeling of belonging to a single entity. The energy needed to enforce an order is much higher as it would be if there was only one motivation shared by all, which could be such as to assist ships in distress, or protect a given area during combat operations (Kutsenko, & Lashkov, 2012).
The explanation is given to all the members of the crew, which lowers the tensions on board and allows executing orders during training twice times faster.
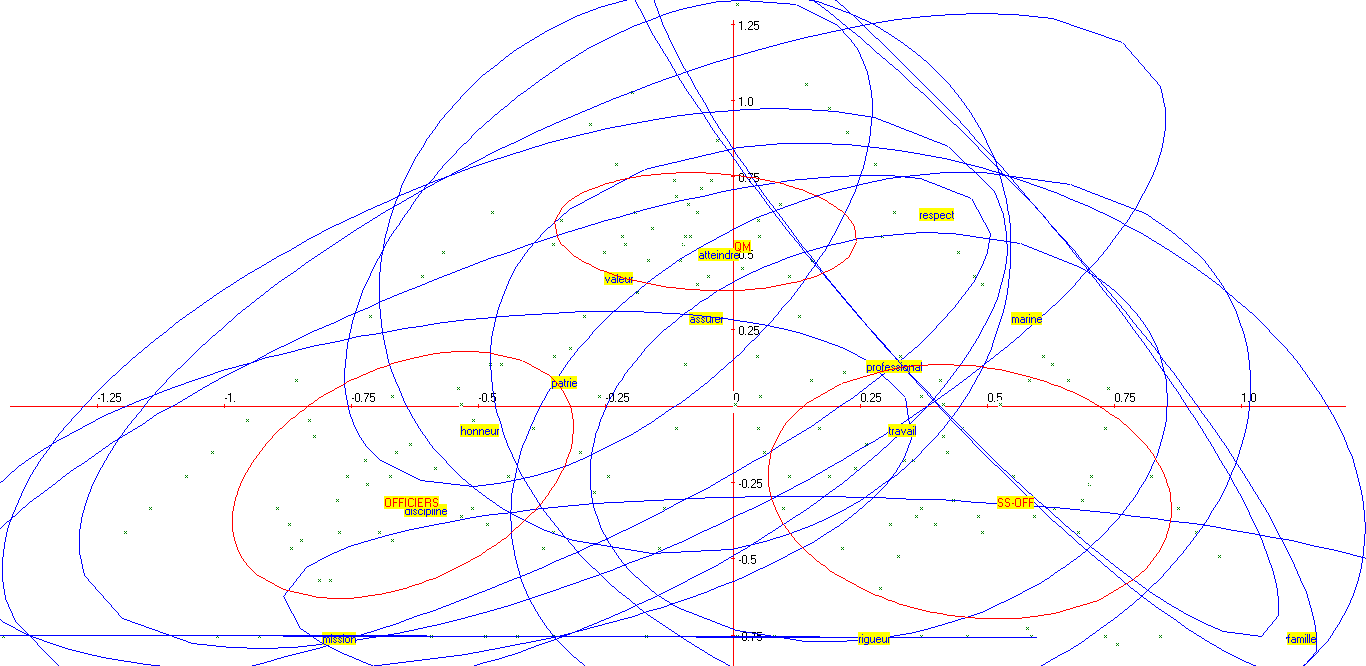
Three broad categories: Officers, NCOs, Sailors. The words used most frequently are Honour, Discipline, mission, homeland (Officers); professional, work, rigor (NCOs) and finally reaching goal, sure, value, respect (sailors). These three spheres (red on the graph) do not overlap.
True organizational chart
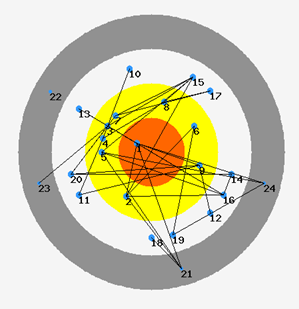
The official organizational chart rarely reflects reality; it is only a presentation of the so-called authority. A serious concern in an organization is the fact that those who are responsible on paper (i.e. according to the chart) are not at all informed of what is going on in reality and, therefore, take wrong decisions and very often sign papers involving their responsibilities without a clear understanding of the issue. The sociogram is created from a field survey of all participants by asking who the people one can trust and distrust are. The square matrix obtained is then translated into a graph (see figure
Example: The distribution is done on sociogram-4 levels of communication. The number of connections between people then determines the level of social communication. The graphical representation helps to understand the communication nodes in the company.
Harmonious consistency in organizational growth
For a company knowing where the added value is created, we can analyze the growth of input data and compare them with outputs. If the growth of inputs (purchase of raw materials) is faster than the growth of outputs (results), it becomes obvious that the company is reducing its ability to make profit and goes straight towards difficulties or bankruptcy. This is a predictive analysis. When this process starts, there is not any consequence yet resulted from the profit and loss (P&L). Many firms become aware of this fact too late. Moreover, if we add intermediate variables such as Earnings Before Interest, Taxes, Depreciation and Amortization (EBITDA), then we see where and how the value added is created. Again, it is often observed that the added value created in production disappears or is at least greatly reduced afterwards.
It is obvious that in this type of measurement, we have a simple approach to organizational coherence. Our various tests and measurements corroborate each experiment. This is easily explained by the fact that everyone who feels in tune with the required work is more efficient and less tired. According to Shannon, we know that when somebody makes the same gesture for the second time he spends half the time doing it. And with each repetition one gains in efficiency, but if the guidelines change, one loses efficiency. At present, following modern approaches, many organizations try to adjust to the market in changing the way they operate instead of rethinking the whole process. This induces a lot of changes which are very unproductive. This loss of efficiency very quickly affects the sense of "wellbeing", and people start to feel useless.
Figure
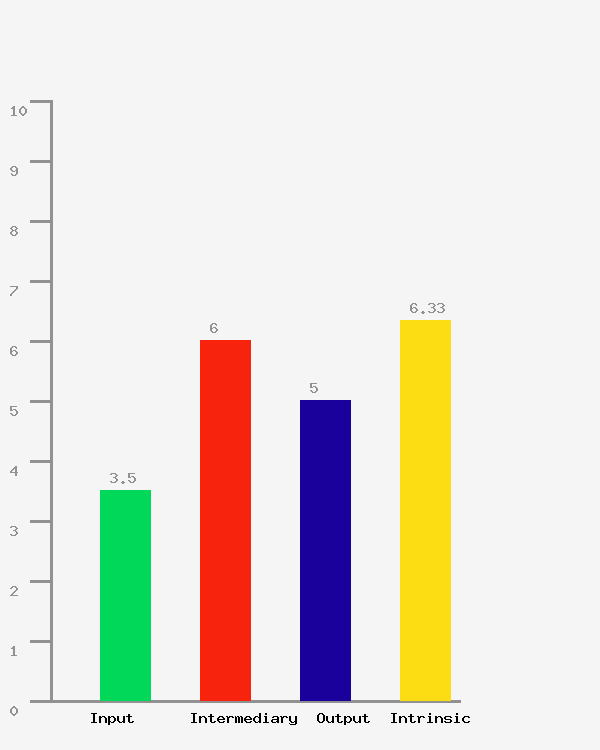
We can see in Figure
Conclusions
The set of tools developed enables to verify the consistency of results in each individual case. These tools differ from each other and are complementary: semantic analysis, tests, analysis of variations, sociogram, problemogram. They always give consistent and convergent results in any analyzed organization. In this sense, the approach reveals a certain reality and characterizes it. This is possible because all existing phenomena are governed by laws, already known or yet unknown.
Though still incomplete, the tool we have developed can significantly improve the results of the organizations. It is more than that; this tool provides immediate solutions to improve the employee's life. The presentation of the results in a quantitative way without any value judgment allows acceptance of results and immediate acceptance of needed corrections. This last point makes our method particularly efficient and encourages participants to implement the recommendations by creating a positive dynamics. The real dynamics is a dynamics which involves human ecology. Human ecology means being in harmony with oneself and with the environment. But it is impossible to apply this ecology on a large scale (companies, firms, corporations) unless every individual starts applying it in one’s own daily life.
The reduction of tension resulted from the intervention of consultants, including their presence at all levels to collect data (rhythms, recording and measurements, investigations, etc.), takes place in a week.
As only three major actions are recommended, the upcoming response plan is clear and encourages the expected collective participation. But, it is most important to recreate people's confidence in their work, highlighting their daily actions. Personal development of every person is valued by actual actions, not words, and this gives everyone a sense of wellbeing. As internal tensions become smooth, financial results start increasing as a simple consequence of the actions taken.
References
- Alvarez, C. (2016). Les Lois naturelles de l'enfant: La Révolution de l'éducation. Les Arènes,
- Diel, P. (1953). Psychologie de la motivation, Payot, Paris.
- Kayser, V. (2011). Pédagogie Kayser. Entre approche sensorielle Montessori et théorie des intelligences multiples de Gardner. Centre de recherche DMDEA, Montréal.
- Kutsenko A. I. Lashkov E.G., (2012). Corporate identification of business: forming, development, tools. LAP LAMBER Academic Publishing Gmb& Co.KG.,
- Laplane, D., Lambert, J.F., Stoleru, S., (2015). La libertéet le cerveau, Parole et silence,
- Reinert, M. (1990). Alceste, une methodologie d'analyse des donnees textuelles et une application: Aurelia de Gerard De Nerval, Bulletin de Methodologie Sociologique, 26(1), 24–54
- Smirnov, E.G.Lashkova; (2011). Social development of modern Russian society: achievements, problems, prospects: collection of scientific works. Novokuznetsk: Prod. Center of SIBGIU.
- Solotareff, J. (2007) L’esprit en question, Ellebore.
- Solotareff, S. (2011a) Management of a sense as a modern trend of enterprise management: concept, prospects, challenges. Social development of modern Russian society: achievements, problems, prospects: collection of scientific works. Novokuznetsk: Prod. center of SIBGIU, pp. 108-114
- Solotareff, S. (2011b). Human resources management of the entity in system of Aktivmanagement. Alternative fuel, International scientific and technical journal. 6 (60), 29-32.
- Solotareff, S. (2012) La Gouvernance Essentielle, Paris, Ellebore
Copyright information

This work is licensed under a Creative Commons Attribution-NonCommercial-NoDerivatives 4.0 International License.
About this article
Publication Date
20 July 2017
Article Doi
eBook ISBN
978-1-80296-025-9
Publisher
Future Academy
Volume
26
Print ISBN (optional)
Edition Number
1st Edition
Pages
1-1055
Subjects
Business, public relations, innovation, competition
Cite this article as:
Solotareff, S. (2017). Inefficiency in Organizations and Wellbeing. In K. Anna Yurevna, A. Igor Borisovich, W. Martin de Jong, & M. Nikita Vladimirovich (Eds.), Responsible Research and Innovation, vol 26. European Proceedings of Social and Behavioural Sciences (pp. 951-961). Future Academy. https://doi.org/10.15405/epsbs.2017.07.02.123