
Somatic evolution motor, perceţie and representation to children in athletics


Abstract
Developing strength, mobility, coordination and balance in the 10-12-year-old children, practising athletics events is of great importance in the training process. This paper is an experimental observation study, by means of which we aim to highlight the possibility to improve the level of speed, strength, mobility, coordination and balance in the 10-12-year-old children practising specific athletics events. In order to establish the dynamics of child development, we performed the following: an initial test, which had an observation purpose, and a final test, as demonstrative achievement. In order to develop the athletes’ behaviour during the experiment (lasting for 14 weeks, 2 hours a day, 4 trainings per week), we practised at the end of each practical lesson, for 10 minutes, the following training: on Mondays - strength exercises, on Tuesdays - speed exercises, on Thursdays - mobility and balance exercises and on Friday - coordination exercises. The results of the children who took part in the experimental group (12 children) were better in the final evaluation. The progress recorded for the average values emphasizes the efficiency of the applicative intervention oriented towards the increase in the skill level and of the perception capacity and movement representation. The findings revealed the following fact: after 14 weeks of training with the 10-12-yearold children, the level of the somatic development, the level of the development of speed, strength, mobility, coordination and balance and the level of the perception capacity and movement representation improved.
Keywords: coordinationbalancemobility and strength
Introduction
From 10 to 12 years of age, the children’s muscular system has an intense development, adapts
easily to overwork, improves intra- and inter-muscle coordination, improves muscle elasticity, increases
muscle mass and joint mobility. Generally speaking, the process of development and differentiation of the
skeletal muscle ends.
Research on the motor performance has a considerable degree of practical penitence by the fact
that “measurements can be used to predict the ability of a person in a certain position or a certain activity”
(Matthews, Deary, & Whiteman, 2012). The psychomotor skills necessary for practising certain subjects /
sports events, “can be detected early, but approaching their education / development is a process that
depends on the body’s capacity to adapt and to progress” (Raţă, & Raţă, 2006). The motor performance is
a “great result of a conscious systematic activity which implies mental efforts, and in some fields, such as
sport, also multiple physical efforts, often materialized in records, progress” (Deliu, 2007).
All the life preparation must aim towards “achieving an optimal level of fitness and technique”
(Raczek, 1977), since athletic performance is based on the relative harmony of all the psychomotor skills
as a whole. Activity, in general, and sports activity, in particular, is made up of technical elements /
specific movement actions associated with the “psychic ability of mobilization during their execution
times, with the psychic recovery ability and mental resistance to stress, with the perceptions of space and
time, with the kinaesthetic sensations necessary for controlling” the body in many situations (Colibaba-
Evuleţ, & Bota, 1998).
Skill training has an important role in determining, generically speaking, all the athletes’
efficiency in training and competitions. This includes “a whole system of measures ensuring a high
functional body capacity by the high level of psycho-motor skill development, optimal values of morpho-
functional indices, full possession of the physical exercises used and perfect health” (Dragnea, 1996).
Popescu-Neveanu (1978) believes that performance is “the result of an activity which exceeds the
common level, being superior to others”. The sports competition is actually a “system of regular or
occasional contests held after a sports calendar after an especially-drafted regulation” (Encyclopedia of
Physical Education and Sport, Volume IV, 2002).
Materials and methods
The purpose of this research is to highlight the dynamics of the level of development of the motor
capacity represented by the development of strength, mobility, coordination and balance. The main
objectives for carrying out this research topic which resulted from the formulation of the topic and the
need for theoretical foundation, were the following: knowledge of the theoretical bases on the
development particularities of the children included in the groups of athletes practising athletics;
knowledge of the index values which assess the development of skills specific for athletes and their
evolution at the age of 10-12. The tasks developed for achieving the objectives of this research were:
setting the research topic, the purpose, the objectives, the hypotheses, the methods, the sample included in
the research, the testing and the evaluation data, the assessment indicators, the applicative interventions in
line with the hypotheses, and also the application of the assessment tests, the collection, the processing
and the interpretation of data, the knowledge of progress and the drawing of conclusions. In our work we
started from the following hypotheses: during the four months of training, the level of somatic
development of the 10-12-year-old children improved; if in the educational process of the 10-12-year-old
children we use strength exercises, mobility, coordination and balance, their level improves; the use of
coordination and balance exercises at the age of 10-12 increases the perception capacity and the
movement representation. The experiment involved 12 children, 10-12 years of age, from the CSS Bacau.
The observation experiment began on 1st September 2015 with the initial assessments and was completed
on 30th December 2015 when the final assessments were performed. In conducting the study we used the
following research methods: bibliographical study; pedagogical observation experiment; testing,
sampling; statistical and mathematical method; graphical method. The statistical indicators that we
calculated were as follows: arithmetic mean (X); standard deviation (s); maximum value (V max) and
minimum value (V.min). In order to assess the athletes’ development we used the following:
(abdomen) for assessing the abdominal muscle strength,
position (back) for assessing the back strength, hip mobility to assess flexibility] and
coordination (
made, we used, throughout the period of research, topics aimed at acquiring the technical elements of
athletics and topics aimed at developing strength, mobility, coordination and balance by alternating them.
During the four-week training sessions, at the end of each practice, 10 minutes of special training were
performed as follows: on Mondays - strength exercises, on Tuesdays - speed exercises, on Thursdays-
mobility and balance exercises and on Friday coordination exercises. The means used were changed at the
end of each stage of training.
Results and discussions
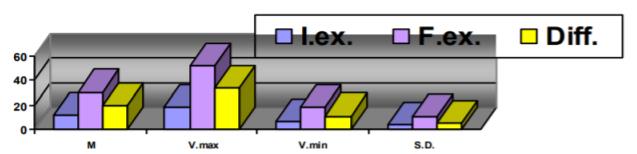
After recording the results of the initial and final assessment tests, these were processed and
analyzed. In interpreting the data, we relied on the analysis of the arithmetic mean values, of the standard
deviation, of the maximum and minimum values.
The data processing, which assessed the dynamics of the somatic development based on the
arithmetic mean, the standard deviation, the maximum and minimum values, highlighted a series of
issues.
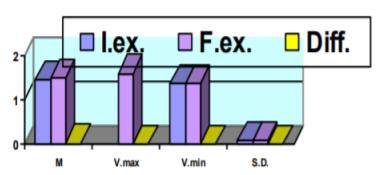
For
the arithmetic average from 1.47 m in the initial evaluation to 1.49 m in the final evaluation; an increase
in the maximum value by 1 cm, from 1.60 m in the initial evaluation to 1.61 m in the final evaluation; an
increase in the minimum value by 1 cm from 1.38 m in the initial evaluation to 1.39 m in the final
evaluation; maintaining a homogeneity of the group underlined by the same value of the standard
deviation of 0.07 in the two tests.
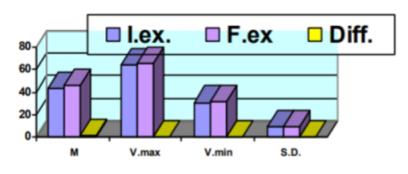
For
in the arithmetic average from 43.67 kg in the initial evaluation to 45.25 kg in the final evaluation; an
increase in the maximum value by 1.00 kg, from 64 kg in the initial evaluation to 65 kg in the final
evaluation; an increase in the minimum value by 1.00 kg from 31.00 kg in the initial evaluation to 32.00
kg in the final evaluation; a slight change in the homogeneity of the group underlined by a slight decrease
of the standard deviation from 10.08 to 10.06 in the two tests.
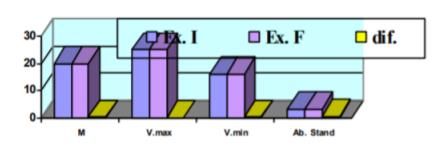
For
arithmetic average from 19.89 kg m in the initial evaluation to 20.00 kg in the final evaluation; an
increase in the maximum value to 25.00, both in the initial and final evaluation; an increase in the
minimum value from 16.10 in the initial evaluation to 16.12 in the final evaluation; an improvement in
the homogeneity of the group underlined by a standard deviation from 2.95 to 2.83 in the two tests.
The data processing, by means of which we assessed the dynamics of the general motor capacity
(Table
interesting aspects.
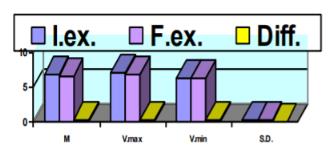
For
recorded: an improvement by 0.28 from 5.74 s in the initial evaluation to 5.48 s in the final evaluation; an improved maximum value by 0.30 and from 6.20 s in the initial evaluation to 5.90s in the final
evaluation; an improvement in the minimum value by 0.20 s from 5.40 s in the initial evaluation to 5.20s
in the final evaluation; an improvement of the homogeneity of the group underlined by a slight difference
between the value of 0.27 in the initial evaluation and 0.25 in the final evaluation of the standard
deviation. From the summary table of results, we can observe that in the 5X5 m sprint in the initial
evaluation there were 3 competitors with times over 6 seconds and none in the final evaluation. It can also be observed that six athletes progressed by 0.2 seconds, 5 sportsmen by 0.3 seconds and one sportsman by 0.4 seconds.
For the upper body lifting (abdomen) (acc. to Table
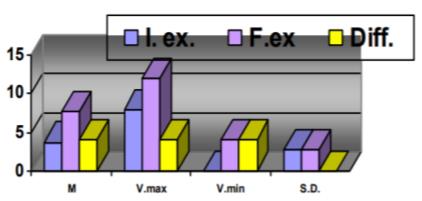
For
data were recorded: an increase in the arithmetic mean by 7.67 repetitions from 19.83 in the initial
evaluation to 27.58 repetitions in the final evaluation, therefore, a substantial improvement; an increase of the maximum value by 7 repetitions from 24 repetitions in the initial evaluation to 31 repetitions in the
final evaluation, thus a good growth; an increase in the minimum value by 9 repetitions from 14
repetitions in initial testing to 23 repetitions in the final testing; an improvement in the homogeneity of
the group underlined by two different values of the standard deviation of 2.95 and 2.35 respectively in the two tests. According to the tables of unprocessed results we can notice that, for
and two athletes from 9 to 11 repetitions. We consider that the individual evolution in the assessment
tests for the general motor capacity is good and different from one individual to another. The data
processing according to which we assessed the dynamics for developing mobility, coordination and
balance (table no. 3) highlighted a number of issues based on the arithmetic mean, the standard deviation,
and the maximum and minimum values.
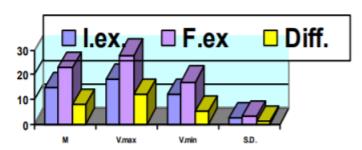
For
following data were recorded: an increase in the arithmetic mean by 4.00 cm from 3.75 cm in the initial
evaluation to 7.75 cm in the final evaluation, therefore, a substantial improvement; an increase in the
maximum value by 4 cm from 8 cm in the initial evaluation to 12 cm in the final evaluation, thus a good
growth; an increase in the minimum value by 4 cm from 0 cm in the initial testing to 4 cm in the final
testing; a stagnation of homogeneity of the group emphasizes the identity of the two standard deviation
values of 2.77 and 2.77 respectively in the two tests. As seen from the results recorded in the coxofemoral
(hip) mobility test, there were three athletes in the initial evaluation with values less than 8cm and five
athletes in the final evaluation recorded values higher than 9 cm. It can also be observed that one
sportsman progressed by 2cm, 4 athletes by 3 cm, 4 athletes by 4 cm, 1 sportsman by 5 cm, 1 sportsman
by 6cm, 1 sportsman by 7 cm.
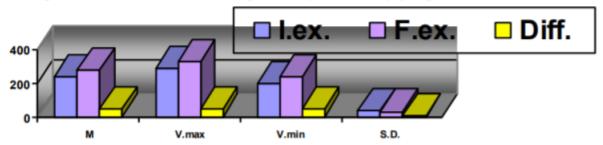
For the
following data were recorded: an arithmetic mean of 48.64 degrees increased from 231.00 degrees in the
initial evaluation to 279.50 degrees in the final evaluation, therefore, a substantial improvement; an
increase in the maximum value by 45 degrees from 283 degrees in the initial evaluation to 328 degrees in
the final evaluation, consequently a good growth; an increase in the minimum value by 48 degrees from
187 degrees in the initial evaluation to 235 degrees in the final evaluation; a stagnation of homogeneity of
the group emphasized the identity of the two standard deviation values of 2.77 and 2.77 respectively in
the two tests. As shown in the Table.
sportsman with values below 300º and in the final evaluation, four athletes have values higher than 300º.
Furthermore, we can notice that three athletes had a progress between 10 and 49 degrees and 9 athletes
between 50 and 71 degrees.
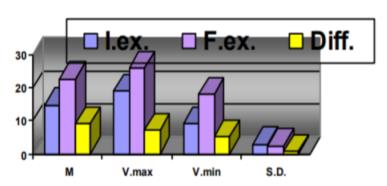
For the
following data were recorded: an arithmetic mean of 18.84 seconds increased from 11.83 seconds in the
initial evaluation to 30.67 seconds in the final evaluation, therefore, a substantial improvement; an
increase in the maximum value by 34 seconds from 18 seconds in the initial evaluation to 52 seconds in
the final evaluation, consequently, a good growth; an increase in the minimum value by 11 seconds from
7 seconds in the initial evaluation to 18 seconds in the final evaluation; a decrease of homogeneity of the
group emphasized the identity of the two standard deviation values of 4.04 and 4.04 respectively in the
two tests. As shown in the unprocessed results for the Flamingo test, the initial assessment there was no
sportsman with values below 20 seconds and in the final assessment 11 athletes have values higher than
20 seconds. Furthermore, we can notice that 7 athletes had a progress between 11 and 20 seconds and 5
athletes between 20 and 34 seconds.
Conclusion
The data recorded during our research have shown progress and pertinent conclusions.
Regarding the
final evaluation materialized in the following progress: 2 cm in height; 1.58 kg in weight; and 0.11 in the
body mass index. We consider these increases normal given that the athletes were still growing at this
age.
Regarding the
that the average values increased from the initial to the final evaluation which materialized in the
following progress: 0.28 seconds in 5 x 5 m sprint (25 m shuttle); 8.00 repetitions for the
lifting (abdomen); 7.67 repetitions for lifting the torso from a face lying position (back).We consider
these improvements as a very good value taken into account that athletes are at a stage of technique and
skill accumulation.
Regarding the development of mobility, coordination and balance assessed by the three tests
showed average values increased from the initial to the final evaluation which materialized in the
following progress: 4.00 cm in the hip mobility test; 48.64 degrees in the
seconds in the Flamingo balance test.
The dynamics of the somatic development, of the sprint motor capacity, of force, mobility, of the
perception capacity and movement representation in 10-12-year-old children practising athletic events is
rising.
Regarding the hypotheses, we can highlight the following:
- The hypothesis according to which over 14 weeks of training can improve the level of the
somatic development was confirmed;
- The hypothesis according to which if the educational process of the 10-12-year-old children uses
force, mobility, coordination and balance exercises, their level can improve was confirmed;
- The hypothesis according to which the use of coordination and balance exercises increases the
perception capacity and the movement representation was confirmed, an aspect which is supported by the
Matorin coordination test and the Flamingo balance test.
References
- Colibaba-Evuleţ, D. & Bota, I. (1998). Sports Games – Theory and Methodology (in Romanian: Jocuri Sportive – Teorie şi metodică), Aladin Publishing House,Bucharest, 107.
- Dragnea, A. (1996).Sports Training (in Romanian - Antrenamentul sportive), Didactic and Pedagogical Publishing House, Bucharest, 163.
- Deliu, D. (2007). Predicting Sports Performances (in Romanian: Predicţia performanţelor sportive), Bern Publishing House,Bucharest, 12.
- Matthews, G., Deary, I.J. & Whiteman, M.C. (2012). Personality Psychology – features, causes, consequences (in Romanian: Psihologia personalităţii-trăsături. cauze. consecinţe). Polirom Publishing House, Bucharest, 377.
- Popescu-Neveanu, P. (1978). Dictionary of Psychology (in Romanian: Dicţionar de psihologie), Albatros Publishing House,Bucharest, 41.
- Raczek, J. (1977). Sport in Children and Juniors – Training children and juniors as element of sport structure (in Romanian: Sportul la copii şi Juniori - Instruirea copiilor şi juniorilor ca element al structurii sportului), CNEFS and CCPEFS Publishing House, Bucharest, 20.
- Raţă, G. & Raţă B. (2006). Skills in the motor activity (in Romanian: Aptitudinile în activitatea motrică), Edusoft Publishing House, Bacău, 25.
- *** Encyclopedia of Physical Education and Sport (in Romanian: Enciclopedia educaţiei fizice şi sportului), (2002). Volume IV, Aramis Publishing House, 115.
Copyright information

This work is licensed under a Creative Commons Attribution-NonCommercial-NoDerivatives 4.0 International License.
About this article
Publication Date
25 May 2017
Article Doi
eBook ISBN
978-1-80296-022-8
Publisher
Future Academy
Volume
23
Print ISBN (optional)
-
Edition Number
1st Edition
Pages
1-2032
Subjects
Educational strategies, educational policy, organization of education, management of education, teacher, teacher training
Cite this article as:
Raţă, B. C., Raţă, M., & Raţă, G. (2017). Somatic evolution motor, perceţie and representation to children in athletics. In E. Soare, & C. Langa (Eds.), Education Facing Contemporary World Issues, vol 23. European Proceedings of Social and Behavioural Sciences (pp. 1498-1505). Future Academy. https://doi.org/10.15405/epsbs.2017.05.02.184