
The Importance Of Video Analysis And Statistical Programs In Junior Football Training


Abstract
Sports performance has today a very high level of requirements, being no longer enough classical training and collaboration between the coach and his athlete. This has led to a greater use of information technology, a performance measurement apparatus and usage of software designed to quantify their performance, identify and improve ahtlete's training level. The statistical analysis software S.P.S.S., quantifies and ranks the performance of a footballer, while the video analysis helps to correct technical or tactical errors. There was a number of 12 "Junior C" subjects belonging to the club Ceahlaul Piatra Neamt. The aim of the study was the improvement of the technique and biomechanics of striking the ball but also the increase of the percentage of successful passes and shots on goal. Subjects had to perform during five training sessions a total of 10 passes at distances of 3, 5 and 10 m to a fixed point and a total of 10 shots from distances of 11, 15 and 20 m from target. The research results revealed a significant improvement in biomechanics of hitting the ball both in the passes with the flat and shoots with full shoe of distance. We observed an increase to 100% of success passes to 5 m and shots of 15 m, and a significant improvement in the percentage of successful passes at a distance of 10 m up to 90% and increasing the percentage of successful shots at a distance of 20 m up to 80%.
Keywords: Video analysisstatistical analysisbiomechanicstechnique
Introduction
Modern football is conducted in a fast pace in terms of game action. This claims various qualities
of the player and their combinations to work together,
One of the factors involved and the most important in training of junior player is the technical
factor. Technical training is a key component of athletic training and is characterized by the activity of
learning, consolidation and improvement of all processes used to skilfully handling the ball and the
movement of players on the field,
2002). For technical training to be one of quality, it must involve the use of appropriate methods of
working age category and psihomotric level of the respective players.
As shown in various definitions of the technique, in the game of football, but also from the
definition provided by Reilly, the technique is as a whole and it
player demonstrates with the ball and describes the performance of a solitary action in isolation from the
features that differentiate it from other sports games. This is because the ball should be controlled with
the feet, which is less deft segments. To make possible the correct learning, improving and gaining good
skills in handling the ball with feet, resorting to learning as early football, learning appropriate to their
age and the formation of a large number of representations and nerve circuits in the region cortical
corresponding lower limbs. In other words, an optimal workout process in football does not focus only on
an analytical motric training or technique training, as being highlighted by Stratton and Reilly, but
searching the optimal development of children’s performance and development, the process of developing
children’s motor skills and game performance being undertaken by thousands of coaches on a day to day
Purpose of the Study
In carrying out this research we started from the premise that the training junior football technique
can carry a much higher yield than usual and progress can be more visible and stable where it is used the
management of statistically executions in the training and control samples and also if in the process of
training resorting to improve the ball striking technique by watching executions, basically by stimulating
the visual analyzer.
Methodology
The study involved 24 subjects of 12-14 years junior C, 12 form team F.C. Ceahlăul representing
the experiment group and 12 from L.P.S. Piatra Neamț, representing the control group. The research
aimed to establish the level of performance achieved in training of technique, based on the application of
supporting tools, studies on the effectiveness of video analysis and statistical analysis programs SPSS,
with the aim of improving technique, biomechanics of striking the ball and growth percentage of
successful passes and shots on goal.
The research consisted of two evaluations, an initial one and a final one through them pursuing the
fairness technique of striking the ball from passing it to certain fixed points and the shots with full shoe of
various distances, while aiming at the percentage of success of them. Thus, the subjects of the
experimental group had to during 5 training sessions by a total of 10 passes at distances of 3, 5 and 10 m
to a fixed point and by a total of 10 shots from distances of 11, 15 and 20 m away from the goal.
In this research we used: the study of literature method, method of tests and measurements,
statistical and mathematical method, graphical method and comparative method. Statistical indicators that
we chose were the arithmetic average, module and amplitude.
Regarding the training method used in the study, it was the repeated practice of techniques on
which tests were performed.
Results
After conducting tests, both at baseline and at the end of it, we obtained the results below.
Discussions
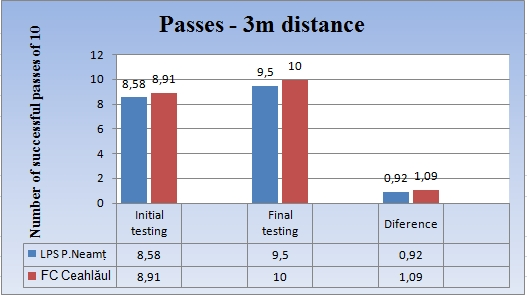
In the first test, conducted of the passes with the flat foot to a fixed point (pole) (figure
found progress more evident in the group of Ceahlăul over which has occurred during training sessions
by doing repeated exercices, methodic and visual images. This progress has resulted in a 100%
completion of pasees at a distance of 3 m. Also note that in terms of statistical data, the module was 10 at
all subjects, meaning that everyone successfully met the test objective. This correlated with the amplitude
value of 0 means that there was no difference in the percentage of successful passes between subjects
belonging to the experiment group, in other words there is a very good homogeneity between the subjects.
Still talking in terms of progress made by the two groups, the value of 1.09 in favor of experiment
group is far more pronounced than the 0.92 of the control group.
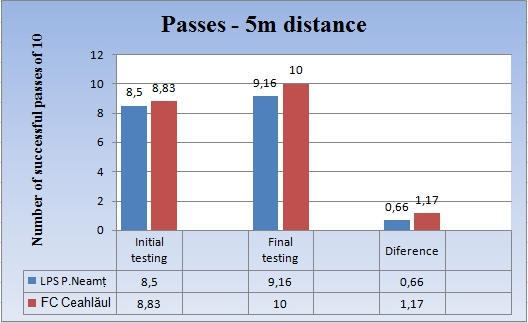
In test number 2, at the passes made to a fixed point located at a distance of 5 m (figure
observed a maximized rising again, at the final testing regarding the arithmetic average of succeded
passes and their percentage in the experimental group, but this time the progress difference between
initial and final tests between the two groups is more pronounced namely 1.17 in the experimental group
versus 0.66 in the control group only. About the statistical indicators of the module, we can mention that
the most common value of the number of great successes of the number of passes made is 10, a
percentage of 100% in the experimental group and 9 in the control group where it seems percentage of
success was a little lower.
Regarding to the values of amplitude, while in the case of the experimental group, the amplitude is
maintained at a value of 0, which indicates a maximum homogeneity between subjects, in the control
group it reaches already a value of 2, this signifying a success rate of less than some of the subjects to of
those who had maximum percentage.
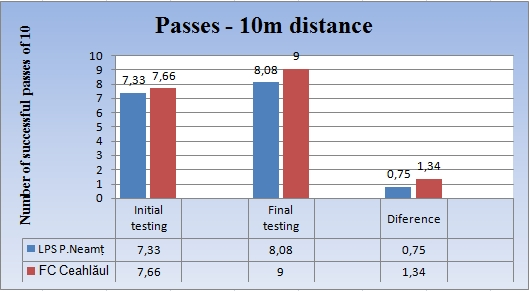
Finally, in the last test we checked the execution and success of default objective outlined in the
test passes made to a fixed point located at a distance of 10 m (figure
noticed again an improved accuracy and high percentage passes away in the two groups surveyed.
However, improvement, even if it is not at a maximum level, is much higher in the experiment group,
leading to a 9 out of 10 successful passes against only 8 in the control group. The difference between the
initial tests of progress and final amounts to 1.34 in the experimental group compared to the control only
0.75, an increase almost double.
Regarding the module, it has a value of 8 during the final testing of the control group, the most
common of the successful passes by total number of passes being 8, while in the experimental group this
indicator has a value of 9, only slightly higher. At the same time, on the amplitude values, it should be
noted that it has a value of 2 in both groups, which clearly indicates a greater difficulty for all of the
tested subjects of the two groups.
The first tests of the long shots, the one at 11m (figure
from short distances, a maximum percentage of success to all members of the experiment group. This
percentage was recorded in final testing and represent a significant progress towards initial testing. Even
if the control group showed an improvement in the success of shots, we consider that this was a normal
and logical due to exercising consistently. However, the difference between the initial and final tests is
1.5 in the experimental group versus 1.08 in the control one, otherwise a pretty significant difference.
In this test we noticed that module values were 10 in the experiment group and 9 at control group,
which has led to a higher arithmetic average, of experiment group. However, the difference seems to be
made of the values given for amplitude, whereas at the experiment group it is 0 which means that
absolutely all subjects did all the tests, the control group amplitude has a value of 8, meaning that there
were some subjects with a much smaller percentage of successful shots.

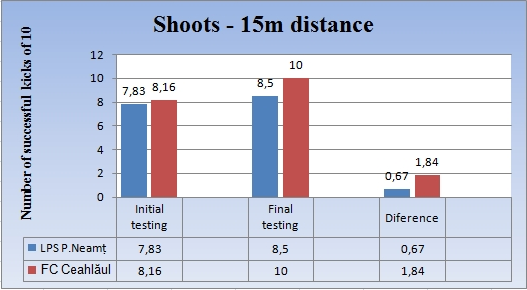
In the second test for long shots (figure
gratifying in the experiment group, noting that the arithmetic mean retains the value 10, which means a
percentage of 100% of success for each of subjects of this group. The difference from the arithmetic mean
of the control group is 1.5 to final testing, representing a significant endorsement large difference.
However, on progress between the initial and final tests in this test, the group experiment value is 1.84
while in the control group is 0.67, a difference almost triple breakthrough.
Concerning the module values in this test, should be noted that unlike the test of shots from a
distance of 11 m, there is a decrease in the value of the control group, which means a lower success rate
of shots, the most common value being 8, which means 8 successful shots from 10 attempts. Gratifying
thing is that in terms of experiment group, the module remains unchanged from the previous test, which is
10, which means that all subjects of the group managed all 10 attempts.
The amplitudes of this test has value of 2 at the control group while in the experiment group is 0,
this also signifying a higher omogenity for the experiment group.
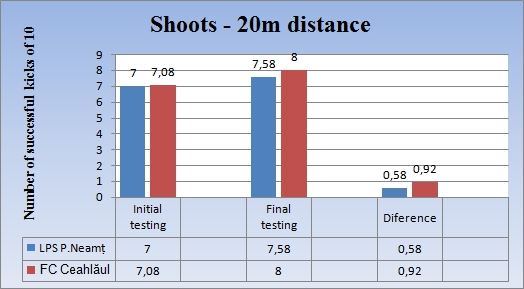
In the last test, that of the shots from distance of 20 m from goal (figure
different than in previous tests. Even if progress has been made also in here, in both groups, it was
noticeably lower in both, but also it could be seen that the progress of the experiment group is still higher
than that of control group. If in the experiment group we recorded a 80% successful shots in the final
testing, at the control group it was 75.8%. The difference between the two corresponding to arithmetic
average of the initial and final tests of the experimental group was 0.92 and 0.58 in the control group.
Regarding the indicator signifying the most common value, the module, it was 7 of 10 at the
control group and 8 of 10 in the experiment group. This contributes greatly to a progress more
pronounced at the experiment subjects belonging to the experiment group. Amplitude values, namely 2
were the same in both groups, which means that both groups had subjects whose percentage of success of
the shots was inferior to the best subjects in the group.
Conclusions
Analyzing data obtained from carrying out the tests, we concluded that at the junior age, when
forming technique of the future footballer is very important to combine the high number of repetitions for
learning, consolidation and improvement of each technique, with methodic accompanied by visual
images. In other words, soccer skills are qualitatively assessed normally by viewing them in a holistic
way and making judgements about the success or otherwise of the performance (Reilly, Cabri, Aranjo,
2005). This clearly helps the little footballer to identify the execution faults or positioning made and
correct them in a much shorter time.
After the conducted study, we believe that a good junior "C" undergone training according to their
age and level of development of psycho-motor should learn the correct technique of positioning to the
ball and hitting it to passes with the flat foot and long shots and with full shoelace. We concluded that
learning process that is structured according to “integrated” exercise favours the overall growth of the
technical-coordinative factor ( Giacomini, 2009).
The footballer should perform smoothly passes at small and medium distances such as 3 and 5
meters to a fixed point, and kicks at distances of 11 or 15 meters away from the gate. At the same time,
cataloging and interpretation of results obtained in samples determined using statistical software S.P.S.S.
helped us in identifying the level reached by players after repeated exercised passes and shots and to note
the differences between members of the experiment group but also between the performance of each of
them in each sample, and how big the diferences are or if there was any progress been made towards the
initial tests.
Thus, using educational software in the training process, we can enrich the tehnical knowledge
base of footballers, we can identify execution errors and we can correct them faster than conventionally,
because video provides an excellent means of recording, observing, analysing, evaluating and checking
In conclusion, the assumption from which we started, that the training of techniques in junior
football and technique of hitting the ball can produce a much higher yield than usual, making more visible
and stable progresses, whether there is a managing statistical performances in the training and control
samples, to see progress or regress was confirmed at trial. It was also confirmed that if the training
improves the technique of hitting the ball, not only by explanations and demonstrations, but also
drawings, diagrams or videos that stimulate visual thinking process of the child, schematic and dynamic
certain techniques, junior technical execution can be visibly improved.
Appendix
References
- Roderick M. (2006). The work of professional football, Routlegde, London
- Spinks W., Reilly T., Murphy A., (2002). Science and football IV, Routledge, London
- Reilly, T. & Williams, A. M. (eds) (2003). Science and Soccer II, E. & F. N. Spon, London
- Stratton G., Reilly T., Williams A.M. & Richardson D. (2004). Youth soccer-From Science to Performance, Routledge, London
- Reilly, T., Cabri, J. & Aranjo, D. (ed.) (2005). Science and Football V, Routledge, London
- Giacomini M., (2009). Technical Guide for Football Schools (in Romanian: Ghid tehnic pentru şcolile de fotbal), 3rd Edition, FRF Romania translation.
- Carling C., Williams A.M., & Reilly T. (2005). Handbook of soccer match analysis, Routledge, London
Copyright information

This work is licensed under a Creative Commons Attribution-NonCommercial-NoDerivatives 4.0 International License.
About this article
Publication Date
25 May 2017
Article Doi
eBook ISBN
978-1-80296-022-8
Publisher
Future Academy
Volume
23
Print ISBN (optional)
-
Edition Number
1st Edition
Pages
1-2032
Subjects
Educational strategies, educational policy, organization of education, management of education, teacher, teacher training
Cite this article as:
Felegeanu, C., & Rață, G. (2017). The Importance Of Video Analysis And Statistical Programs In Junior Football Training. In E. Soare, & C. Langa (Eds.), Education Facing Contemporary World Issues, vol 23. European Proceedings of Social and Behavioural Sciences (pp. 1461-1469). Future Academy. https://doi.org/10.15405/epsbs.2017.05.02.179