
Qualitative and Quantitative Methods for Estimating the Library and Information Services


Abstract
An analysis of statistical data shows that attendance in the libraries falls every year, the demand of library information as the material carrier (for example books) is greatly reduced, but the information in electronic form is in demand, and every year the figures are growing significantly. This paper presents an estimation method for separate and complex indicators of the efficiency of library and information product and service rendering depending on various factors that determine service quality, timeliness and efficiency. A fuzzy logic system to transform the primary data was designed with the “Fuzzy Logic Toolbox” software using MATLAB. The methods to rank the studied factors by their importance and effect on the criteria of the efficiency of library and information product and service rendering are given. It is shown that the quality of library and information services plays an important role in development of society and influences the global socio-economic development and wellbeing. The research application contributes to the optimization of the library helps to more efficiently organize and plan their work, as well as the right to determine the direction of further investment. In addition, it enables the management of the library to identify factors that contribute to improving the efficiency of their businesses, to study the most urgent and important needs of the market library services, and also to establish the factors that currently are essential as for institutions, and for users and consumers.
Keywords: Library and information servicesQuality managementEfficiency indicatorFuzzy logic
Introduction
The majority of enterprises in the service sector, libraries as an example, have to work in the conditions of fierce competition. Marketing research contributes to optimization of their activities, helps to efficiently organize and plan their work, and to identify the right areas for further investment. In addition, this research gives a chance to reveal the indicators, which improve the efficiency of libraries, to study most actual and important market requirements to library services, and to set the indicators most important for users and consumers. The obtained quantitative dependences of various indicators of the efficiency on the influencing factors help the management of an organization to understand the market situation and to make their activities more expedient (Lau et al., 2015).
Research method
The method to present experts’ opinions by means of fuzzy logic has been chosen as a method of estimating the quality indicators of library and information service rendering (Gong, & Liu, 2010). The fuzzy logic frequently implies fuzzy inference systems used to control technical devices and processes (Campbell et al., 2016). The development and application of fuzzy inference systems include several steps; implementation of these steps is performed using the main rules of fuzzy logic (Madhusudhan, & Singh, 2016). Information is fed into the fuzzy inference system input in the form of measured input variables. These variables correspond to actual variables of the control process (Rogovyh et al., 2015). The information from the fuzzy inference system output corresponds to the output variables and represents the operating variables of the control process. Fuzzy inference systems are used to convert input variables of the control process into output variables using fuzzy rules of productions. For this purpose, the fuzzy inference system needs to contain a data base of rules of fuzzy products and to realize fuzzy inference of the conclusions based on assumptions or conditions presented in the form of fuzzy linguistic statements (Zimmermann, 2001).
Figure
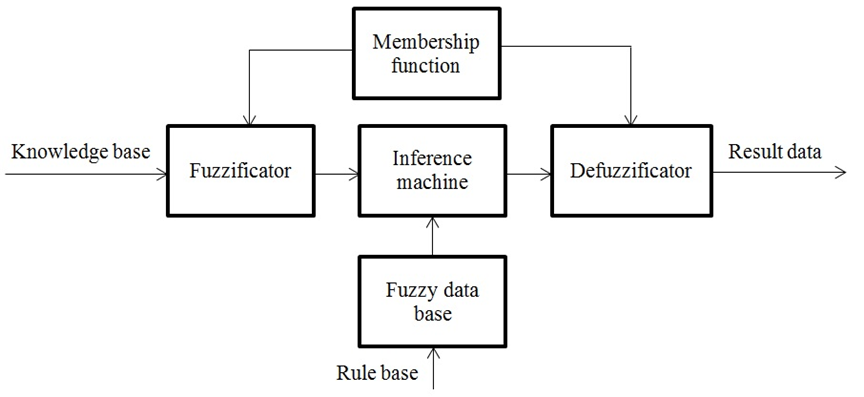
The fuzzy logic model allows obtaining a quantitative result based on the analysis of incomplete information on the research area and a convenient user interface, where the output data are similar to those obtained by human in their reasoning, approximation, uncertainty and subjectivity. In addition, increase in data processing speed is due to continuity of membership function.
The values of each input parameter and efficiency indicator are determined by the results obtained through questionnaires or
Results and discussion
A group of users were surveyed to calculate
Figure
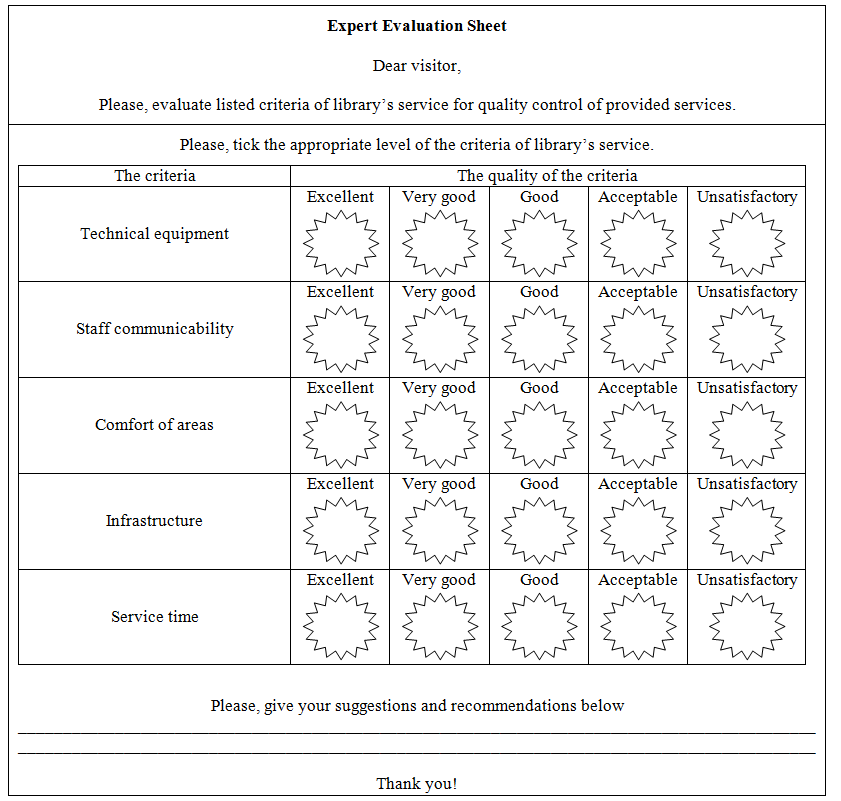
The results obtained in the survey conducted for a group of users of the Scientific-Technical Library, TPU (NTB TPU) and experts are the initial data for analysis. The primary information was presented in a non-numeric form; however, the respondent opinions were presented in the form of linguistic variables.
More than 80 respondents participated in the survey; about 50 questionnaires of these respondents were analysed in detail. Incorrectly completed questionnaires passed only the first processing stage. Among 50 participants of the survey, 9 respondents answered the questions via the Internet, 13 respondents responded by e-mail, the others filled in a paper version.
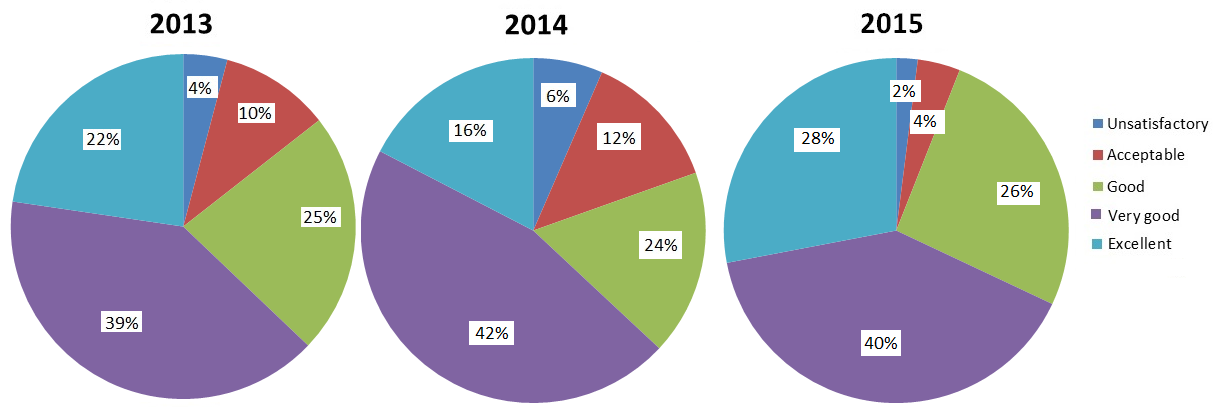
The study showed that 27.92% of the respondents attend the library weekly, 25.97% go to the library every month, 17.21% visit it every three months and 9.74% have never been to the library. As the opinions of the respondents are in the form of a linguistic variable, they should be transformed into numerical values. Appropriate conversions were carried out using the “Fuzzy Logic Toolbox” program.
The “Fuzzy Logic Toolbox” has a well-designed interface and allows design and diagnosis of fuzzy models. In addition, the “Fuzzy Logic Toolbox” provides the support of modern methods of fuzzy clustering and adaptive fuzzy neural networks. Graphical tools of the “Fuzzy Logic Toolbox” allow interactive tracking of the system behavior (Roghanian et al., 2015).
The
Figure
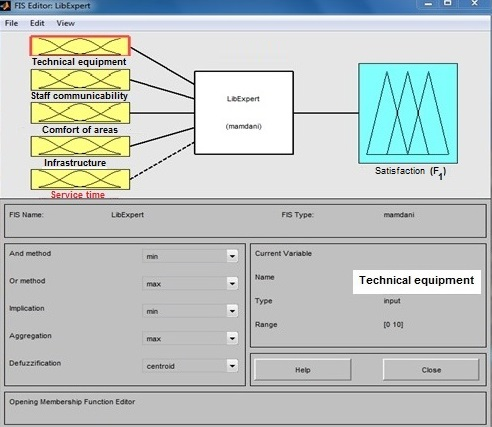
A complex indicator of satisfaction by the research results, service and help provided for the questioned users has the following input data (
technical equipment of libraries, modernity and quality of software and materials;
staff friendliness and communicability (librarians, etc.) are defined by their attitude to the users;
library comfort (cleanliness, quality and comfort of the areas, presence of different media and communications with the outside world (Internet, print tools, stationary and mobile telephony, a dining room, places for sale, comfort of visitors, etc.);
infrastructure parameters: location, proximity to academic buildings, transport infrastructure, parking places, etc.;
time period of staying in the library and/or the time of queuing to get material (paper based or electronic version), waiting time of service provision, customer service time in the library after filling an application form.
The
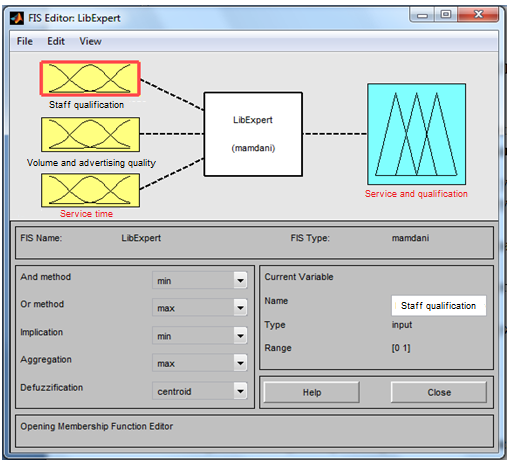
The logical inference algorithm (LibЕxpert) is used for transformation via the “Fuzzy Logic Toolbox” program. This algorithm specifies inputs and outputs, edits membership functions and rules, and displays the system surface.
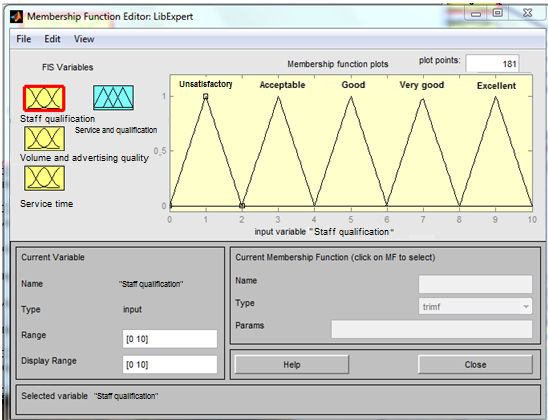
A membership function for variables is set. The range of variable variation and display is set in the “Range” and “Display range” columns (from 0 to 10). The parameters of the intervals by the scale of the linguistic variable are specified in the “Params” column.
The values in this column are as follows:
Figure
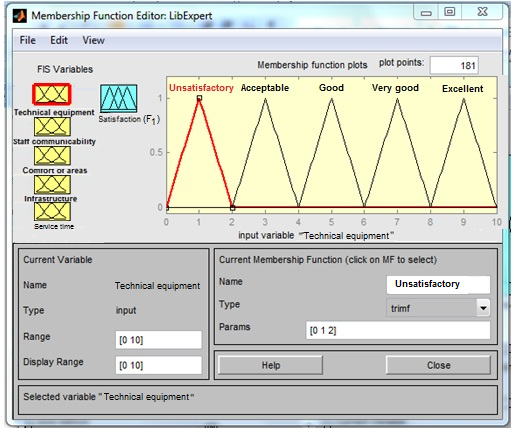
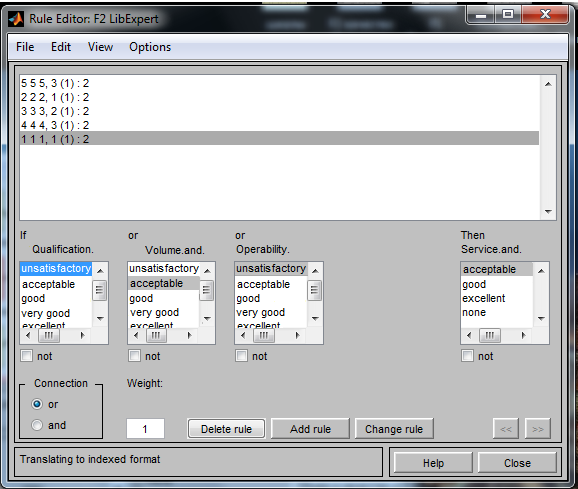
The rules of different combinations are specified in the window of the function editor. The combination consists of the indicators from the linguistic scale. The input indicator "Technical equipment of the library, the modernity and quality of the software and materials" is assessed using the fuzzy logic by linguistic scale in the following way:
All the input factors are assessed similarly.
The questionnaire data concerning the
Figure
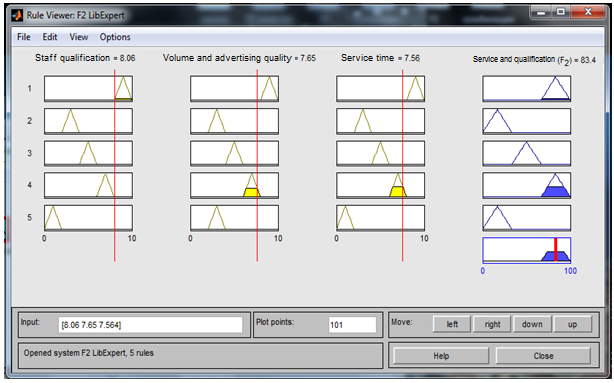
Rules editor window the F2 indicator is shown in figure
The values of the variables in numerical forms are obtained in result window with appropriate values. Necessary numerical value can be obtained at respective specified input parameters. Necessary numerical value can be received at the corresponding set input parameters.
Figure
The surface of the panel can be received at corresponding choice of menu item for display of dependence of output variable on input parameters.
Thus, “Fuzzy Logic Toolbox” allows using custom graphic interface to create fuzzy logic algorithms. Possibility of constructing fuzzy inference systems appears for creating of different expert systems. Blocks in “Simulink” allow creating controllers and control systems on fuzzy logic basis.
Questionnaires of 50 respondents have been treated in this program.
Table
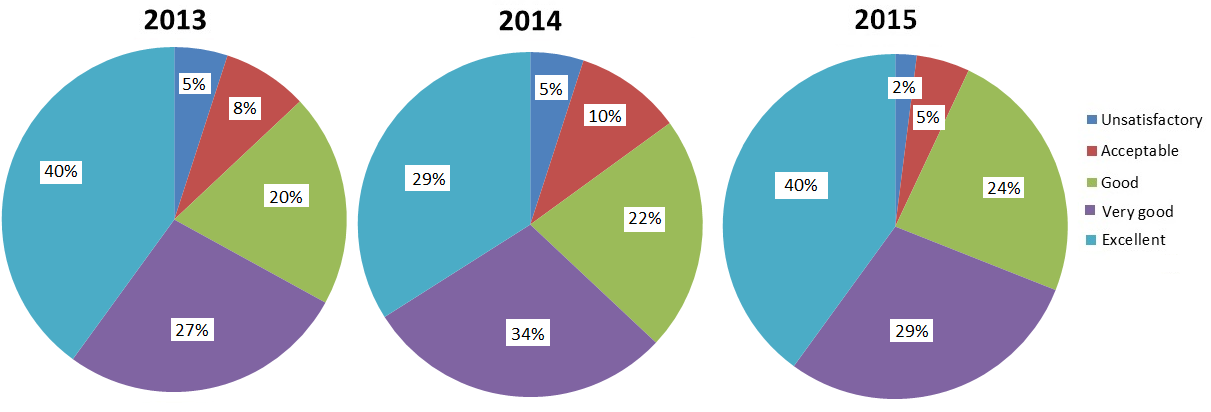
The processed results were analysed and presented as graphs (see figures
Conclusion
The feature of this problem is that individual efficiency indicators and most of the input factors cannot be expressed in a quantitative form and submitted either in the form of values of linguistic variable or indicator of some rating scales.
Determining of significant factors and their quantitative influence on efficiency indicators and library services enhances the effectiveness of their work. It identifies the most urgent needs of the market, to determine correctly the further directions of investment and ways of improving the quality of service.
The results of these studies can be represented as regression dependences of every efficiency indicator from a set of factors, as well as in the form of ranked rows of these factors. These factors are arranged according to the degree of influence in specific conditions of library activities.
References
- Alhumaidi, H. (2015). Multi-attribute fuzzy weighted average method to rank construction contractors. International Annual Conference of the American Society for Engineering Management, ASEM 2015; Indianapolis; United States, 31-41.
- Campbell, J.T., Sirmon, D.G. & Schijven, M. (2016). Fuzzy logic and the market: A configurational approach to investor perceptions of acquisition announcements. Academy of Management Journal, 59 (1), 163-187. doi:
- Gong, J. & Liu, L. (2010). Representing and measuring experts’ knowledge based on knowledge network. Studies in Science of Science, 28(10), 1521-1530.
- Lau, H.C.W., Nakandala, D., Zhao, L. & Lai, I.K.W. (2015). Using fuzzy logic approach in estimating individual guest loyalty level for international tourist hotels, International Journal of Services, Technology and Management, 21 (1-3), 127-145. doi:
- Madhusudhan, M. & Singh, V. (2016). Integrated library management systems: Comparative analysis of Koha, Libsys, NewGenLib, and Virtua. Electronic Library. 34 (2), 233-249. doi:
- Natalinova, N., Rozhkova, O., Moldovanova, E., Ilina, N. & Demin, N. (2016). Filtering for Stochastic Systems in the Case of Continuous Observation Channels with Memory of Arbitrary Multiplicity and Anomalous Noise International Siberian Conference on Control and Communications (SIBCON 2016), 1, doi:
- Roghanian, E., Moradinasab, N., Afruzi, E.N. & Soofifard, R. (2015). Project risk management using fuzzy failure mode and effect analysis and fuzzy logic. International Journal of Services and Operations Management. 20 (2). 207-227. doi:
- Rogovyh, A. V., Natalinova, N. M., Spiridonova, A. S. & Gordynets, A.S. (2015). Inspection Methods of Load-Recording Device "Gamma-500" International Siberian Conference on Control and Communications (SIBCON 2015), 1, doi:
- Zimmermann H.-J. (2001). Fuzzy Set Theory and its Applications. Boston, Dordrecht, London: Kluver Academic Publishers.
Copyright information

This work is licensed under a Creative Commons Attribution-NonCommercial-NoDerivatives 4.0 International License.
About this article
Publication Date
17 January 2017
Article Doi
eBook ISBN
978-1-80296-018-1
Publisher
Future Academy
Volume
19
Print ISBN (optional)
-
Edition Number
1st Edition
Pages
1-776
Subjects
Social welfare, social services, personal health, public health
Cite this article as:
Natalinova, . M., Galtseva, O. V., Xiu, N., & Belan, A. M. (2017). Qualitative and Quantitative Methods for Estimating the Library and Information Services. In F. Casati, G. А. Barysheva, & W. Krieger (Eds.), Lifelong Wellbeing in the World - WELLSO 2016, vol 19. European Proceedings of Social and Behavioural Sciences (pp. 476-484). Future Academy. https://doi.org/10.15405/epsbs.2017.01.65