
Analysis of social wellbeing parameters in Russia


Abstract
This article is devoted to dynamics of the social wellbeing index counted for Siberian region in context of the modernization processes in Russia. The study is based on representative samples from population surveys conducted in 2011 and 2015. It is complemented by the Russian region's modernization map, which was prepared within the data calculated under the procedure developed by Modernization Research Center of China Academy (adapted for Russia). It has been found that the social wellbeing of the population has not significantly changed over the last 5 years despite the current crisis. Also regions are unbalanced in terms of modernization processes, most of them don't even reach the level of capital cities in terms of modernization parameters and social welfare. Tomsk region is a remote Siberian region, but it has the specific "innovative" status and it shows better wellbeing indicators than Russia as a whole. The study was conducted under the RFH sponsorship as project №15-03-00366 "Social and cultural factors of the new modernization in the regions (on research in the Tomsk region)"
Keywords: Social welfaresocial well-beingmodernizationSiberian region
Introduction
Society in the modernization process analysis can be described as a reason, driving force and the end-user of its results. In this regard, it is logical to examine region's population in order to find out any correlations between modernization markers and factors which affects the human potential: satisfaction, social interests, values, social activity, protection, social optimism and well-being, satisfaction with the life quality, etc. All those factors affects on the people involvement into modernization processes.
The study represented wellbeing analysis of Tomsk region in the context of Russian regional modernization. This research was conducted as a part of the program "The sociocultural portrait of Russian Region", the modernization measurement instruments and procedures were initially proposed by the Modernization Research Center of China Academy and specially adapted for Russian conditions (Lapin, & Belyaeva, 2010).
Modernization as a factor of social wellbeing
Russian Federation is characterized by big amount of areas remote far from the central region, which are differentiated by their climate, culture, population and history. Eastern Siberia, Russian North, Far East are characterized by low level of social order and unequal access to social wellbeing sources (Foa, & Nemirovskaya, 2015). There are also important differences between regions in their income, infrastructure development, financial, industrial and human resources. Regional modernization studies shows that Russian region's modernisation levels and social wellbeing indexes differs a lot (Abramova, & Bulatova, 2012). Actually it is seen as a general disbalance in modernization processes (Lapin, & Kasavina, 2015; Kogay, & Kogay, 2015; Dulina, & Kargapolova, 2015; Nemirovskaya, 2015; Romashkina, 2015).
Moscow region and St. Petersburg, Nizhny Novgorod, Samara, Kaluga, Arhangelsk, Yaroslavl, Sverdlovsk, Perm Krai, Novosibirsk, Tomsk and Sakhalin regions shows the best modernization indexes (as it was shown in annex Russian regional modernization map for 2012, developed China Academy's Modernization Research Center's method; " Institute of socio-economic development of the Russian Academy of Sciences", Volgograd).
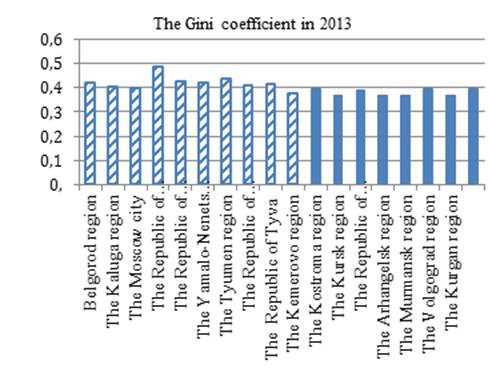
But the final purpose of this process is people’s life improvement and social, economic and cultural benefit's exceeding. Modernization process must force the social wellbeing growth, better life quality and confidence level. However, research data shows that there was no strong connections between this indicators. It means that modernized regions and ones with the high life quality don't are very different regions (excepting Moscow). Civil Society Development Fund's research showed that in 2013 leading regions in the social confidence rating were: The Yamalo-Nenets autonomous district, The Tyumen region, The Belgorod region, The Republic of Tatarstan, The Republic of Bashkortostan, The Republic of Buryatia, The Kaluga region, The Kemerovo region, The Republic of Tuva and The Moscow city. The outsiders of this rating were: The Volgograd region, The Republic of Karelia, The Kursk region, The Kurgan region, The Kostroma region, The Arkhangelsk region and The Murmansk region.
It means that a common idea of satisfaction levels directly determined by income level is not correct and satisfaction depends not so much on income but it is linked with stratification level described with Gini coefficient (Delhey, & Dragolov, 2013). Anyway social wellbeing, which depends on non-economic factors (as safety, trust, religion, values, social stratification), are quite interesting for studies. The Easterlin paradox tells us, that reach country does not mean better subjective wellbeing feeling, also people in countries with big level of inequality and social stratification can suffer from depression not related to their own real income (Stevensson, & Wolfers, 2008; Skugor, & Dingemans, 2012; Wilkinson, & Pickett, 2010; Deurzen, & Ingen, 2015The subjective social identity with the middle class decreases while inequality levels rise. Subjective wellbeing is also considered as dependent on gender equity and equality of rights (Aassve & Mencarini, 2015). After the some sufficient income level the self-fulfillment feeling (because of interesting and useful job or creative hobby) becomes more important for self-esteem and happiness than big salary (Skugor, & Dingemans, 2012). As we can see in general, social feeling is strictly connected with the subjective social wellbeing and despite wide variety of calculation methods, it's not easy to define (Campbell, 1981; Golovakha, & Panina, 1998). In the first figure we can see the social feeling rating: red mark is for leaders, blue - for outsiders. There is no negative correlation between life satisfaction and society stratification. We can notice, that regions with the high level of social feeling have higher Gini coefficient.
Social feeling index analysis for the Russian region
The Index of social feeling (ISF) calculation method is based on mass survey and includes three subjects: social protection index (PI), the life satisfaction level (SI) and social optimism index (OI). The calculation formula for ISF is as follows:
ISF = (PI + SI + OI) : 3 (1),
ISF equal to 0.5 or higher is necessary for calm and stable social environment. Numbers below this point indicates possible problems. In Tomsk region, which is a fairly distant Siberian region, we have data from two surveying waves (in 2011 and 2015). The first one includes 750 profiles, the second - 1000. Social feeling index comparison for this waves is shown on the table
Note: n1 = 750, n2 = 1000; each coefficient (index/subindex) counted by 5-ordinal scale from clear positive to definite negative answer.
Protection index (PI) counts in fact summary of 10 minor indexes, which describe 10 most common types of threats: bad ecology; discrimination because of age, gender, nationality, ideological or religious commitment; law enforcement and government's arbitrariness; poverty; criminal threats; "desolation and neglect" feeling. This data allows us to rank named threats. It should be noted that such categories as «mostly unprotected» and «unprotected at all» were summarized. The most pressing problems mentioned by the inhabitants of Tomsk and Tomsk region in 2011 were environmental threat and criminality (61% and 60%, respectively). The danger of goverment's arbitrariness (57%) took the third place. More than half of the residents pointed out the problem of poverty and the threat from law enforcemen't arbitrariness (51%).
In 2015 the first places were taken by poverty and goverment's arbitrariness (54.1% and 51.9%), other mentioned problems were: crime (49.8), environmental threats (45.7%), law enforcement authoritie's arbitrariness (40.5%). Thus, the top five threats has persisted their relevance in 2015, but the significance of environmental threat, crimes and the law enforcement's arbitrariness has decreased. There were also more people, who found it difficult to answer the question. This number was higher in 2015 than in 2011, which can indicate possible presence of hidden problems. Also answers about "desolation and abandonment" threat divided almost equally in both samples (40% to 41% of respectively, protected / unprotected in 2011; 36.3% to 38.3% - in 2015). Harassment's issue are not as prevalent in the region. The degree of social safety in this terms is presented in the following order: age, gender (49% / 58.4%), religious commitment (47% / 70.6%), ethnical discrimination (48% / 73.8%), political or ideological (46.3% / 46.3%). Counts were placed according to the issues in 2011/2015. The protection against this threats has increased during last 5 years, which is mentioned in higher PI (0.57 in 2011/ 0.62 in 2015). But satisfaction index has slightly decreased in 2011-2015 years - from 63% to 59%, more people are not satisfied with life in the region in some ways (23% / 24.4). Satisfaction index has also declined in 2015. However, cumulative life satisfaction index has not changed in both study panels.
Social feeling and happiness is also determined by social optimism index, which includes 3 subindexes: confidence about the future (OI1), situational optimism (OI2) and social expectations (OI3). Situational optimism subindex has decreased in 2015 from 0.64 to 0.56. In 2015, about 38% of the population answered that "life has become worse" and almost the same number said that "nothing has changed". Social expectations index stayed at the same level and reflected just a slight decline– 0.66 against 0.67 back in 2011. Confidence about the future found increased slightly –from 0.67 to 0.68.
Cumulative index of social feeling (ISF) stayed on the same level (0.65) for both surveying waves and it is close enough to the whole Russian ISF (0.64). Also, the threat of poverty takes the first place on a number of fears and threats in Russia as well as in the region. Anyway, despite of the volatile crisis, more than 40% of the respondents, both in Russia and in the Tomsk, noted themselves more satisfied with their lives at the moment. About 17% of people answered that they are "fully satisfied". Number of "insufficient satisfied" respondents is about 22%. But, comparison with the nationwide survey shows that on the average in Russia lives almost 2 times more "totally unhappy" respondents than in the Tomsk region, 4.2% against 2.3%. Tomsk citizens tend to feel more optimistic about their future. Number of those, who are quite confident in the future, turned out to be 1% higher among the residents of Tomsk than among the Russian, and number of non-certain respondents is on 6% less. There are some of the respondents, who "began to live better" even after the crisis years. Moreover, such kind of responses is twice as much in the Tomsk region as in Russia (17.2% vs.8.4%), and also 7% less respondents told that they live worse than before.
Surveys shows that people in the Tomsk region are careful enough in their guesses about the next year. Nearly 20% could not give a decisive answer about their future, 13.8% are strong optimistic and this number is twice higher than in the average for Russian Federation (7.6%). The share of extremely pessimistic respondents is also higher (5.1% of Tomsk citizens against 3.1% of the Russians). A lot of people felt that there will be no significant changes in future few years. The region's population and wealth level is also estimated as "high enough". 28.7% of the respondents can sufficiently ensure their lives with current income. There are twice more respondents who have enough income to buy anything they want, except new estate for its own expense in the Tomsk region than in Russia as a whole (18% vs. 9%). Other important difference refers to distance from the Moscow. Surveys shows, that Tomsk population (and Tomsk is located far from the capital) relies more on its own efforts in addressing life issues. 64.2% of the respondents prefer to rely fully only on themselves in Tomsk, at the same time it was only 49.2% in the average for Russia.
Conclusion
The subjective wellbeing in a remote Siberian region, measured by the Index of social feeling (ISF) in 2011 and 2015 shows mostly the same index values, close to all Russian, but with some specifically regional characteristics. Environmental threat, criminality, poverty, law enforcement's and government’s arbitrariness remain the main dangers? But they with a drifted in the ranking list over the past 5 years. Tomsk region has preserved the wellbeing indicators at the level of 2011 during the crisis of 2015 due to modernization process of economic and social sphere, but the majority of the region's population do not foresee life’s improving in the coming year. Nevertheless, people show enough optimism about the far future and long-term perspective. The majority of respondents in Tomsk and Tomsk Region enjoys living in Siberia.
There are a bunch of problems and challenges in this area: imbalance and deceleration of modernization processes in Russia and its regions lead to a decrease in the total social wellbeing. In this case the main goal of modernization is to dispatch the coincidence of the regions with a high modernization component and regions characterized by high population social wellbeing.
Acknowledgements
The research was conducted in Tomsk State Pedagogical University and Tomsk Polytechnic University with financial support of RHSF (Russian Humanitarian Science Foundation), project 15-03-00366 “Social and cultural factors of the new regional modernization (according to the data of Tomsk region)”.
References
- Aassve, A., Mencarini L., & Sironi M. (2015). Institutional Change, Happiness, and Fertility. European Sociological Review, 31 (6), 749-765.
- Abramova, M., Bulatova, T., Rykun, A., & Yuzhaninov, K. (2012).Problems of modernization and socio-cultural evolution of the Tomsk region (since 2000).Vestnik TSU Philosophy.Sociology. Political science Tomsk: TSU, 4 (20), 175-196. (in Russian)
- Campbell, A. (1981). The sense of well-beling in America. New-York: McGraw-Hill Book Company.
- Delhey, J., & Dragolov, G. (2013). Why Inequality Makes Europeans Less Happy: The Role of Distrust, Status Anxiety, and Perceived Conflict. European Sociological Review, 30(2), 151-165.
- Deurzen, I., Ingen, E., & Oorschot W. (2015). Income Inequality and Depression: The Role of Social Comparisons and Coping. European Sociological Review, 31 (4), 477- 489.
- Dulina, N., & Kargapolova, N. (2015).Between retarded growth and modernization of the region, South Federal District. Sociological research, 3,22-29.
- Foa, R.-S., & Nemirovskaya, A. (2015, February 6). How State Capacity Varies within Frontier States: A Multicountry Subnational Analysis. Governance. Retrieved from https://publications.hse.ru/en/articles/168284318
- Golovakha, E., Panina, N., & Gorbachik, A. (1998). The measurement of social feelings: ISF test. Sociology, 10, 45-72.
- Kogay, E., & Kogay, A. (2015). Two trends of primary regional modernization, Central Black Earth region. Sociological research, 3, 37-44.
- Lapin, N., & Kasavina, N. (2015). The imbalance of regional modernization processes, the Central zone of the Central Federal District. Sociological research, 3, 29-36.
- Lapin, N., Belyaeva, L. (2010). The program and the standard toolkit "Sociocultural Portrait region of Russia" (Modification -2010). Moskow: Institute of Philosophy of the Russian Academy of Sciences.
- Nemirovskaya, A. (2015). The expected modernization of regions of the Far Eastern Federal District. Sociological research, 2, 41-48.
- Romashkina, G. (2015). Modernization processes in the regions of the Urals Federal District. Sociological research, 1, 19-26.
- Skugor, D., & Dingemans, E. (2012). Money Does Not Buy Much Happiness - But What Have Income Inequality, Modernization and Personal Values Got to Do with it? Retrieved from http://ssrn.com/abstract=2057536
- Stevensson, B., & Wolfers, J. (2008). Economic Growth and Subjective Well-Being: Reassessing the Easterlin Paradox. Retrieved from http://ftp.iza.org/dp3654.pdf
- Wilkinson, R., & Pickett, K. (2010). The Spirit Level. Why Equality is Better for Everyone. London: Penguin Press.
Copyright information

This work is licensed under a Creative Commons Attribution-NonCommercial-NoDerivatives 4.0 International License.
About this article
Publication Date
17 January 2017
Article Doi
eBook ISBN
978-1-80296-018-1
Publisher
Future Academy
Volume
19
Print ISBN (optional)
-
Edition Number
1st Edition
Pages
1-776
Subjects
Social welfare, social services, personal health, public health
Cite this article as:
Maklakova, ., Bulatova, T., Berestneva, O., Romanchukov, S., & Shukharev, S. (2017). Analysis of social wellbeing parameters in Russia. In F. Casati, G. А. Barysheva, & W. Krieger (Eds.), Lifelong Wellbeing in the World - WELLSO 2016, vol 19. European Proceedings of Social and Behavioural Sciences (pp. 444-449). Future Academy. https://doi.org/10.15405/epsbs.2017.01.60