
Exploring Map Drawing Skills of Geography Teacher Training Students


Abstract
Map skills stand at the core of Geography education. Map reading and map drawing, however, do not enjoy similar attention and consideration in Geography classrooms. Empirical research shows less developed competence models of map drawing as opposed to map reading and an overall map-drawing skill acquisition mainly based on classroom teaching experience. Furthermore, studies showed that teacher training students encounter difficulties when asked to represent geographic space. Drawing upon the theoretical Competence Model of Map Drawing, this paper analyses the symbolic and graphic coding skills of teacher training students. A total of 120 students enrolled in regular (60 persons) and distance education (60 participants) in kindergarten and primary teacher training programs (at the specialisation the
Keywords: Map drawing skillskindergartenprimary educationGeographystudentsteacher training
Introduction
One of the central coordinates of (school) Geography is represented by map-related skills. Therefore, both cartography and teaching map skills are part of every program that trains future Geography teachers. Map skill acquisition, however, starts at a much earlier age as formal Geography education does. Regarding formal education, kindergarten and primary school introduce the basics of both spatial orientation and map skills. Within this framework, teaching staff is required to facilitate a progressive acquisition of spatial awareness including the capability to represent space. In other words, kindergarten and primary school teachers should foster learners to perceive, understand, and construct mental representations of the physical space starting from the local scale of the home environment and ranging to the global scale. These representations facilitate both the best possible adaptation to the environment they live in and an efficient and balanced use of resources (Dulamă, 2011). To do so, persons enrolled in the teacher training programs are expected to have, on one hand, highly developed map skills, and on the other hand, pedagogical knowledge to facilitate map skill acquisition. However, teacher training students for Geography secondary education themselves encounter difficulties when asked to represent geographical space (Osaci-Costache et al., 2013; Dulamă, & Ilovan, 2016). Linking back to earlier research, this paper aims at exploring the map skills of in-training kindergarten and primary school teachers. Furthermore, it tests selected dimensions of the Map drawing Skill Model (Frank, Obermaier, & Raschke, 2010).
Theoretical framework
When discussing map skills, two main theoretical areas require special attention. On one hand, theories regarding perception of space need to be reviewed. On the other hand, an overview of research on competence models of map drawing seems to be indispensable. Given the emphasis of the paper on teaching and learning Geography, theories linked explicitly to school Geography and Geography Education will be considered.
Perception of space and concepts of space
Exploring the historical development of space conceptualizations in Geography Education, Wardenga (2002) coined four types of space. Initial conceptualizations focus on structures and processes of the material space. As a consequence, space becomes a container of elements coexisting at a certain scale. This conceptualization refers to space as a container and represents the first and most primitive concept of space. Strongly influenced by system theories, conceptualizations of space shifted progressively towards analysing the relative position of material structures, which serve as grounds for the construction of social realities. This second type of space is called space as a system of relative positions. The third space concept – space as a category of sensory perception – focusses on individuals (both persons and institutions) and their subjective perception of space. Beyond mere materiality and imposed objectivity, sensory perception leads to highly subjective spaces. Lastly, constructed space is the fourth space concept, which stands for understanding space as a result of production and construction resulting from individuals’ specific social, technical, and political perspectives.
Map drawing skills
Working with space concepts in Geography classrooms is often connected to maps. While map decoding, reading, interpretation – basic skills of school Geography – enjoy frequent consideration, map production in general and map drawing in particular belong to rare events in Geography classrooms. While the former encourage students to evaluate space according to different criteria and concepts, producing maps links subjective perspectives and cartographic representations in an explicit way. The fact that competence models for map reading skill acquisition are more developed and look back on a longer tradition also underlines the low priority given to map drawing.
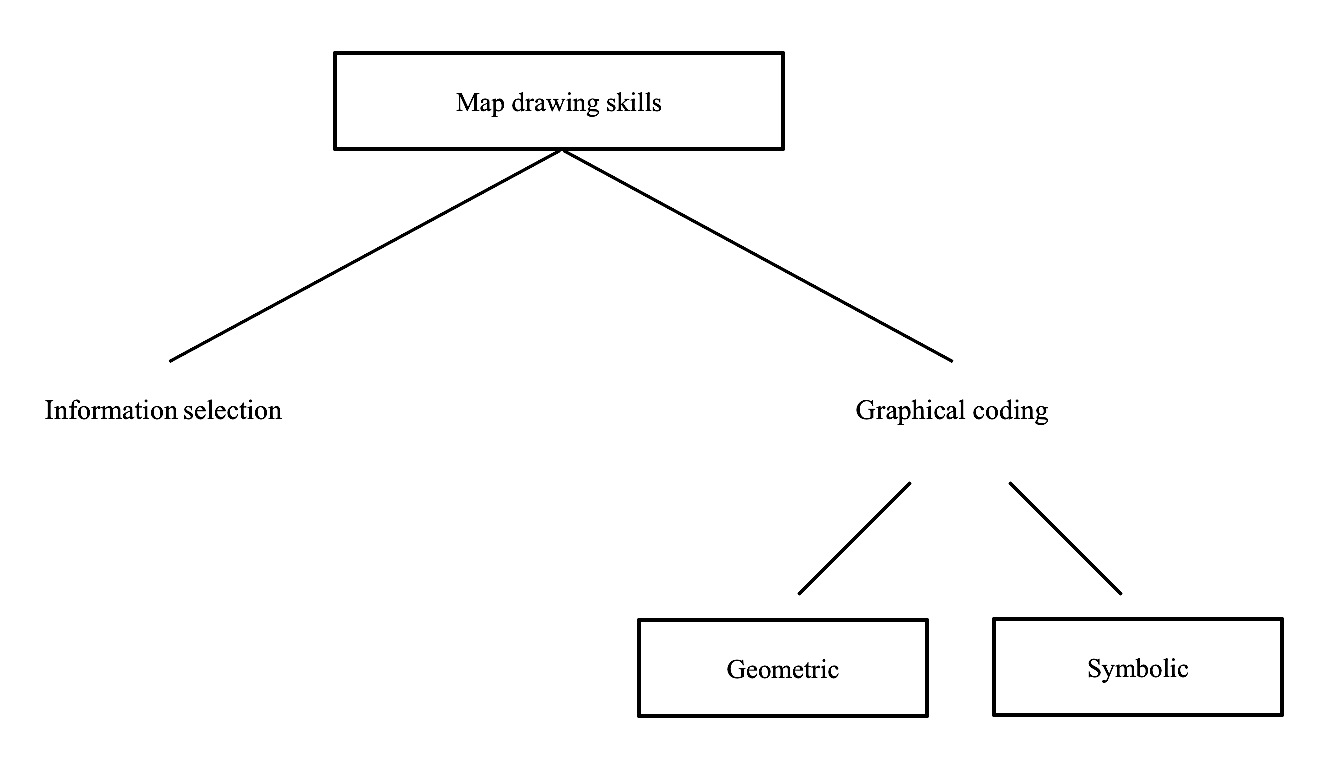
When producing maps, individuals carry out a process of coding. Similar to writing, the prerequisite of map drawing is the knowledge of conventions, such as signs with pre-defined semantics and a set of rules setting out their usage. In contrast to writing, however, map production is rarely linear. While coding during writing happens in a specific direction and consists of a given order of signs, drawing maps can happen following different algorithms (e.g. layers or spatial units). Still, Frank, Obermaier & Raschke (2010) list three main skills of continuous text production that can be transferred to discontinuous texts, such as maps: first, the ability to draw graphic elements (both in an analogue or digital manner); secondly, knowledge of basic cartographic content (e.g. symbols, scale, orientation, generalization); thirdly, self-dependent map production regarding information selection and map content. Based on these skills, literature, and decades of experience in Geography teaching, the authors developed the Competence Model of Map Drawing (cf. Fig. 1).
The practice of Geography teaching shows that mental maps and sketch maps are the most common products of map drawing. While mental maps are primarily individual representations of produced space, the also carry certain diagnostic value (Bagoly-Simó, 2012). Sketch maps are incomplete, distorted, mixed-metric, schematized, simplified, and generalized representations of spatial structures that do not claim accuracy regarding scale, orientation, and content diversity (cf. Frank, Obermaier, & Raschke, 2010; Golledge, & Stimson, 1997). When drawing maps, the core activities are content selection and content coding. Both reflect the construction process of the map. In other words, sketch maps provide information regarding the number of features, the mix of elements (e.g. points, lines, areas) used while drawing, but also about individually perceived dominant functions and ordinal information (Golledge, & Stimson, 1997). Still, sketch maps follow certain cartographic principles and contain certain (simplified) elements of a map.
Problem statement & research questions
Based on the relatively marginal consideration of map drawing in Geography classrooms and the difficulties encountered by teacher training students when asked to represent geographical space (Osaci-Costache, Dulamă, & Ilovan, 2013; Dulamă, & Ilovan, 2016), this paper aims at exploring the maps skills of in-training kindergarten and primary school teachers. Within the framework of the Competence Model of Map Drawing (Frank, Obermaier, & Raschke, 2010), the paper analyses the way symbolic and geometric coding was carried out.
Method & sample
The sample consisted of 120 Geography students enrolled, during the 2015-2016 academic year, in programs with both regular attendance (60 students, further group I) and distance education (60 students, further group II), at the specialisation the
Data collection took place in 2015 as part of a portfolio work carried out at home. Students were asked to draw a map of their home or of the university and its immediate neighbourhood. In doing so, they were asked to rely on their mental representations and use no ruler. Street names and important (public) buildings had to be included. Furthermore, they received a checklist from the second author containing the following items: Did you represent your home/the university building using a geometrical shape? Did you use thin lines for streets? Did you include street names? Did you include buildings surrounding your home/the university? Did you provide a title? Did you specify the geographic North? Submission of maps took place via email.
Mixed methods served to analyse the representations. Representations were subjected to category-based content analysis. The pre-defined sets of criteria rely on the Competence Model of Map Drawing (cf. Table
Results
The collected data reflects selected aspects of the two dimensions of graphic coding, namely geometric and symbolic coding (cf. Table
A total of three indicators measured geometric coding. With two exceptions, all other test persons represented streets with two parallel lines. Sketch maps reflected different representations of buildings. Overall, most test persons opted for black (filled) (37.5%) or unfilled geometrical shapes (37.5%) to represent dwellings. Other participants used shaded geometric shapes (12.5%) or (mainly 3D) pictographic drawings (11.6%), while coloured geometric shapes (7.5%) were the least considered option. The two sub-samples displayed a number of differences, namely distance education students seemed to prefer black geometric shapes followed by unfilled and shaded shapes, while students enrolled in the regular program opted primarily for black (filled) shapes and also more often for coloured shapes and drawings. Regarding the relative position of the buildings in relation to the street, most test persons opted for a representation where buildings were detached from the line of the street. However, more students of the regular program glued the buildings to the street.
Four indicators measured the symbolic coding. Most representations (86.6%) did not contain a legend. Differences between the two sub-samples are minimal. However, most distance education students who included a legend are part of the youngest age group (IIa). Cardinals represent the second indicator measuring symbolic decoding. More than half of all drawings did not contain cardinals (62.5%). While most students enrolled in the regular teacher training program did not include cardinals (86.6%), 61.6% of the distance education students included the geographic North. The third indicator–information on building usage– shows that most test persons (80.8%) opted to include text around or on top of the buildings, instead of opting for cartographic symbols to describe the dwelling’s usage. The representation of the flat where test persons lived in (fourth indicator) shows that a quarter of all representations contained a specific cartographic symbol for this item. While more distance education students represented their own flat, more students of the regular program included the cartographic symbol of their home in the legend.
Discussion & Conclusions
The results of the study show that despite optical presentations resembling maps, most sketch maps actually resemble mental maps. Evidence to this is the rudimentary symbolic coding. While some sketch maps contained cardinals, most test persons opted not to represent their home using a cartographic symbol. Moreover, they opted for a textual coding of the building usage in contrast with the usual symbolic coding (e.g. colours, symbols) of functional areas and dwellings (i.e. industrial, recreational, services etc.). Similarly, geometric coding also displays rudimentary skills. Still, students used different form of filling and shading when drawing buildings, which stands for a certain transition towards a symbolic representation. Differences between the two sub-samples could be a result of the teaching experience of distance education students.
The second conclusion of this paper refers to the Competence Model of Map Drawing. Using pre-defined sets of indicators helps operationalizing the different dimensions of coding, however, a more qualitative and inductive approach could be more useful to identify indicators.
Based on the variety and number of challenges faced by students (e.g. form, size, position, distance, angles, etc.), school Geography should focus on including more activities to foster map drawing skills.
References
- Bagoly-Simó, P. (2012). Nationale Räume: Selbst- und Fremdbilder in kognitiven Karten von mexikanischen und rumänischen Schülern. In: A. Hüttermann et al. (eds.), Räumliche Orientierung, Karten und Geoinformation im Unterricht (pp. 169-178). Braunschweig: Westermann.
- Dulamă, M.E. (2011). Geografie şi didactica geografiei pentru învăţământul primar şi preşcolar. Cluj-Napoca: Presa Universitară Clujeană.
- Dulamă, M.E. & Ilovan, O.-R. (2016). How powerful is feedforward in university education? A case study in Romanian geographical education on increasing learning efficiency. Educational Sciences: Theory & Practice (ESTP), Kuram ve Uygulamada Eğitim Bilimleri, 16(3), 827-848. Doi:
- Golledge, R.G. & Stimson, R.J. (1997). Spatial behavior: a geographic perspective. New York: The Guilford Press.
- Obermaier, G., Frank, F. & Raschke, N. (2010). Kompetenz des Kartenzeichnens – Theoretische Grundlagen und Entwurf eines Kompetenzstrukturmodells. Geographie und ihre Didaktik, 38(3), 191-200.
- Osaci-Costache, G., Dulamă, M.E, Alexandru, D. & Voitovici, M.-R. (2013). Forming and assessing the competence to elaborate touristic plans. PedActa, 3(2), 97-114.
- Osaci-Costache, G., Dulamă, M.E. & Ilovan, O.-R. (2013). Forming and assessing the competence to elaborate topographic profiles. Studia Universitas Babeş-Bolyai, Geographia, 58(2), 199-210.
- Wardenga, U. (2002). Alte und neue Raumkonzepte im Geographieunterricht. Geographie heute, 23(200), 8-13.
Copyright information

This work is licensed under a Creative Commons Attribution-NonCommercial-NoDerivatives 4.0 International License.
About this article
Publication Date
22 December 2016
Article Doi
eBook ISBN
978-1-80296-017-4
Publisher
Future Academy
Volume
18
Print ISBN (optional)
-
Edition Number
1st Edition
Pages
1-672
Subjects
Teacher, teacher training, teaching skills, teaching techniques, special education, children with special needs
Cite this article as:
Péter, B., Dulamă, M. E., Ilovan, O., Kosinszki, S., & Răcășan, B. S. (2016). Exploring Map Drawing Skills of Geography Teacher Training Students. In V. Chis, & I. Albulescu (Eds.), Education, Reflection, Development - ERD 2016, vol 18. European Proceedings of Social and Behavioural Sciences (pp. 41-47). Future Academy. https://doi.org/10.15405/epsbs.2016.12.6