
Positive Expectations – Optimism and Hope in Models


Abstract
Current approaches to optimism accentuate its many different aspects: dispositional optimism (
Keywords: Optimismpessimismhopemodels
Introduction
Optimism and pessimism can be seen as umbrella terms used in relation to many current constructs. They do not always correspond to the commonly used meaning of the terms. Specialized literature specifies and differentiates, inter alia, dispositional optimism (Scheier, & Carver, 1985), optimistic or pessimistic attributional (explanatory) style (Peterson, & Seligman, 1987), optimism as a positive illusion (Taylor, & Brown, 1988), unrealistic optimism (Weinstein, 1980), unrealistic pessimism (Heine, & Lehman, 1995), defensive pessimism and strategic optimism (Norem, & Cantor, 1986). Current psychological approaches consider optimism most commonly a cognitive characteristic; the authors focus on the goals, the expectations and the causal attributions. However, we must not forget the emotional entourage accompanying optimism and pessimism. We may be surprised that both optimism and pessimism may be emotionally defensive in nature, and that optimism is motivating along the road towards a goal, but may also be an appealing goal in itself.
Scheier Carver (2002, a, b, 2014) are proponents of the theory of dispositional optimism and define it as a generalized expectation of positive course of events and a positive result of the event or activity itself. To any challenge, an optimist reacts with faith in reaching desirable results and continually taking part in the activity even if the process is long and difficult. Pessimists, on the other hand, are full of doubt and hesitation. These differences also significantly influence, inter alia, coping with stress. Dispositional optimism is, to a large extent, affected by genetics. Authors consider it a relatively stable and fixed facet of personality.
The theory of optimism as an explanatory style stems from theory of attribution and theory of learned helplessness (Seligman, 1990). An optimistic explanatory style can be characterized by the attribution of external, unstable and specific causes to failures and negative events; a pessimistic explanatory style is typical by attributing internal, stable and global causes to negative events. The basic difference between the optimistic and pessimistic explanatory style is seen by Seligman (2003) in the different assessment of the causes of success or failure, as well as the pervasiveness of good and bad events and the ability to maintain and foster hope. According to Seligman et al., explanatory style is malleable and can be changed from pessimistic to optimistic (Seligman, 2013).
Weinstein (1980) defined unrealistic optimism as a general tendency to expect that negative events are more likely to happen to others and positive are more likely to happen to us. This approach builds on the concept of so-called positive illusions (Taylor, & Brown, 1988, 1994), which can be commonly found in satisfied, psychologically healthy and well-adapted persons (slight self-overestimation, overestimation of the ability to control the course of events in their life and viewing the future in the light of unrealistic optimism).
People using an optimistic strategy do not think too much about possible risks and imagine themselves in a situation where they are coping successfully. The occasion in question does not cause them anxiety, and they feel they have the situation under control. By contrast, people using the cognitive strategy of defensive pessimism expect very little of the coming events, since they experienced success in similar situations before. These defensive pessimists are more anxious, and the reduced expectations serve as a “cushion” which dampens the effects of a possible failure. They imagine all the bad things that can happen and try to estimate the risks in order to be able to prepare for them. The effort they exert to reach the objectives is not reduced in any way by defensive pessimism. Cantor & Norem (1989) thus describe defensive pessimism as a cognitive strategy characterized by low expectations despite previous success, and rumination regarding potential risks and their management.
Similar to optimism, hope is also based on the anticipation of positive future developments. According to Snyder (2000) hope is a multi-dimensional construct which can take on the form of a current state (hope state) or a personality trait (hope trait). As a personality trait, hope then expresses the subjective extent of hope experienced over a long period of time. It results from the cognitive-motivational setup and consists of three basic components – goals, will, sometimes also called will-power or agency, and the pathways to the goal themselves. It is thus the collection of subjectively perceived sources and abilities to find pathways towards the set goals, and subjectively perceived activity needed to utilize these pathways. It reflects the belief that the person will find a path to achieve the desired goal and will be motivated to walk this path (Snyder, 1994, 2000, a, b).
The conceptual and psychological differentiation of optimism and hope based on commonly used connotations in the language was studied by Bruininks & Malle (2005). Based on qualitative coding of the respondent statements, the authors concluded that the intuitive understanding of optimism and hope does not correspond to theoretical constructs, but nonetheless aids in differentiating them. Optimism appears in situations where the likelihood of achieving a goal is higher. It is associated with joy. Hope as an emotion is activated in situations which we have little control over and whose realization is uncertain. The authors elaborate on the obvious contradictions in the intuitive understanding of the concepts in question (primarily hope) and the theoretical constructs, and speak out against the willful creation of psychological theoretical concepts which do not respect the folk concept, i.e. the generally accepted concept of a particular phenomenon.
Snyder et al. (in Chang, 2002) perceive optimism as a more general construct, which emphasizes active thinking directed towards a goal, and view hope as a set of goal-oriented thoughts which include both motivation and the potential ways of reaching the goal.
Alarcon, Bowling & Khazon (2013) published a meta-analytical study examining the relationship between optimism and hope. They arrived at the conclusion that both constructs correlate, but are not redundant.
Research questions and purpose of the study
In the context of the above, we have decided to create a model which would aid us in better understanding the relationships among the specific dimensions of the constructs of optimism/pessimism and hope. The model incorporates dispositional optimism, defensive pessimism, unrealistic optimism and hope. We are interested in whether the constructs of optimism/pessimism and hope reflect the same underlying trait and how closely optimism and hope are related if they are distinct.
The aims of the research were
to design a model of optimism/pessimism using the dimensions of dispositional optimism, defensive pessimism, unrealistic optimism and hope
to determine the degree of conceptual overlap between optimism and hope
Research methods
3.1. Research sample
The research sample consisted of 1,774 respondents (33.3 % men, 66.7 % women) between 15 and 79 (m = 33.5, SD = 15.8, med = 27). In terms of education, 21.9 % of respondents completed elementary education or secondary education without completed school-leaving exams, 48.8 % completed secondary education with exams and 29.3 % completed university education. The final sample only included persons who had no more than 3 results missing from the 9 scales used.
3.2. Instruments
The respondents were subjected to an extensive questionnaire survey. The research presented makes use of data from the Life Orientation Test, Defensive Pessimism Questionnaire, Adult Dispositional Hope Scale and Unrealistic Optimism and Subjective Feeling of Control Questionnaire.
Life Orientation Test – Revised, LOT-R (Scheier, Carver, & Bridges, 1994).
In 1985, Scheier & Carver developed the
The newer, shortened and revised version of the questionnaire,
Defensive Pessimism Questionnaire, DPQ (Norem, 2002).
The inventory consists of 17 statements which the respondents react to by expressing the extent to which they agree or disagree with the statement on a seven point scale. The author of the questionnaire subjected the items to factor analysis which confirmed two basic factors: pessimism and reflection. The inventory distinguishes well defensive pessimism from dispositional pessimism (in case of the respondent’s experience with repeated failures in the past). From a total of 17 questions, we score only 12. The “fillers” and experimental questions are not included in the evaluation. The reliability of the tool is satisfactory; Cronbach’s alpha for pessimism (DPQ_P) is 0.688, and for reflection (DPQ_R) 0.636.
Adult Dispositional Hope Scale, ADHS (Snyder, 1991)
The scale contains 12 items/statements, of which 4 focus on agency needed to achieve a goal and 4 on pathways thinking (generating the means to achieve said goal). The last 4 serve as distractors which are unrelated to the concept of hope (Snyder, 1995). The extent of agreement with a statement is expressed by the respondents on an 8 point scale (1 = does not fit me at all, 8 = fits me perfectly).
We verified the internal consistency of the scale; Cronbach’s alpha reached a value of 0.830 for agency (ADHS_A) and 0.859 for pathways to the goal (ADHS_P).
Unrealistic Optimism and Subjective Feeling of Control Questionnaire (Weinstein, 1980; Dosedlová, Jelínek, & Klimusová, 2012)
In line with the research method of Weinstein (1980, 1982), we created a list of 18 life events (8 positive and 10 negative) which the respondents may expect in their professional and private life. We specified the life events taking into account the age of the respondents, which gave rise to two sets, one for younger respondents up to 34 years of age, and one for respondents 35 years and above. Three positive situations and eight negative situations remained unchanged in both sets. Due to the fact that the result evaluated is the difference in the assessment of one’s own chances for experiencing the given situation, and the chances of their peers of the same gender, there is no need to use a unified list of specific life situations.
Examples of items:
In the first part of the questionnaire, the respondent’s task was to estimate in percentages the chance they will experience the given situation (0 % = no chance, 100 % = certainty). In the second part, the respondents estimated the chance that their peers of the same gender will experience such events (0 % = no chance, 100 % = certainty).
The third part of the questionnaire consisted of a five point scale focused on the subjective feeling of control over life events (1 = cannot influence at all, 2 = can influence only to a small degree, 3 = can influence to a middling degree, 4 = can influence to a large degree, 5 = can influence completely).
Furthermore, based on the first two parts of the questionnaire, we created a scale of unrealistic optimism, which we view as the expectation by the person evaluated that they will experience positive events in their life in a greater extent than their peers, and experience negative events in their life in a smaller extent than their peers. We created 18 new variables which were created by deducting the chances of the peers from the chances of the respondents in positive events or vice versa in negative events. After adding the values together and calculating averages for all 18, a scale was created to assess the extent of unrealistic optimism in our respondents. The reliability of the scale achieved satisfactory values; Cronbach’s alpha for positive events (POS) was 0.813, for negative events (NEG) 0.730 and for subjective feeling of control (CTRL) 0.832.
3.3. Method of obtaining and processing data
Data collection took place over the course of several months from spring until the end of 2014. The data was collected electronically using an online form or in pen-and-paper printed form. (Based on previous research, we lean towards the opinion that results are not significantly affected by the form in which the questionnaire is administered - Jelínek, Květon, Vobořil & Klimusová, 2007). Occasional selection of respondents was done via e-mail, advertisements using the Masaryk University Print Centre or Radio Brno or based on personal contact. The filling of the test survey took 60 minutes on average.
Confirmatory factor analysis was performed within the
Findings and interpretation
Table
Using structural equation modeling methods, we tested 3 models. Model no. 1 represents the confirmatory factor analysis of the first order with correlated factors, where the factors correspond to individual scales described in the
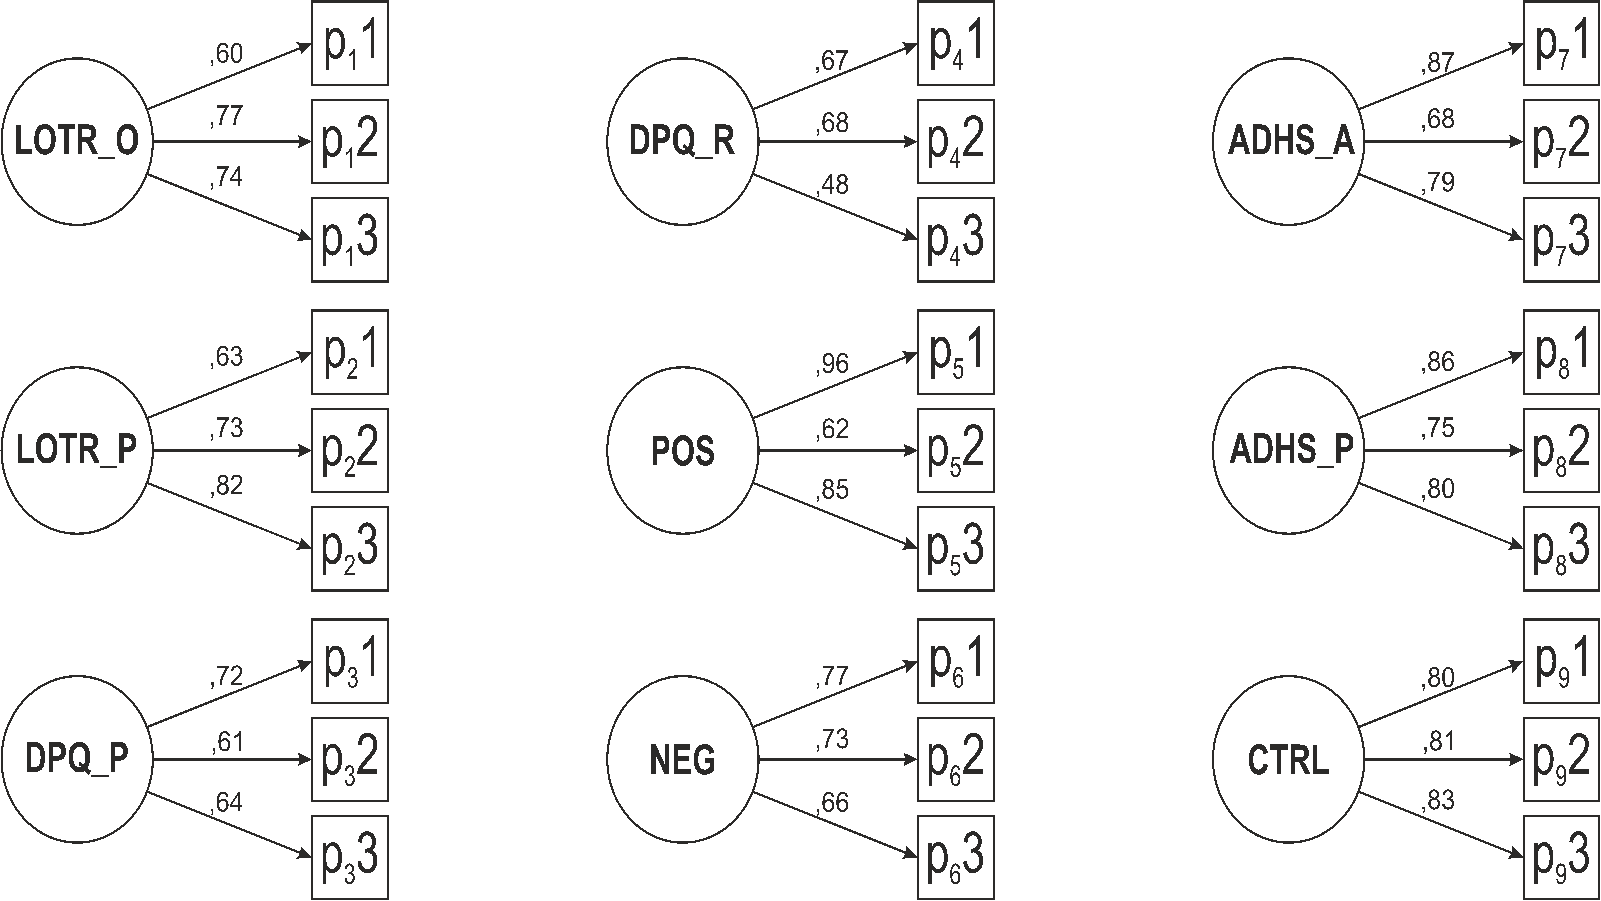
4.1. Model no. 1
In this model, we use nine mutually correlated factors, each represented by three parcels created from the corresponding items. Overall, we can state that the model describes the data fairly well (χ2=1432.08; df=288; p≤ 0.01; RMSEA=0.047; 90%CI (0.045; 0.050); Hoelter N 1%=430.54). The details of the model with structural parameters are shown in Figure
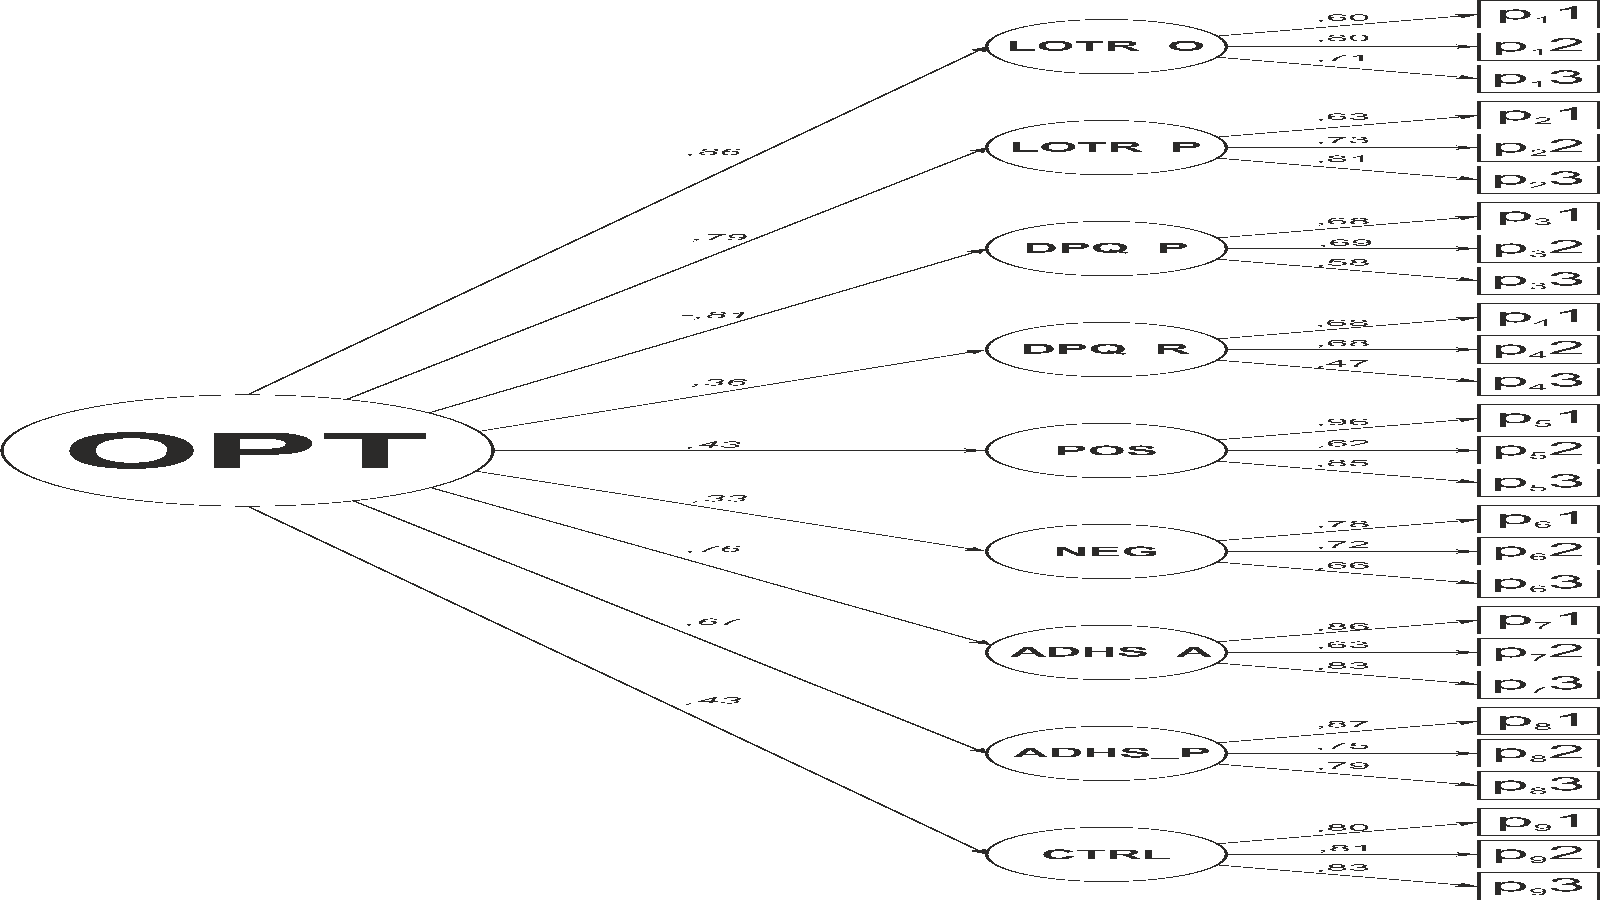
4.2. Model no. 2
In this model, we use nine factors of the first order, each represented by three parcels created from the corresponding items. The mutual relationships between the factors found in model no. 1 are explained here through a single factor of the second order. In summary, we can state that model no. 2 describes the data relatively well (χ2=2706.35; df=315; p≤ 0.01; RMSEA=0.065; 90%CI (0.063; 0.068); Hoelter N 1%=247.67), though naturally slightly less than model no. 1.
The details of the model with structural parameters are shown in Figure
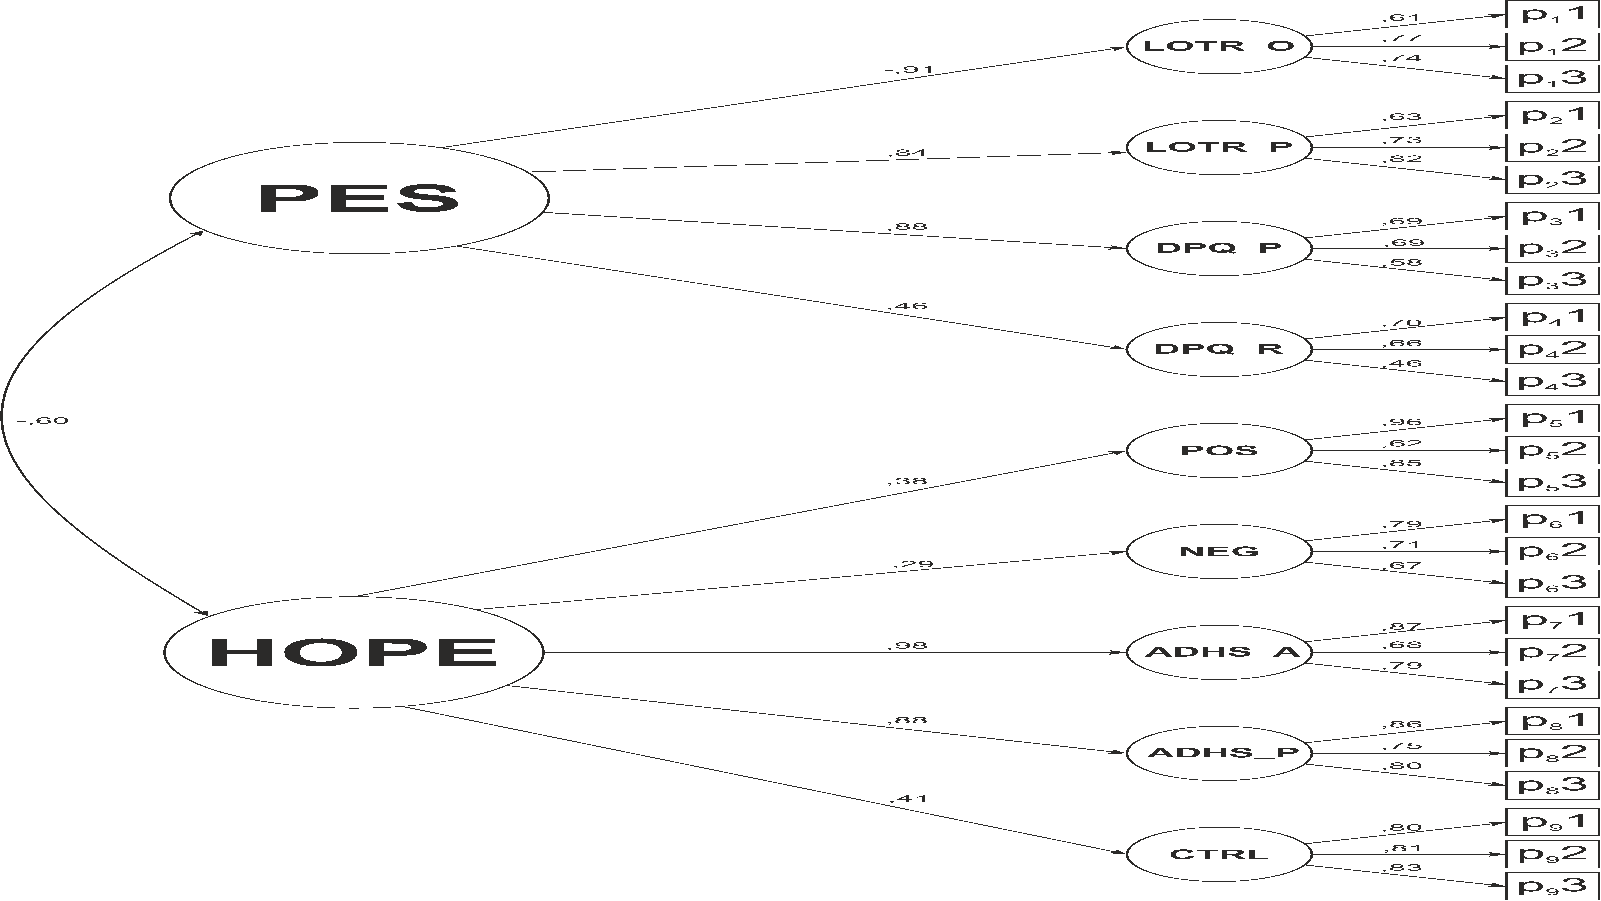
4.3. Model no. 3
In this model, we use nine factors of the first order, each represented by three parcels created from the corresponding items. The relationships between the factors of the first order are explained here via two correlated factors of the second order. Overall, we can state that the model describes the data well (χ2=1893.63; df=314; p≤ 0.01; RMSEA=0.053; 90%CI (0.051; 0.056); Hoelter N 1%=352.52). Model no. 3 shows significantly higher congruence with the data than model no. 2 (decrease in RMSE by 0.012) and its adequacy is even on the level of the significantly more complex model no. 1. The details of the model with structural parameters are shown in Figure
5. Conclusions
The aim of the study was to test a model of optimism with regard to the dimensions of the constructs of dispositional optimism (LOT_O dispositional optimism, LOT_P dispositional pessimism), defensive pessimism (DPQ_P defensive pessimism, DPQ_R reflectivity), unrealistic optimism (POS expectations in relation to positive events, NEG expectations in relation to negative events, CTRL subjective feeling of control over the situation) and hope (ADHS_A agency, ADHS_P pathways). Another goal was to examine the relationship between the constructs of optimism and the construct of hope.
Analyses were performed in three steps and three models were created.
The first model examined factors of the first order. All the selected variables correlated significantly, by which we confirmed their mutual interdependence and their suitability for inclusion as factors of the first order in subsequent models.
The second model operated with a single factor of the second order, Optimism. The closest relationships were found with the factor of dispositional optimism in the positive direction (LOT_O=0.86), followed by the dimension of hope - pathways to the goal (ADHS_P=0.67) and dimension of hope - agency (ADHS_A=0.76). A strong negative relationship to Optimism was found for defensive pessimism (DPQ_P = -0.81) and dispositional pessimism (LOT_P=-0.79). Other factors show only moderately close relationships: expectation of positive events and feeling of subjective control in the positive direction, with anticipation of negative events and reflectivity working in the negative direction.
The third model presents two factors of the second order, called Pessimism (PES) and Hope (HOPE).
The second order factor Pessimism has a strong negative relation to dispositional optimism (LOT_O=-0.91), while defensive pessimism (DPQ_P=0.88) and dispositional pessimism (LOT_P=0.84) operate in the positive direction. The relationship of the factor of reflectivity (DPQ_R = 0.46) is positive and moderately close.
The second order factor Hope has a strong positive relationship to the factor of hope pathway (ADHS_P=0.88) and the factor of hope agency (ADHS_A=0.98). These factors directly correspond to the theoretical basis of the construct of hope. Other factors show only moderately close relationships, with the feeling of subjective control (CTRL=0.41) and the expectation of positive events (POS=0.38) working in the positive direction, while the expectation of negative events (NEG=-0.29) operates in the negative direction.
Both second order factors, Pessimism and Hope, do correlate in the expected negative direction, but their relationship is only moderately close (r=-0.60), and can therefore be confirmed as distinctive constructs which are not redundant. We consider model three as the best suited both statistically and in terms of its explanatory power.
Our model corresponds to Snyder’s concept (in Chang, 2002), who views his construct of hope more actively and specifically in comparison to optimism; it is seen as a collection of thoughts incorporating both the will to take action and the modelling of various pathways towards achieving the set goal. This way of thinking, which is directly reflected in behaviour, is supported in our model also by the subjective feeling of control (dimension of unrealistic optimism), which mirrors the assessment of one’s own resources, capabilities and options. It remains unclear whether this construct corresponds to the real human experience, as discussed in relation to Bruininks & Malle (2005). In both Snyder’s and our definition, the factor of Optimism/Pessimism is associated more with general ideas about our future.
Similar results have also been reached based on structural equation modeling by Bryant & Cvengros (2004). They confirm that both the concept of two independent constructs of optimism and hope, and the reflection of a single dimension which interconnects both constructs are valid. However, even in their research, the greater explanatory power is attributed to the two-factor model of optimism and hope as independent constructs.
Acknowledgements
The present study is a part of the realization of a research project registered under no. 13-19808S supported by the Czech Science Foundation (GA CR).
References
- Alarcon, G. M., Bowling, N. A., & Khazon, S. (2013). Great expectations: a meta-analytic examination of optimism and hope. Personality and Individual Differences, 54, 821 – 827.
- Bruininks, P., & Malle, B. F. (2005). Distinguishing hope from optimism and related affective states. Motivation and Emotion, 29 (4) 9, 327 – 355.
- Bryant, F. B., & Cvengros, J. A. (2004) Distinguishing hope and optimism: two sides of a coin, or two separate coins? Journal of Social and Clinical Psychology, 23, 273 – 302.
- Cantor, N., & Norem, J.K. (1989). Defensive pessimism and stress and coping. Social Cognition, 7(2), 92 – 112.
- Carver, Ch. S., & Scheier, M. (2002a). Optimism. In Snyder,C. R., Lopez, S.J. Eds. (2002). Handbook of Positive Psychology. Oxford University Press.
- Carver, Ch. S., & Scheier, M. (2002b). Optimism, pessimism and self-regulation. In Chang, E.C. Ed. (2002). Optimism & Pessimism. APA, Washington,D C.
- Carver, Ch. S., & Scheier, M. (2014). Dispositional optimism. Trends in Cognitive Sciences, 18, 6, 293 – 299.
- Dosedlová, J., Klimusová, H., Jelínek, M., & Blatný, M. (2004). Optimismus jako pozitivní iluze u současných adolescentů. In Svět žen a svět mužů. Polarita a vzájemné obohacování. Olomouc: UP v Olomouci, 2005, 11.
- Heine, S. J., & Lehman, D. R. (1995). Cultural variation in unrealistic optimism: does the west feel more invulnerable than the east? Journal of Personality and Social Psychology, 68 (4), 595-607.
- Jelínek, M., Květon, P., Vobořil, D., & Klimusová H. (2007). Data collection on the Internet: evaluation of web-based questionnaires. Studia Psychologica, 49, 81-88.
- Little, T. D. (2013). Longitudinal structural equation modeling. London: Guilford Press.
- Norem, J. K., & Cantor, N. (1986). Defensive pessimism: Harnessing anxiety as motivation. Journal of Personality and Social Psychology, 51, 1208 – 1217.
- Norem, J. K., & Chang, E. C. (2002). A very full glass: Adding complexity to our thinking about the implications and applications of optimism and pessimism research. In E. C. Chang (Ed.), Optimism and Pessimism: Implications for Theory, Research and Practice. Washington, DC: APA Press.
- Norem, J. K. (2001). The Positive Power of Negative Thinking. Basic Books, New York.
- Peterson, Ch. (2000). The Future of optimism. American Psychologist 55, 1, 44 – 55.
- Peterson, Ch., & Seligman, M. E. (1987). Explanatory style and illness. Journal of Personality, 55(2), 237-265.
- Rosseel, Y. (2012). Lavaan: an R package for Structural equation modeling. Journal of Statistical Software, 48(2), 1-36.
- Seligman et al. (1988). Explanatory style change during cognitive therapy for unipolar depression. Journal of Abnormal Psychology, 97, 13 – 18.
- Seligman, M.(1990). Learned optimism. New York: Knopf.
- Seligman, M. (2003). Opravdové štěstí. Euromedia Group, Praha.
- Seligman, M. (2013). Naučený optimismus. Jak změnit své myšlení a život. Praha: nakladatelství Dobrovský.
- Scheier, M.F., & Carver, C. S. (1985). Optimism, coping, and health: assessment and implications of generalized outcome expectancies. Health Psychology, 4(3), 219-247.
- Scheier, M.F., Carver, Ch.S., & Bridges, M.W. (1994). Distinguishing optimism from neuroticism (and trait anxiety, self-mastery, and self-esteem): A reevaluation of the Life orientation Test. Journal of Personality and Social psychology, 67, 1063 – 1078.
- Scheier, M. F., Carver, Ch. S., & Bridges, M.W. (2002). Optimism, pesimism and psychological well-being. In Chang, E.C. Ed. (2002). Optimism & Pesimism. APA, Washington,DC.
- Snyder, C. R., Harris, Ch., Anderson, J. R., Holleran, S. A., Irving, L. M., Sigmon, S. T., Yoshinobu, L., Gibb, J., Langelle, Ch., & Harney, P. (1991). The will and the ways: Development and validation of an individual-differences measure of hope. Journal of Personality and Social Psychology, 60(4), 570-585.
- Snyder, C. R. (1994). The Psychology of Hope. New York: The Free Press.
- Snyder, C. R. (2000a). Handbook of Hope: Theory, Measures, and Applications. San Diego: Academic Press.
- Snyder, C. R. (2000b). The Hope mandala. Coping with the loss of a loved one. In Gillham, J.E. (Ed.). The Science of Optimism and Hope. Templeton Foundation Press.
- Snyder, C. R., Sympson, S. C., Michael, S. T., & Cheavens, J. (2002). Optimism and hope constructs: variants on a positive expectancy theme. In In Chang, E.C. (Ed.). Optimism & Pessimism. APA, Washington DC.
- Snyder, C.R., & Lopez, S.J. Eds. (2002). Handbook of Positive Psychology. Oxford University Press.
- Taylor, S. E., & Brown, L. (1994). Positive illusions and well-being revisited: separating fact from fiction. Psychological Bulletin, 116 (1), 21-27.
- Taylor, S. E., & Brown, L. (1988). Illusion and well-being: A social psychological perspective on mental health. Psychological Bulletin 103 (2), 193-210.
- Taylor, S.E. (1989). Positive illusions: Creative self-deception and the healthy mind. New York: Basic Books.
- Weinstein, N. D. (1980). Unrealistic optimism about future life events. Journal of Personality and Social Psychology, 39(5), 806-820.
- Weinstein, N. D. (1982). Unrealistic optimism about susceptibility to health problems. Journal of Behavioral Medicine, 5, 441 – 460.
Copyright information

This work is licensed under a Creative Commons Attribution-NonCommercial-NoDerivatives 4.0 International License.
About this article
Publication Date
22 November 2016
Article Doi
eBook ISBN
978-1-80296-015-0
Publisher
Future Academy
Volume
16
Print ISBN (optional)
-
Edition Number
1st Edition
Pages
1-919
Subjects
Education, educational psychology, counselling psychology
Cite this article as:
Dosedlová, J., Jelínek, M., Klimusová, H., & Burešová, I. (2016). Positive Expectations – Optimism and Hope in Models. In Z. Bekirogullari, M. Y. Minas, & R. X. Thambusamy (Eds.), ICEEPSY 2016: Education and Educational Psychology, vol 16. European Proceedings of Social and Behavioural Sciences (pp. 436-447). Future Academy. https://doi.org/10.15405/epsbs.2016.11.45