
Comparison of Different Unidimensional-CAT Algorithms Measuring Students’ Language Abilities: Post-hoc Simulation Study


Abstract
The purpose of this study is to examine the applicability of Computerized Adaptive Testing (CAT) for English Proficiency Tests (EPT) and to determine the most suitable unidimensional-CAT algorithm that aims to measure language ability of university students. In addition, results of CAT designs were compared to the results of the original paper-pencil format of EPT. For this purpose, real data set was used to create item pool. In order to determine the best CAT algorithm for EPT, three different theta estimation methods, three different Fisher-information based item selection methods and four different Kullback-Leibler divergence based item selection methods and three different termination methods were used. In total, 63 different conditions were taken into consideration and results of these conditions were compared with respect to SEM, averaged number of administered items, reliability coefficients and RMSD values between full bank theta and estimated CAT theta. Results indicated that using different theta estimation methods and item selection methods and termination rules had substantial effect on SEM of estimated theta, averaged number of administered items and RMSD values. Averaged number of administered items decreased to less than 11 items when precision criteria to terminate the analysis was set to .30. Overall, EAP estimation method with Fixed pointwise Kullback-Leibler (FP-KL) item selection and precision based stopping rule (0.20) yield more consistent results with smaller RMSD and SEM. Results indicated that post-hoc CAT simulation for EPT provided ability estimations with higher reliability and fewer items compared to corresponding paper and pencil format.
Keywords: Computerized Adaptive TestingLanguage Testing
Introduction
Developments in computer technologies and the Information and Communication Technologies (ICT) has affected not only different aspect of our lives but also different areas of education such as learning, assessment and language testing (Bennett, 2002; Pommerich, 2004; Fleming, & Hiple, 2004; Rezaie, & Golshan, 2015). As a result of these improvements, different computer-based learning and testing environments have been developed and used instead of tradition methods. One of the indicator of this trend is computerized adaptive tests (CATs) that tailor items of the test to each examinee in order to obtain accurate measurement across the entire latent trait continuum.
CATs are advantageous over non-adaptive tests, because CATs can administer fewer items to examinees while maintaining the same quality of measurement as non-adaptive tests (Weiss, 1983). Therefore, it may increase motivation of test takers and decrease test anxiety and fatigue effect. Another important advantage of CAT is that it is more convenient and feasible with respect to test development, application and reporting the test results. In addition CAT methods enables test developers to standardize testing condition and is less likely to cheat during the process (Song, 2012). Moreover, different multimedia can be implemented to test items which is an impossible feature compared to conventional testing methods (Antal, Eros, & Imre, 2010). Although, CAT seems to be more advantageous compared to paper-pencil test, researchers need to conduct simulation studies in order to see whether developing CAT version of a test is advantageous or not.
There are mainly three different simulation methods in order to determine feasibility of CAT. These methods are called Monte-Carlo simulation, post-hoc simulation and hybrid simulations and using any of these methods depends on the purpose of study or research questions. In the case of Monte-Carlo simulation, both ability parameters and item parameters are simulated by a computer program and using real data is not required. On the other hand, Post-hoc simulation requires real data set administered previously and item pool is constructed with the real items administered. Thus, this method help us see the results of administering a test in CAT rather than P&P format. Another simulation method is called Hybrid simulations which benefit from both post-hoc simulations and Monte-Carlo simulations and this method generally used to cope up with missing data.
Adaptive testing gains increasing popularity year by year. One of the indicator of this trend is that there are many different studies conducted favoring post-hoc simulations based on real data sets in the context of CAT (Gardner et al., 2004; Haley et al., 2009; Smits, Cuijpers, & van Straten, 2011; Betz, & Turner, 2011). On the other hand, there are some other studies which aimed at developing Live-CAT version of tests in paper-pencil format (Hol, Vorst & Mellenbergh, 2007; Gibbons et al., 2008; Chien, Wang, Wang & Lin, 2009; Chien et al., 2011).
Along with the advantages of utilizing CAT, there are also some drawbacks of this testing method that have to be taken into account during the test development process. First of all, CAT cannot be used to measure all types of skills or abilities and also cannot be applied to all subject areas (Rudner, 1988). In addition, CAT procedure requires a sufficient number of items in an item pool which depends on the ability and the number of dimensions being measured (Rudner, 1998; Linacre, 2000). Because, lack of sufficient item pool leads to over exposure of the most informative items. Another drawbacks may occur because of technical problem related to available computer technologies and individuals’ familiarity with computer. CAT administration may be disadvantageous for those who are not very familiar to computers. Therefore, computer literacy level of society should be considered when deciding to develop CAT version of a test.
Computerized Adaptive Testing process, especially for post-hoc studies, mainly consists of five components or steps (Weiss & Kingsbury, 1984; Thompson, 2007). The first step is to determine the content, or the ability, and calibrating the items that measure given ability with an appropriate item response theory model (IRT) in order to construct item pool which occupies an essential place in CAT process.
IRT models provide many advantages during test developments, item calibration and estimating the ability parameters. In addition, item parameters and examinee scores are placed on the same scale which helps to select items that fits best to examinee’s ability parameters. The other steps are related to psychometric properties of CAT algorithms. These steps are as follows (Thompson & Weiss, 2011);
Determining starting rule of CAT
Determining item selection methods
Determining ability estimation method
Determining stopping rules
CAT is an iterative process that continues until the stopping rule is satisfied. A brief information about components of CAT process was provided in the following section in order to enhance how CAT process work.
Starting rule
There are many different methods to start the CAT. The most common starting methods are scalar method which uses same number of items for each examinee; and initial theta method in which each examinee’s initial ability estimates are assumed to be same and items are selected from item pool based on this initial theta value (Nydick, 2015).
After determining the most suitable starting rule, the next step is to determine the item selection methods. Information functions play an important role for item selection methods and items are selected based on the appropriate information functions. Thus items are selected either through Fisher information function which selects the next most informative item given the ability estimate (theta=θ); or Kullback-Leibler distance (or divergence) method; or non-adaptive item selection method in which items are selected randomly. Item selection methods based on fisher information include Unweighted Fisher information (UW-FI), Likelihood-Weighted Fisher information (UW-FI) and Posterior-Weighted Fisher information (PW-FI). The formula for fisher information function is as follows:
(1)
where aj, bj and cj are discrimination, difficulty and pseudo chance parameters for j items, respectively. As can be seen, fisher information function is weighted by real valued weighting function wij. Thus, all three fisher information based item selection methods differs with respect to wij weighting function.
The other most commonly used item selection methods are based on Kullback-Leibler divergence method in which items are selected based on accumulation of Kullback-Leibler (KL) divergence. Item selection methods based on KL-divergence methods include Fixed Pointwise KL divergence (FP-KL), Variable Pointwise KL divergence (VP-KL) Fixed Integral KL divergence (FI-KL) and Variable Integral KL divergence (VI-KL) methods. "FP-KL" and "VP-KL" methods compare KL divergence at two points (P+wij and P-wij) and formula for these two item selection methods are as follows:
(2)
.
where aj, bj and cj are discrimination, difficulty and pseudo chance parameters for j items, respectively, and wij is weighting function (see Chang & Ying, 1996; Nydic, 2015). FP-KL item selection method uses the fixed point, while the VP-KL uses variable point as a weighting function. On the other hand, FI-KL and VI-KL integrates KL divergence across a predetermined area and formula for these two item selection methods are given in formula 3:
(3)
where aj, bj and cj are discrimination, difficulty and pseudo chance parameters for j items, respectively, and wij is weighting function. In addition, aforementioned KL-divergence methods set P equal to theta ( ) and pick up the next item that maximizes the respective criterion during the CAT process (see Chang & Ying, 1996; Nydick, 2015).
The other important component of CAT process is determining scoring or the ability estimation methods. Although, there are some studies favored Classical Test Theory (CTT) based scoring methods (Rudner, 2002), the most of CAT algorithms utilize IRT based ability estimation methods, since the accuracy and precision of IRT-based ability estimation are considered to be higher (Thompson,& Weiss, 2011). Apart from the CTT based scoring methods, which is beyond the scope of this study, there are several available IRT-based ability estimation methods such as maximum likelihood estimation (MLE; Lord, 1980), weighted likelihood estimation (WLE; Warm, 1989), expected a posteriori estimation (EAP; Bock & Mislevy, 1982) and maximum a posteriori estimation (MAP; Samejima, 1969) methods. The latter to ability estimation methods are based on Bayesian estimation methods.
The MLE is used to estimate unknown ability parameters given the examinees’ response pattern which include responses to previously administered items based on the likelihood function. Thus, MLE estimates the most likely ability parameters given the response patterns of examinees. Formula for the likelihood function given the response pattern is as follows:
| (4)
where
, represents
Bayesian estimation methods utilizes prior information of ability parameters and depends on posterior distribution. Initial distribution of ability parameter is called prior distribution and assumed to have a normal distribution with 0 mean and 1 standard deviation, in general. The most commonly used Bayesian ability estimation methods are expected a posteriori (EAP), maximum a posteriori (MAP) and Owen’s normal approximation. MAP estimation is also known as Bayesian modal estimation (BME). All three methods differs from each other with respect to the statistical approach used to derive θ from posterior distribution function. Expected value of posterior distribution function yields EAP ability estimation. Therefore, formula for EAP ability estimation is as follows:
(5)
where gives posterior distribution of θ given the response pattern of examinee j ( . On the other hand, BME estimation proposed by Samejima (1969) take the mod of posterior distribution function in order to calculate final ability estimate. İn other words, the value that maximizes posterior distribution function yields the BME estimation of theta.
Adaptive testing is a circular procedure that ends when the predetermined stopping condition or rule is satisfied (Reckase, 2009; Wainer, 2000). CAT process can be terminated either through precision based stopping rules, or fixed test-length or when theta estimated with a certain reliability interval (Yao, 2012). For precision based stopping rule, CAT process is terminated when the same precision level is satisfied for each examinee. However, test length may differ for each examine in a wide range which may cause inequality during test process. In addition average number of items administered might be larger than corresponding paper-pencil test. On the other hand, when fixed test length stopping rule is favored during CAT process, although, number of items administered for each student will be same, precision level of theta estimates for each examinee might differ based on the test length. Thus, advantages and disadvantages of different stopping rules should be taken in to account before utilizing it for CAT process.
Problem statement
Computerized adaptive testing (CAT) is a comprehensive and complex procedure in which the most informative item given the current ability estimate is selected from an item bank based on the examinee responses to previous items. Although, CAT is advantageous in terms of test-length and ability estimation accuracy, different ability-estimation methods must be examined in accordance with item-selection methods, termination rules in order to determine the best CAT-algorithm for an operational test. Therefore, different simulation studies such as Monte-Carlo simulation, post-hoc simulations and hybrid simulations should be conducted so as to see how well CAT algorithms work and whether they are advantageous or not compared to corresponding paper-pencil format of the test. Thus, post-hoc simulation method based on real data set was favored to determine best CAT algorithm for English proficiency test.
Research question
Central question of this study is: How RMSD, SEM, test-length and reliability coefficients differed when different item-selection, ability-estimation methods and stopping rules were used in the context of unidimensional-CAT and how well the best CAT algorithm determined for English proficiency test performed compared to corresponding paper-pencil test.
Purpose of the study
The purpose of this study is to examine the applicability of CAT for EPT and to determine the most suitable unidimensional-CAT algorithm that aims to measure language ability of university students. Result of this study will provide important information for the Live CAT version of EPT in the long run. For this purpose, real data sets from the EPT were used to create item pool.
Research methods
Item pool
The study is based on 13 English Proficiency Test (EPT) data sets, administered between 2009 and 2013 academic years. The English Proficiency Test (EPT) is a paper and pencil (P&P) test administered by Hacettepe University three times a year (which) and aims to measure university students’ language abilities. Item parameters were estimated with the three-parameter logistic model (3PLM) based on item response theory (IRT), in which the number of items in each test ranges from 59 to 75. Totally, 872 items were calibrated and 46 items with low item discrimination were excluded from the data set. Eventually, item pool consisted of 826 items which was administered to students ranging between 1200 and 2000.
Simulation conditions
For theta estimation, the Maximum Likelihood Estimation (MLE), Expected A Posteriori (EAP) and Bayesian Modal Estimation (BME) methods were used. The latter two theta estimation methods are based on Bayesian methods. As item selection criteria, three different
In order to determine the best CAT algorithm for EPT, 63 different conditions were taken into consideration and results of these conditions were compared with respect to the Standard Error of Measurement (SEM), reliability coefficients, average number of administered items and Root Mean Square Difference (RMSD) values between full bank and estimated CAT theta.Reliability coefficients ( were estimated based on SEM formula:
(6)
where is the reliability coefficient and is the standard deviation of estimated theta. When the SEM and σ is given, then can be derived from the formula 6. Thus, formula for reliability coefficient is as follows:
(7)
Results
In this study, the analyses were conducted in two steps. At the first step, post-hoc simulation was conducted for each theta estimation method with different item selection criteria and stopping rules. Then, different CAT algorithms were compared to with respect to number of items administered, SEM, reliability coefficients and RMSD values between full bank and estimated CAT theta in order to determine the best CAT algorithm for each theta estimation method.
Table
According to the results in Table
On the other hand, when termination criterion was set as a fixed number of 30 items at most, SEM of CAT ranged from .20 to .25, and RMSD values associated with full bank theta and CAT theta ranged from .18 to .86. Likewise, LW-FI item selection criteria yielded the smallest RMSD values, and it was followed by VP-KL and VI-KL criterion, regardless of the termination criteria used.
Table
Table
According to the CAT results in Table
On the other hand, when termination criterion was set as a fixed number of 30 items at most, SEM of CAT ranged from .18 to .23, and RMSD values associated with full bank theta and CAT theta ranged from .19 to .70. Unlike MLE estimation method, PW-FI item selection criteria yielded the smallest RMSD values, and it was followed by FP-KL and VP-KL, regardless of the termination criteria used. In addition, along with small RMSD and SEM values, fixed pointwise KL divergence (FP-KL) yielded smallest number of items administered (13.32).
Table
Table
When the termination criterion was set as precision at .30, the average number of items administered ranged from 10.25 to 12.04, and RMSD values associated with the full bank and CAT theta varied in the range of .32 and .46. On the other hand, the average number of items administered increased substantially when precision criteria sets at .20 rather than .30. It was found that LW-FI item selection method yielded smallest average number of item administered (19.74) and yielded smallest theta RMSD value (0.114) as well. In addition, using precision criteria set at .20 rather than .30 caused a substantial decrease in RMSD values and a slight increase in reliability values associated with each CAT algorithm.
When the termination criterion was set as a fixed number of 30 items at most, the SEM of CAT ranged from .17 to .19, and RMSD values associated with the full bank theta and CAT theta ranged from .22 to .40. Regardless of the termination criteria used, FI-KL item selection criterion yielded the smallest RMSD value (0.224), and it was followed by LW-FI and PW-FI criteria.
Compared to the other theta estimation methods, the BME method with different item selection and termination rules yielded relatively small RMSD and SEM values. In addition, the tests were terminated with a very small number of items with a relatively small range when precision criteria were used as termination rules. In addition, CAT algorithms based on BME methods with different item selection criteria yielded very close and more consistent results with respect to RMSD and SEM values.
When it comes to reliability coefficients, however, CAT algorithms with BME method yielded relatively small reliability coefficients ranging from .44 to .85, compared to the other estimation methods. Especially, reliability coefficients varied in the range of .45 and .65 when termination rule was set as precision at .30, which is relatively small compared to the other CAT algorithms based on MLE and EAP ability estimation methods.
Compared to the other estimation methods, however, CAT algorithms with BME yielded relatively small reliability coefficients ranging from .74 to .82 when precision criterion was set at .20 rather than .30. Unlike relatively small RMSD and SEM values associated with BME based CAT algorithms, it yielded less reliable results compared to the MLE and EAP based CAT algorithms. Overall, VP-KL item selection criterion with fixed and precision (0.20) based termination rules outperformed other CAT algorithms, when BME was used as a theta estimation method.
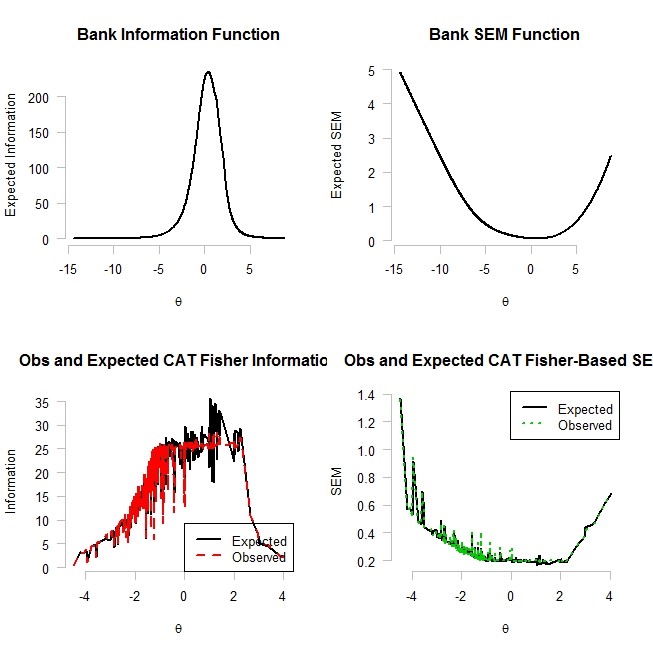
Figure
On the other hand, the other two graphs on the lower left and right hand side present the distribution of observed and expected information and the distribution of observed and expected SEM across the estimated ability parameters. The last two graphs indicate that difference between both observed and estimated information and SEM values were substantially small across the ability parameters.
Conclusion and discussion
In this study, feasibility of unidimensional computerized adaptive testing version of English proficiency tests (EPT) were examined with post-hoc simulation method. For this purpose results of different CAT algorithms with different ability estimation, item selection methods and stopping rules were compared so as to determine best CAT design. In total, 63 simulation conditions were compared with respect reliability coefficients, SEM, RMSD values and average number of items administered. In addition results of these CAT designs were compared to the results of EPT in paper-pencil format.
According to results, both maximum likelihood estimation (MLE) and Bayesian expected a posteriori (EAP) ability estimation methods yielded similar results with respect to reliability coefficients ranging between 0.88 and 0.95 which can be considered quite large compared to corresponding paper-pencil test. Unlike, MLE and EAP estimation methods, however, Bayesian modal estimation (BME) method yielded relatively small reliability coefficients regardless of item selection methods and stopping rules. Thus MLE and EAP outperformed BME ability estimation methods.
Results also indicates that RMSD and SEM statistics associated with MLE were somewhat larger compared to EAP estimation methods. This finding was supported by other studies about CAT in which MLE estimation method appeared to have relatively small biased theta estimates, while relatively large SEM and RMSD statistics compared to Bayesian ability estimation methods (Wang, & Vispoel, 1998; Warm, 1989; Weiss &; McBride, 1984; Bock & Mislevy, 1982). On the other hand, one of the drawback of MLE is that this method cannot estimate theta, when there is all true and all false answers to items which might cause estimation problems at the beginning of CAT and might require more items than other Bayesian estimation methods (Song, 2010).
When it comes to item selection methods, all ability estimation methods were affected from both stopping rules and item selection methods that provided optimal results differed for each method. For instance, likelihood weighted fisher information (LW-FI) and variable pointwise Kulback-Leibler (VP-KL) item selection methods provided optimal solution for MLE, while fixed-pointwise Kulback-Leibler (FP-KL) item selection provided best results for Bayesian EAP estimation method. Although other item selection methods yielded similar results, the SEM and RMSD values between full theta and estimated CAT fluctuated and were not stable as the test length increased.
Another important component of CAT process is stopping rules which directly affect the number of items administered. In this study, three different stopping rule, two of which were based on precision rule (0.30 and 0.20) and one of which was based on fixed test length (30 items), were used. When precision stopping rule was set at 0.30, number of items administered ranged between 13 and 18 for both EAP and MLE estimation method, while number of items administered ranged between 10 and 12 for BME estimation method. Although BME yielded shorter test length, reliability coefficients of each condition were quite small compared to other estimation methods. On the other hand, average number of items administered increased and differed in the range of 25 to 30, while SEM and RMSD values decreased when precision stopping rule was set at 0.20. This results indicates that as the test-length increases so does the precision of theta estimates. In addition, the smallest SEM and RMSD values were obtained when fixed test length with 30 items were used as stopping rule. Thus, both precision criterion with 0.20 and fixed test length with 30 items can be favored since both methods yielded comparable results.
As a result, comprehensive CAT algorithms with different item selection and ability estimation methods yielded more consistent and accurate estimate of students’ English abilities with % 50 to %60 shorter test length (25 to 30 items) compared corresponding paper-pencil format with average test-length of 65 items. Thus, CAT algorithms appeared to be more reliable and efficient with respect to items and times being spend. Different CAT studies across the different areas, such as educational testing and clinical studies, also showed that comprehensive CAT algorithms could estimates abilities, traits or behavior more accurately than short form of corresponding paper-pencil test (Forbey, & Ben-Porath, 2007; Waller & Reise, 1989).
More researches should be conducted to see how different conditions of test developments and structure of items and estimated skills affect the adaptive test applications. The item pool used in this study consisted of dichotomously sored items, and items were calibrated with unidimensional IRT models. Effect of dimensionality of tests and different item structures such as polytomous and mixed format test can be studied in the context of CAT. Along with post-hoc simulations, other simulation methods should also be used to determine best adaptive test algorithms.
.
References
- Antal, M., Eros, L. & Imre, A. (201). Computerized adaptive testing: implementation issues, Acta Univ. Sapientiae Informatica, 2(2), 168-183.
- Bennett, R. E. (2002). Inexorable and inevitable: the continuing story of technology and assessment. The Journal of technology, Learning, and Assessment, 1(1), 1-23.
- Betz, N. E., & Turner, B. M. (2011). Using item response theory and adaptive testing in online career assessment. Journal of Career Assessment, 19(3), 274–286. doi:
- Bock, R. D., & Mislevy, R. J. (1982). Adaptive EAP estimation of ability in a microcomputer environment. Applied Psychological Measurement, 6, 431-444.
- Chang, H.-H., & Ying, Z. (1996). A global information approach to computerized adaptive testing. Applied Psychological Measurement, 20, 213 – 229.
- Chien, T.W., Lai, W.P., Lu, C.W., Wang, W.C., Chen, S.C., Wang, H.Y., & Su, S.B. (2011). Web-based computer adaptive assessment of individual perceptions of job satisfaction for hospital workplace employees. BMC medical research methodology, 11, 47.
- Chien, T.W., Wang, W.C., Wang, H.Y., & Lin, H.J. (2009). Online assessment of patients’ views on hospital performances using Rasch model's KIDMAP diagram. BMC health services research, 9, 135.
- Fleming, S. & Hiple, D. (2004). Foreign language distance education at the University of Hawai'i. In C. A. Spreen, (Ed.), New technologies and language learning: issues and options (Tech. Rep. No.25) (pp. 13-54). Honolulu, HI: University of Hawai'i, Second Language Teaching & Curriculum Center.
- Forbey, J. D., and Y. S. Ben-Porath. 2007. Computerized adaptive personality testing: A review and illustration with the MMPI-2 computerized adaptive version. Psychological Assessment 19(1):14–24.
- Gardner, W., Shear, K., Kelleher, K. J., Pajer, K. A., Mammen, O., Buysse, D., & Frank, E. (2004). Computerized adaptive measurement of depression: a simulation study. BMC Psychiatry, 4(1), 13.
- Gibbons, R. D., Weiss, D. J., Pilkonis, P. a, Frank, E., Moore, T., Kim, J. B., & Kupfer, D. J. (2012). Development of a computerized adaptive test for depression. Archives of General Psychiatry, 69(11), 1104–12.
- Haley, S. M., Ni, P., Jette, A. M., Tao, W., Moed, R., Meyers, D., & Ludlow, L. H. (2009). Replenishing a computerized adaptive test of patient-reported daily activity functioning. Quality of Life Research, 18(4), 461-471.
- Hol, a. M., Vorst, H. C. M., & Mellenbergh, G. J. (2007). Computerized adaptive testing for polytomous motivation items: Administration mode effects and a comparison with short forms. Applied Psychological Measurement, 31(5), 412–429.
- Linacre, J. M. (2000). Computer-adaptive testing: A methodology whose time has come. . In S. Chae, U. Kang, E. Jeon & J. M. Linacre (Eds.), Development of computerized middle school achievement test (in Korean). Seoul, South Korea: Komesa Press.
- Lord, F. M. (1980). Applications of item response theory to practical testing problems. Hillsdale NJ: Erlbaum.
- Nydick, S. W. (2015). An R Package for Simulating IRT-Based Computerized Adaptive Tests. Package ‘catIrt’. Retrieved August 10, 2016. https://cran.r-project.org/web/packages/catIrt/catIrt.pdf
- Pommerich, M. (2004).Developing computerized versions of paper-and-pencil tests: Mode effects for passage-based tests. The Journal of Technology, Learning, and Assessment, 2(6), 3-44.
- Rezaie, M. & Golshan, M. (2015). Computer Adaptive Test (CAT): Advantages and Limitations. International Journal of Educational Investigations. 2-5, 128-137.
- Rudner, L. M. (1998). An online, interactive, computer adaptive testing tutorial. Retrieved April 16, 2015, from http://EdRes.org/scripts/cat.
- Rudner, L. M. (2002). An examination of decision-theory adaptive testing procedures. Paper presented at the annual meeting of the American Educational Research Association, April 1-5, 2002, New Orleans, LA.
- Reckase, M., D. (2009). Multidimensional item response theory: Statistics for social and behavioral sciences. New York, NY: Springer.
- Samejima, F. (1969). Estimation of latent ability using a response pattern of graded scores. Psychometrika Monograph, No. 17.
- Thompson, N. A. (2007). A practitioner’s guide for variable-length computerized classification testing. Practical Assessment Research & Evaluation, 12(1).
- Thompson, N.A., & Weiss, D.J. (2011). A Framework for the Development of Computerized Adaptive Tests Practical Assessment, Research, and Evaluation, 16(1). Also presented at the 2011 Innovations in Testing Conference, Phoenix, AZ.
- Smits, N., Cuijpers, P., & van Straten, A. (2011). Applying computerized adaptive testing to the CES-D scale: A simulation study. Psychiatry research, 188(1), 147–55. doi:10.1016/j.psychres.2010.12.001.
- Song, T. (2012). The effect of fitting a unidimensional IRT model to multidimensional data in content-balanced computerized adaptive testing. Unpublished Doctoral Dissertation. Michigan State University
- Wainer, H. (2000). Computerized adaptive testing: A primer (2nd ed.). Hillsdale, NJ: Lawrence Erlbaum.
- Waller, N. G., and S. P. Reise. 1989. Computerized adaptive personality assessment: An illustration with the absorption scale. Journal of Personality and Social Psychology 57(6):1051.
- Wang, T., & Vispoel, W. P. (1998). Properties of ability estimation methods in computerized adaptive testing. Journal of Educational Measurement, 35, 109-135.
- Warm, T. A. (1989). Weighted likelihood estimation of ability in the item response theory. Psychometrika, 54, 427-450.
- Weiss, D. J. (1983). New horizons in testing: Latent trait test theory and computerized adaptive testing. New York: Academic Press.
- Weiss, D.J., & Kingsbury, G.G. (1984). Application of computerized adaptive testing to educational problems. Journal of Educational Measurement, 21:4 361-375.
- Weiss, D. J., & McBride, J. R. (1984). Bias and information of Bayesian adaptive testing. Applied Psychological Measurement, 8, 273-285.
- Yao, L. (2012). Multidimensional CAT Item Selection Methods for Domain Scores and Composite Scores: Theory and Applications. Psychometrika, 77, 495-523.
Copyright information

This work is licensed under a Creative Commons Attribution-NonCommercial-NoDerivatives 4.0 International License.
About this article
Publication Date
22 November 2016
Article Doi
eBook ISBN
978-1-80296-015-0
Publisher
Future Academy
Volume
16
Print ISBN (optional)
-
Edition Number
1st Edition
Pages
1-919
Subjects
Education, educational psychology, counselling psychology
Cite this article as:
Özdemir, B. (2016). Comparison of Different Unidimensional-CAT Algorithms Measuring Students’ Language Abilities: Post-hoc Simulation Study. In Z. Bekirogullari, M. Y. Minas, & R. X. Thambusamy (Eds.), ICEEPSY 2016: Education and Educational Psychology, vol 16. European Proceedings of Social and Behavioural Sciences (pp. 403-416). Future Academy. https://doi.org/10.15405/epsbs.2016.11.42