
Dimension of Severe Poverty in Romania – a Dynamic Picture of Social Cohesion


Abstract
The paper presents the dynamics of severe poverty, as a minimum threshold of poverty calculated at 40% of median income per equivalent adult. This severe form of poverty is affecting a relatively large mass of population and represents a step towards material deprivation and social exclusion. The severe poverty is an important indicator, along with the common set of European indicators on poverty and social exclusion, developed and quantified by all European countries. To capture as much of this diagnosis of severe poverty as possible, the analyses in dynamics takes into account a multitude of features such as the residence, gender, household size or number of people in the household, age of household head, etc. These assessments capture the dynamic evolution of severe poverty incidence during 2008-2013/2014, expressed by severe poverty rates. Because the ownconsumption size is an important element especially for poor households, or in rural areas, this component was included in determining the disposable income per equivalent adult, when the severe poverty rates were estimated. Databases belong to the Household Budget Survey, conducted by the National Institute of Statistics, Romania, during that period. Shaping this complex picture of severe poverty, especially through the analysis of those determinants, represents a first step toward knowledge of an important dimension of social cohesion. Highlighting the dynamics of this dimension is significant for the analysis of how the severe poverty has evolved over time and contributes, even indirectly, to offering an important feedback in the light of the Europe 2020 Strategy.
Keywords: Povertysevere povertyassessmentdynamicsdeterminants
Introduction
The paper is focused on the severe poverty that represents one of the most aggravating forms of
poverty faced by the most vulnerable populations segments. The main aim of the paper is to conduct
some research and provide some results regarding this extreme form of poverty which still shows high
incidence and affects a large contingent of population. A particularly important objective present both
in Europe 2020 Strategy (The Europe Strategy 2020, www.ec.europa.eu) and in the National Strategy
on Social Inclusion and Poverty Reduction 2015-2020 (Government Decision no. 383/2015) refers to
reducing poverty, especially one of its extreme form, namely severe poverty which still affects a large
number of individuals, families, households. The aim of reducing poverty represents an ex-ante
conditionality laid down by the European Commission to Romania in order to access structural funds
for the period 2015-2020, which shows once again that the reduction of poverty and its severe forms by
year 2020 is a challenging mission, with an equally challenging target, both as objectives and as a
deadline. Along with the targeted indicator included in these strategies (standard poverty rate), the
severe poverty must be paid attention to, as it still affects a large number of people.
These people called "the poorest of the poor people" are among vulnerable groups characterized by
poor living conditions, being beyond the bounds of decency and even human dignity, close to the
threshold of survival. Another important aspect is that for a person who once came into this vicious
circle of severe or extreme poverty, it is difficult or almost impossible to overcome the poverty
threshold by one’s own, which determines a permanent type of extreme poverty for that individual and
a placement of this person for a longer time under the poverty line. In addition, our analysis, as well as
other analyses, show that the most vulnerable categories of the population placed at risk of poverty and
social exclusion have always been and are still now, among others, households with many people, or
those households who have more dependent children, or those who, in addition to children, also count
young people, inactive or unemployed persons, or single parents who have one or more dependent
children, households in rural areas, or households that include any combination of these determinants,
or other similar, etc. (Marginean&Precupetu, 2010, p. 36; World Bank Group, 2015, p. 4; Crai, 2009,
pp. 8-10). As such, the support of those particularly vulnerable groups represents an elementary sample
of dignity of any society, and it is also a national priority, because these vulnerable groups should be
considered with priority in the national target for reducing poverty and its extreme forms. Therefore
these quotas should be known in terms of numbers, of their socio-economic characteristics posed by
various structures, to act more directly against them with specific, more efficient and effective policies.
Thus, the main purpose of the paper is to achieve the profile of severe poverty in Romania and to
analyse this picture in dynamic, to see how much the national level of poverty was reduced in the light
of common European strategic objectives with this short deadline of 2020. To achieve this purpose, the
main objectives of this paper are to analyse the dynamic evolution of severe poverty incidence, by
severe poverty rates, from the perspective of its main determinants: area of residence, household size,
age of household head, etc., since it was found that these determinants, along with education level,
generate the highest incidence values of poverty and its severe and extreme forms.
This picture of severe poverty, identified in the paper by severe poverty rate, can be highlighted
using EUROSTAT data (which are based on EU-SILC Survey) or using data from Household Budget
Survey. As these two national surveys conducted by the National Institute of Statistics have different
methodologies and samples, data on poverty / severe poverty are also different. The Ministry of
Labour, Family, Social Protection and Elderly drafted Reports regarding the analysis of social inclusion
indicators (Statistical data analysis of social inclusion indicators in 2011; Social inclusion report for
2010-2013), which include poverty and severe poverty indicators, but they are based on the concept of
absolute poverty; the relative poverty is used in EUROSTAT statistics for comparative analyses at
international level. There are some differences between absolute poverty and relative poverty, based on
different concepts and assessment methodologies, so the data are different.
Data obtained from the estimations regarding the severe poverty rates presented in this paper,
especially for the entire population, could be different from those presented in EUROSTAT statistics
(Income, social inclusion and living conditions, Monetary poverty indicators, 2007-2014), or in the
Reports of the Ministry of Labour, Family, Social Protection and Elderly (
social inclusion indicators in 2011; Social inclusion report for 2010-2013). This is possible because
the methodologies are different, also the samples and micro-data from these both used surveys, as we
mentioned. But comparing all these severe poverty rates, the differences are not so significant to create
some special debates.
In the present paper we analyse severe poverty rates based on HBS data, with the relative concept of
poverty at its core, in order to achieve some international comparisons that put Romania along with
other 30-33 European and non-European countries reporting to EUROSTAT indicators of poverty and
social inclusion (GuvernulRomaniei/Romanian Government, 2014, p. 109; Eurostat, 2016; Eurostat,
2015); these analysis showed that Romania is generally placed on the last position in relation to
poverty and severe poverty as total population and also large families with many dependent children
and young people are concerned, etc.
Materials and Methods
The severe poverty picture was shaped based on the incidence of severe poverty indicator. The
difference from the standard considered poverty refers to the calculation of the threshold; the severe
poverty is applied to the 40% threshold of median income per equivalent adult, as defined in the
specialized documentation (Methodology – Social inclusion indicators system; www.statistici.insse.ro).
The calculation of this ratio to the threshold of 40% of median income was achieved per person and on
the basis of disposable income including the own-consumption; estimations are based on the
Household Budget Survey results, conducted by the National Statistics Institute. Since the own-
consumption size is an important element, especially in poor households, or in rural areas, etc., this
component was included in determining of the disposable income per equivalent adult when severe
poverty rates were calculated. Available data on severe poverty rate at the entire population covered the
period 2000-2014 and in structure, data were available only for the period 2010-2013. The available
structure for dynamic analysis of severe poverty rates was the following: gender, area of residence,
household size, age of the household head. Even if the incidence of severe poverty is not a directly
strategic indicator in the list of common indicators monitored at international level(Income, social
inclusion and living conditions, Monetary poverty indicators, 2007-2014), it must be still considered in
the light of the main objectives of national and international strategies about reducing poverty and its
extreme forms (severe poverty, material deprivation, marginalization and social exclusion).
Given the existence of certain size restrictions of the paper, we will not analyse the common
indicators presented in EUROSTAT statistics which highlight the benchmarking in terms of poverty
and severe poverty, through a variety of aspects of its main determinants, emphasized by specific
indicators regarding the Romania's position compared to other 30-33 European and non-European
countries from these statistics(Income, social inclusion and living conditions, Monetary poverty
indicators, 2007-2014) which provided an important documentary support.
Results
At risk of severe poverty rate – total population
The analysis showed that the severe poverty rate per person, at the total population, calculated at the
40% of median income, increased considerably during 2000-2008 (from 5.11% in 2000 to 6.1% in
2008), and afterwards it entered on an important descending path until 2012 (from 6.1% in 2008 to
4.98% in 2012). After years of decline, in the past two years the severe poverty increased again and
then it slightly decreased to 5.37% (in 2014). The rate of severe poverty presents an oscillating trend
(Fig. 1), alternating the periods of growth (during 2000-2008) with decrease ones (during 2009-2014).
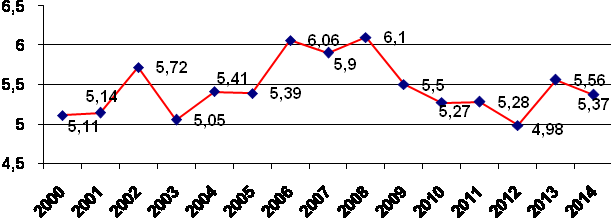
Source: estimations based on Household Budget Survey results, National Institute of Statistics
In the present paper, considering the existence of certain size restrictions, only three of the most
important determinants will be deeply analysed, namely the area of residence, the household size and
the age of the household head, because it is known that the poverty and also the severe poverty have
the highest incidence of the rates in these situations.
At risk of severe poverty rate – by area of residence
As with the standard poverty, when the rural poverty was alarmingly high (well above the standard
poverty rate in the total population), concerning the severe poverty we are also facing with high rates,
well above the severe poverty line (exceeding it almost twice), that represents a warning signal, and
special measures should be directed mainly to reduce rural poverty and severe forms of poverty the
rural population is facing.
While in urban areas, severe poverty varies around 2.5% threshold, the rural severe poverty has high
levels, being over the 10% threshold. Thus, rural poverty was and remains still a problem to be
prioritized within the lines of action for poverty reduction, considering the European and national
strategic common goals. In rural areas we also noticed a permanent presence of severe poverty (Fig. 2),
so this extreme form of poverty has reached alarming values for a long period of time (the paper
covered only the period 2010-2013, but in the previous years the rural severe poverty had significant
values, too).
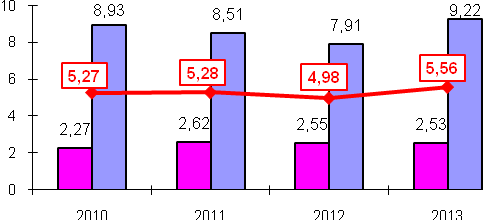
Source: estimations based on Household Budget Survey results, National Institute of Statistics
At risk of severe poverty rate – by household size
Regarding the household size, we are considering the number of people who live in the household
and not necessarily the number of children in the household. It is an important issue because both
poverty and its severe form registered among these numerous households are important, but both forms
of child poverty are particularly significant, too.
For households consisting of 5 persons, severe poverty rate increased significantly, reaching to 8%,
well above the total rate of severe poverty. Regarding households with 6 and over 6 members, severe
poverty rates were and are still now particularly high, ranging between 13-14% in this period, well
above the total severe poverty rate. These values are particularly significant for large households, with
many members, showing not only that such households are poor, but also that the permanent poverty
and severe poverty are particularly acute for them (Fig. 3).
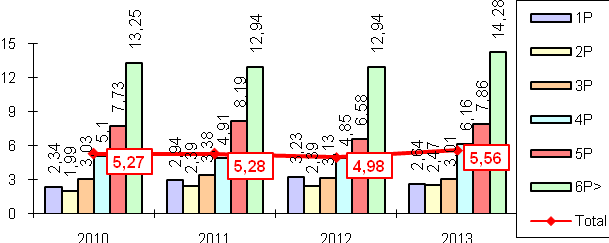
Source: estimations based on Household Budget Survey results, National Institute of Statistics
Because the severe poverty rates for these large household have high value over time, that means
that large households, with many people, but especially dependent children, need a special support to
be taken out of poverty and severe poverty lines. These high rates in the case of households with many
members, especially with children, must always be a priority in the social policy regarding the
protection of the families with children, to reduce poverty and its extreme forms for these vulnerable
groups. At risk of severe poverty rate – by age of the household head
By the age of the household head, the highest rates of severe poverty are found in households
headed by adults, aged 30-44 years, reaching rates range between 7-8% over this period (Fig. 4).
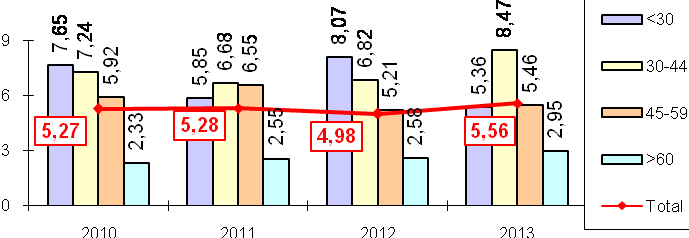
Source: estimations based on Household Budget Survey results, National Institute of Statistics
Young people less than 30 years old, and persons aged 45-59 years continue to register high rates of
severe poverty, close enough values for both these segments of population, severe poverty ranging between
5-8% during 2010-2013. Instead, households headed by retirees (aged over 60 years) recorded the lowest
rates of severe poverty, which ranged between 2-3%, far below the severe poverty rates (5-5.5%).
4Discussion
In conclusion,
2010-2013 (data of Household Budget Survey, conducted by the National Institute of Statistics):
-
poverty rate (nearly 2 times the rate of severe poverty), which represents a warning signal, and special
measures should be directed mainly to reduce rural poverty, severe forms and the extreme poverty, the
population in these rural areas are facing.
-
rates and because the rates of severe poverty are still reaching high values (almost 8% for households
consisting of 6 people and nearly 15% for households consisting of 6 members and over), this means
that large households, consisting of many people, especially of dependent children, need an increased
support to be taken out of poverty and severe poverty lines, especially as the history of these
households is one of permanent, severe and profound poverty, over time.
-
households are headed by persons aged 30-44 years, which placed high severe poverty rates in the
range between 6-8%, over the severe poverty line recorded in this period. Households headed by
retirees do not register a risk of severe poverty; these rates recorded the lowest values that varied within
the range of 2-3%, far below the severe poverty rates (5-5.5%).
Discussion
In conclusion,
-
-
-
- it can be noted a
recorded significant values all the time, both for rural households, large households, young people, and
children. For these households, the rates of severe poverty had over time large values and even at one
moment they recorded a minimum rate, then it recovered, continuing the upward trend and reaching
thresholds that must be considered as a warning signal and priorities for special targeted measures.
- in the recent years,
poverty rates decreased in the recent years compared to those recorded at the beginning of analyzed
period (2006-2008, when the maximum threshold of 6% has been reached), regardless of its
determinants, and even for the total population – this represented an important step, but actions should
focus, in the future, on these vulnerable groups, because the values of poverty and severe poverty rates
still remain high for some types of households, despite the efforts to reduce poverty and its severe and
extreme forms.
For these reasons, the profile of the target group facing poverty and severe poverty must be
permanent known more deeply, to act more targeted towards the common goals to reducing poverty
and its extreme forms. The analyses showed that, always the most vulnerable categories of the
population placed at risk of poverty and social exclusion were, among others, large households, those
who have dependent children or those who, besides children, have also young people who are not in
education and not in employment, or inactive or unemployed person, or single parent having one or
more dependent children, households in rural areas, etc.
Thus, the size and the structure of households with many people, especially those who have several
children, must be considered a priority for targeted special measures to reduce poverty and its extreme
forms. In addition, for these large households, any combination of such determinants as education
level, age, employment situation correlated with low income, health status and other variables such as
gender, area of residence, etc., contribute to the fact that poverty and its severe or extreme forms
become even more amplified in these vulnerable households.
Conclusion
Such continual assessments and monitoring of poverty and its severe and extreme forms should
always be carried through, especially because these households that are vulnerable to poverty often
include dependent children or even young people, these households being quite representative of the
poor population and total population. Moreover, the presence of children in a household contributes to
the increase of consumption without bringing additional and adequate income resources. Thus,
children, as well as young people, will continue to be one of the most at risk of povertycategories, as
long as these population categories are not targeted by more efficient support programs. Such measures
are necessary to prevent the risk of perpetuating poverty and its extreme forms, the transmission of
these forms of poverty to the next generation, given that, for young people and especially for children,
poverty also means multiple risks related to health and physical development, to the participation in
education, with further implications on their future capacity to work, on employment and obtaining
proper earnings to ensure their future, for a decent standard of living i.e. to ensure a better quality of
life for them and their families, and thus to no longer be in the social protection net and exit the status
of permanent social-assisted persons.
The substantiation of such social policies and the instruments needed for their implementation
involve, in the first place, the quantification of poverty and severe poverty. These analyzes are
particularly important as they allow accurate knowledge of the size of poverty and severe poverty in
different structures, by its main determinants, that also constitute important forerunners for further
analyses, but also to highlight those warning signals that must become major concerns and efforts to
improve more pronounced and consistent the action directions for reducing poverty and its severe and
extreme forms.
This trinomial relationship regarding the concrete diagnosis of poverty and severe poverty
(performed by analyses of statistical data from national surveys in multiple structures, as well as
benchmarking), along with the analyses of the main social benefits with direct or indirect role in
poverty reduction, as well as the impact evaluating of these programs / policies on reducing poverty
and severe poverty represent an essential triangle based on which these policies can be better targeted,
more efficiently and effectively.
While this paper focuses on one of these three aspects, that is the highlighting of severe poverty,
research may continue with the analysis of these social benefits with the aim of reducing poverty, but
also the impact analyses of these benefits on poverty, ex-post and ex-ante impact assessment; these
recommendations for further research regarding the impact assessments could lead to highlighting
some main lines of action for reducing poverty and its extreme forms, as a targeted answer of common
strategic objectives.
Because poverty and its severe and extreme forms, marginalization and social exclusion, constitute a
significant coordinate of social ethics and social responsibility, reduction of these poverty forms must
be regarded as a central and permanent objective of social policy, which should be correlated at the
same time with a coherent social protection system, to prevent poverty by providing adequate
replacement income, to support the vulnerable groups of the population, while encouraging the return
on the labour market - as an important tool for reducing poverty and its extreme forms.
References
- ***, The Europe Strategy 2020, available online at:http://ec.europa.eu/eurostat/web/europe-2020indicators/europe-2020-strategy.
- The National Strategy on Social Inclusion and Poverty Reduction 2015-2020 (StrategiaNaţionalăprivindIncluziuneaSocialăşiReducereaSărăciei 2015-2020), GD no. 383/2015.
- Marginean, I., Precupetu, I. (coordinators), Dumitru, M., Mihalache, F., Mihailescu, A., Neagu, G., Popescu, R., Preoteasa, A.M., Tufa, L., Vasile, M.(2010).Calitateavieţiiîn Romania / The quality of life in Romania.
- World Bank Group (2015). Romania Partnership, Country Program Snapshot.
- M. (2009). Romania – O Crai, E., Grigoras, V., Pauna, C., Pop, L., Stanculescu, Evaluarerapidaaimpactuluicrizeieconomiceasuprasaraciei[Romania – A quick impact assessment of economic crisis on poverty].Romania: Unicef& World Bank Team.
- Ministry of Labour, Family, Social Protection and Elderly, Social Services and Social Inclusion Direction (***).Analizadatelorstatisticeprivindindicatorii de incluziunesociala din anul 2011 [Statistical data analysis of social inclusion indicators in 2011].
- Ministry of Labour, Family, Social Protection and Elderly, Social Services and Social Inclusion Direction (***).Rapoarteprivindincluziuneasociala in Romania in anii 2010-2013 [Social inclusion report for 2010-2013].
- GuvernulRomaniei/ Romanian Government, (2014).Strategia de dezvoltare teritoriala a Romaniei / Territorial Development Strategy of Romania, Coeziune si competitivitate teritoriala, dezvoltare si sanse egale pentru oameni / Cohesion and territorial competitiveness, development and equal opportunities for people, Version 2, 2014.
- Eurostat, Statistics explained, Income distribution statistics, Febr. 2016.
- Eurostat, Statistics explained, People at risk of poverty or social exclusion, Dec. 2015.
- Eurostat databases, Income, social inclusion and living conditions, Monetary poverty indicators, 2007-2014, see http://ec.europa.eu/eurostat/web/income-and-living-conditions/data/database.
- *** (2006).Metodologia Sistemulindicatorilor de incluziune sociala [Methodology – Social inclusion indicators system], Order no. 60/2007 regarding the methodology of social inclusion indicators system.
- National Institute of Statistics, Tempo online databases, A.5.Level of living, Module 1.Poverty and social exclusion, http://statistici.insse.ro/shop/index.jsp?page=tempo2&lang=ro&context=20.
Copyright information

This work is licensed under a Creative Commons Attribution-NonCommercial-NoDerivatives 4.0 International License.
About this article
Publication Date
04 October 2016
Article Doi
eBook ISBN
978-1-80296-014-3
Publisher
Future Academy
Volume
15
Print ISBN (optional)
-
Edition Number
1st Edition
Pages
1-1115
Subjects
Communication, communication studies, social interaction, moral purpose of education, social purpose of education
Cite this article as:
Stroe, C., Cojanu, S., Militaru, E., & Dragoiu, C. (2016). Dimension of Severe Poverty in Romania – a Dynamic Picture of Social Cohesion. In A. Sandu, T. Ciulei, & A. Frunza (Eds.), Logos Universality Mentality Education Novelty, vol 15. European Proceedings of Social and Behavioural Sciences (pp. 975-983). Future Academy. https://doi.org/10.15405/epsbs.2016.09.121