
Innovation Progress at International Level


Abstract
Innovation worldwide is a key factor for increasing competitiveness and ensuring progress, being an effective way to respond to different challenges of climate change and sustainable development, and also an important way of adaptation to new social and economic needs. The article offers an analysis of the evolution of innovation at an international level during the period 2007-2014, putting under the loupe 34 countries in Europe. The analysis is based on values of summary innovation index proposed by the European Commission to measure the competitiveness of European countries in terms of innovation activity. Another direction of analysis pursued in this paper is to identify the level of influence showed by a number of indicators, which contribute to the development of this summary innovation index, on the performance of the analysed countries.
Keywords: Innovationprogresssummary innovation index
Introduction
Innovation, viewed as the totality of changes made with the aim of implementation and of using the
new types of products, means of production and transportation, markets and forms of organization of
the production process is often given by the market and changes occurring within this (Schumpeter,
1934). Peter Drucker (2002) targets unexpected events, inconsistencies, needs of processes, industry
and market changes, demographic changes, changes of perceptions and the appearance of new
knowledge in various fields, as being the main sources of innovation. Unexpected situations can often
generate the appearance of innovations that can have significant effects on the medium and on the long
term, both at a company and at a country level.
The positive impact of innovation on economic performance of companies in different sectors has
been highlighted in numerous analyses performed in countries such as Finland, Italy, UK, Canada etc.
(Leiponen, 2009; Cefis et al., 2005; Bilbao-Osorio et al., 2004; Gu et al., 2004). Starting from the
innovation's results at a microeconomic level, one can find their influences at a macroeconomic level as
well. Thus, analyzing the impact of technological innovation on the economic growth of a country,
Zalewski and Skawinska (2009) highlights the existence of a correlation between the evolution of
innovation index (SII) and the performance indicators at the macroeconomic level (gross domestic
product, labor productivity and high technologies export). Keeping the same line, in an analysis of 115
countries based on 25 indicators, Fagerberg and Srholec (2008) identify a positive correlation between
innovation system and gross domestic product per capita.
Based on the positive impact of innovation, the European Commission outlined common strategies
for the European Union countries with the purpose of increasing innovation activities at an European
level and achieving the level of performance recorded in this area by United States and Japan. Thus it
was created an aggregate indicator of innovation (Summary Innovation Index) to allow the
measurement of the performance level of innovation and the adoption of some effective strategies for
the purposes of intensifying its influence on the macroeconomic level.
The paper, structured in two stages, analyzes the evolution of the European countries in terms of
innovation and the level of influence of each indicator on the aggregate indicator of innovation.
The analysis aims to provide an overview of innovation activities at an European level in order to
facilitate the identification of the main criteria to be fulfilled for the process to be a success and the
identification of those dysfunctions that make it more difficult. The second stage of study of this paper
is intended to identify those indicators that can contribute substantially to raising the level of the
aggregate indicator of innovation, in order to concentrate the resources and the policies at a country
level in the direction that can bring the most benefits.
Materials and Methods
The analysis covers the period 2007-2014 and is based on a series of indicators involved in the study
in two stages, as outlined its purpose.
In the first stage, there were used annual data included in the Innovation Union Scoreboard,
developed by the European Commission at the end of each year, which reflects the innovation activity
of 34 European countries: Romania, Bulgaria, Macedonia, Turkey, Latvia, Lithuania, Croatia Poland,
Slovakia, Greece, Hungary, Spain, Serbia, Malta, Portugal, Italy, Cyprus, Czech Republic, Norway,
Estonia, Slovenia, Austria, France, Belgium, Iceland, Ireland, United Kingdom, Luxembourg,
Netherland, Germany, Finland, Denmark, Sweden and Switzerland. To determine the evolution of
innovation activity at the European level, there was used aggregate indicator of innovation (SII) based
on 25 indicators. The 25 indicators present and defined in the Innovation Union Scoreboard are: 1)
New doctorate graduates per 1000 population aged 25-34 (DOC); 2) Percentage population aged 30-34
having completed tertiary education (TE); 3) Percentage youth aged 20-24 having attained at least
upper secondary education (USE); 4) International scientific co-publications per million population
(ISC); 5) Scientific publications among top 10% most cited publications worldwide as % of total
scientific publications of the country (Sp); 6) Non-UE doctorate students as a % of all doctorate
students; 7) R&D expenditure in the public sector (% of GDP) (RD_ps); 8) Venture capital (% of
GDP); 9) R&D expenditure in the business sector (% of GDP) (RD_bs); 10) Non-R&D innovation
expenditure (% of turnover) (NR_d); 11) SMEs innovating in-house (% of SMEs) (SME_ih); 12)
Innovative SMEs collaborating with others (% of SMEs) (SME_sc); 13) Public-private co-publications
per million population (PP_cp); 14) PCT patent applications per billion GDP (PCT_ap); 15) PCT
patent applications in societal challenges per billion GDP (PCT_sc); 16) Community trademarks per
billion GDP (CT); 17) Community designs per billion GDP (CD); 18) SMEs introducing product or
process innovations (% of SMEs) (SME_pi); 19) SMEs introducing marketing or organizational
innovations (% of SMEs) (SME_mi); 20) Employment in fast-growing enterprises in innovative sectors
(% of total employment); 21) Employment in knowledge-intensive activities (% of total employment)
(E); 22) Exports of medium and high-technology products as a share of total product export; 23)
Knowledge-intensive services exports as % of total services exports (K); 24) Sales of new-to-market
and new-to-firm innovations as % of turnover (Sales); 25) License and patent revenues from abroad as
% of GDP (License) (www.ec.europa.eu).
The second stage aims analyzing the level of influence of these indicators on the aggregate index
(SII). Due to the lack of information, the number of analyzed indicators was reduced from 25 to 21,
being removed from the analysis indicators such as non-UE doctorate students as a % of all doctorate
students; Venture capital (% of GDP); Employment in fast-growing enterprises in innovative sectors
(% of total employment); Exports of medium and high-technology products as a share of total product
export. The lack of information has led to the reducing of the number of countries analyzed, from 34 to
28, from the database used in the first stage of the study being removed Macedonia, Serbia, Slovenia,
Iceland, United Kingdom and Switzerland.
To achieve the goal of the article, there have been used, in the first stage, a direct comparative
analysis of the aggregate indicator of innovation (SII) for the 34 countries in the period 2007-2014, in
second stage being selected a panel analysis including dates from 21 indicators (independent variables)
and the aggregate indicator (dependent variable), for the period 2008-2014. The data used were
obtained from the information provided in the Innovation Union Scoreboards for the 8 respectively 7
analysed years.
Results
3.1.Innovation in Europe
Considering the size of the aggregate indicator of innovation in the 34 studied states, there was
performed a division of them into 4 groups: innovation leaders, innovation followers, moderate
innovators, modest innovators. Related to 2014, an overview over the innovation performance of
European countries highlight among the countries with a high degree of innovation (innovation leaders)
Switzerland and Sweden, on the opposite side (moderate innovators) being Romania and Bulgaria.
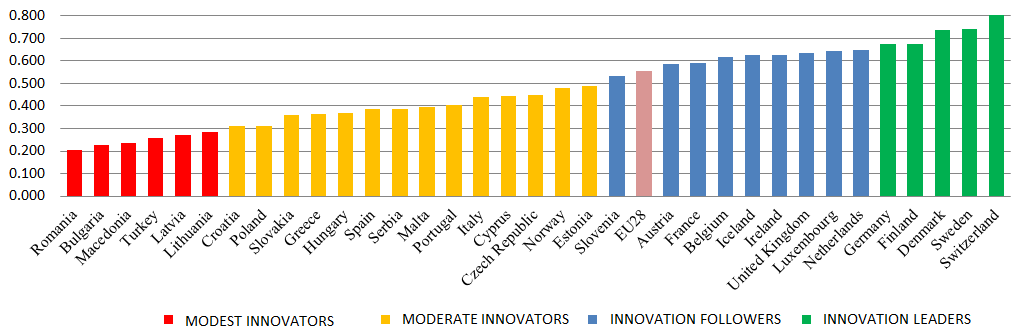
Source: own processing
At the European level, the year 2014 brings an increase in average of aggregate indicator of
innovation (SII) of 0.001, from 0.554 to 0.555. Among the countries that recorded decreases in 2014
compared to 2013 are Romania and Lithuania from the modest innovators group, Greece, Spain, Italy,
Cyprus, Norway and Estonia from the moderate innovators group, Austria, Belgium and Luxembourg
from the innovation followers group and Germany, Finland and Sweden in the innovation leaders
group. Dividing the results achieved in 2014 to those from 2007 there can be seen an increase of about
6% of the indicator average at European level.
From the modest innovators group, Turkey recorded the most spectacular increases of SII, reaching
increases of about 60% in 2014 compared to 2007.
From the moderate innovators group, significant increases in recent years are highlighted in
countries such as Serbia, up to 50% in 2014 compared to 2007 and Malta, up by 22%. On the opposite
side, there are countries such as Spain and Cyprus which recorded declines of the indicator value in
2014 compared to the first year covered (2007).
The innovation followers group presents a relatively constant evolution, being characterized by
significant jumps. Within this group, one can distinguish Slovenia, with an increase of approximately
20% in 2014 compared to 2007. Though they recorded significant growth (12% in 2014 compared to
the values recorded in 2007), the Netherlands and the United Kingdom are positioned at the top level in
the innovation followers group. Among the most favourably positioned countries in this group, there
are Slovenia, Austria and France. With the exception of Slovenia which has an undisputed evolution of
aggregate indicator of innovation from 2007 to 2014, the other three countries have recorded relatively
constant values throughout this period.
Insignificant variations have been recorded within the 5 countries, innovation leaders, the aggregate
indicator values being maintained almost constant during the period 2007-2014. Luxembourg, was part
of this group in 2013, recording lower values of the indicator in 2014, a situation that prompted its
passage in the innovation followers group.
The structure of the four groups does not suffer significant changes from year to year, but within
them there are smaller or larger changes of position due to the decrease or increase of the value of
aggregate indicator. This situation is characteristic of Romania, that has reached on the last position of
the modest innovators in 2014, being surpassed by countries such as Turkey, Bulgaria and Macedonia.
3.2.Determinant indicators of innovation
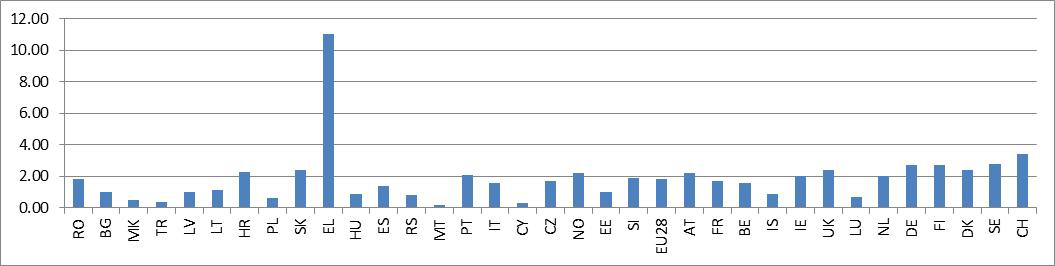
The position of the analysed countries, in term of size of the aggregate indicator of innovation, can't
be maintained for the 25 indicators. Thus, the first determinant indicator of aggregate indicator of
innovation (new doctorate graduates per 1000 population aged 25-34) causes a different positioning of
the 34 countries. Figure
indicator ” new doctorate graduates per 1000 population aged 25-34” and not the aggregate indicator
values. If in the case of the size of the aggregate indicator Switzerland occupies the first position, in
this case the first place is occupied by Greece.
The major differences arising between the level of aggregate indicator and the level of determinants
indicators lead to the need of analysing the dimension of the inter-correlation between those two type
of variables.
Thus, it is necessary to identify the impact that each indicator can have over the aggregate indicator
of innovation. For the analysis were used logarithmic values of the dependent variable (IIS) and the
independent variables (DOC, TE, USE, ISC, SP, RD_PS, RD_BS, NR_D, SME_IH, SME_SC, PP_CP,
PCT_AP, PCT_SC, CT, CD, SME_PI, SME_MI, E, K, SALES, LICENSE).
Multiple regression analysis will indicate which is the dimension of the causality link between the
dependent variable and the independent variables previously listed and defined.
Explicit equation: WR_PB=C(1)+C(2)*DOC+C(3)*TE+C(4)*USE+C(5)*ISC+C(6)*SP+C(7)*RD_PS+C(8) *RD_BS+C(9)*NR_D+C(10)*SME_IH+C(11)*SME_SC+C(12)*PP_CP+C(13)*PCT_AP+C(14)*PC T_SC+C(15)*CT+C(16)*CD+C(17)*SME_PI+C(18)*SME_MI+C(19)*E+C(20)*K+C(21)*SALES+ C(22)*LICENSE, (1)
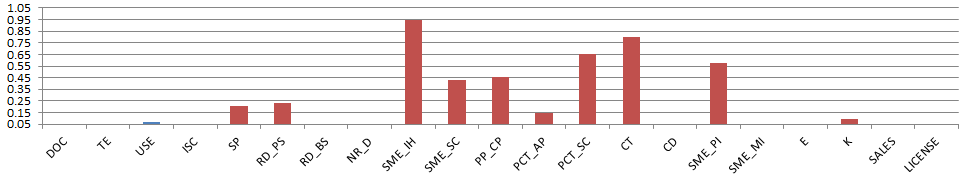
Analysing the results from Table 1, it is noted that the major influence on the aggregate indicator
value is given by TE (16.93%), USE (12.31%), ISC (11.90%), SME_MI (16.55%), E (13.26%) and
SALES (6.42%). The other indicators such as SP, RD_PS, SME_IH, SME_SC, PP_CP, PCT_AP,
PCT_SC and CT, affect the aggregate indicator dimension to a very small extent, their probability of
being statistically insignificant exceeding the limit of 10%.
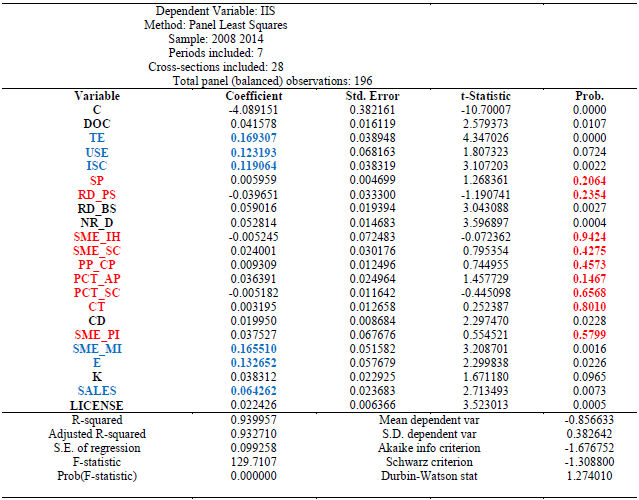
Source: own processing using EViews
Although they have recorded positive values of coefficients, the variables DOC, RDBMS, NR D,
CD, K, LICENSE have an insignificant impact on the aggregate indicator. For a graphic illustration of
the values obtained for the 21 variables, figures
variables and their probability to be statistically insignificant.
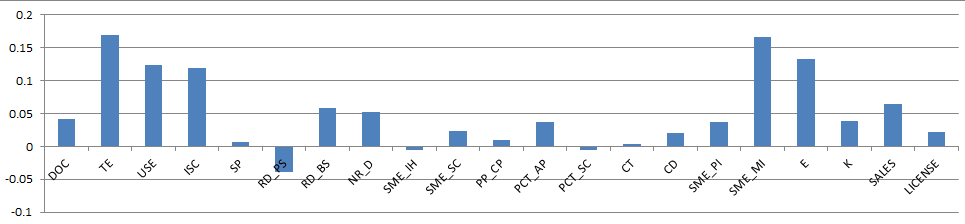
The impact of the 21 analysed indicators on the SII is 93.27%, the difference being given by the
indicators that were not used in the analysis due to lack of data. Considering the impact level associated
with the 4 indicators (6.73%), it cannot be discussed the impossibility of formulating some sustainable
conclusions based on the existing data.
Discussion
The importance of analysing the dimension of the impact of each dependent variable on the
independent variable is given by the need of focus on those segments or areas which may have a
significant impact on macroeconomic results at the level of which country and which may increase
performance relative to other European countries.
The analysis made on the 28 countries release the need of focus on the most important elements that
can offer the highest level of performance in innovation. Thus, at a country level, there should be given
special importance to the level of education and absorption of the population in the tertiary education,
the level of graduation in the university education, the research conducted at international level in
different fields, the number of companies that develop organizational and marketing innovations, the
sales volume of products, new to the firm or new to the market and the number of employees engaged
in technology intensive activities.
The investments in human resources and providing the necessary support to companies in order to
ensure their development and a high level of accessibility to the market, for commercialization of
innovative products, can represent viable solutions to reduce the gap between innovation leaders and
modest innovators. The results also show that the link between research and development expenditure
in the public sector does not generate positive results of innovation. The impact that research and
development activities have on the innovation performances is considered to be important only in the
private sector. In this situation it can be considered appropriate an identification of those forms of
public-private partnership or those financing methods suited to conduct the research and development
activities in the private sector. Because the entire innovation activity is part of a system, the innovation
success is conditioned by its functionality. Thus, the countries with a high capacity of innovation and a
functional governmental system, are capable of achieving important economic performance (Fagerberg
et al., 2008), the innovation success being conditioned by the openness of the country in the entire
process, from the research and development activity to the transfer of the innovation results to the
market (Gurbiel. f.d.). All the measures that can be taken in a country based on the image offered by
this analysis differs from country to country depending on the current situation in the analyzed field
and the long-term strategy assumed at the country level.
References
- Bilbao-Osorio, B. & Rodríguez-Pose, A. (2004). From R&D to Innovation and Economic Growth in the EU. Growth and Change, 35, 434–455.
- Cefis, E. & Ciccarelli, M. (2005). Profit differentials and innovation. Economics of Innovation and New Technology, 14, 43-61.
- Drucker, P. (2002). The Discipline of Innovation. Harvard Business Review, The innovative enterprise, 96-103, Available online: https://hbr.org/2002/08/the-discipline-of-innovation.
- European Commission. (2009-2015). European Innovation Scoreboard. Enterprise & Industry Magazine.
- Available online: http://ec.europa.eu/growth/industry/innovation/facts-figures/scoreboards/index_en.htm Fagerberg, J. & Srholec, M. (2008). National innovation systems, capabilities and economic development, Research Policy, 37, 1417-1435.
- Gu, W. & Tang, J. (2004). The link between innovation and productivity in Canadian manufacturing industries. Economics of Innovation and New Technology, 13, 671-686.
- Gurbiel, R. Impact of innovation and technology transfer on economic growth: the Central and Eastern Europe experience. Available online: http://www.gbcbiotech.com/transferencia-tecnologia/ assets/impact -ofinnovation-and-technology-transfer-on-economic-growth.pdf.
- Leiponen, A. (2000). Competencies, Innovation And Profitability Of Firms. Economics of Innovation and New Technology, 9, 1-24.
- Schumpeter, J.A. (1934). The theory of economic development: An inquiry into profits, capital, credit, interest, and the business cycle, Harvard University Press, United States of America Zalewski, R. & Skawinska, E. (2009). Impact of technological innovations on economic growth of nations. Systemics, cybernetics and informatic, 7, 35-40.
Copyright information

This work is licensed under a Creative Commons Attribution-NonCommercial-NoDerivatives 4.0 International License.
About this article
Publication Date
04 October 2016
Article Doi
eBook ISBN
978-1-80296-014-3
Publisher
Future Academy
Volume
15
Print ISBN (optional)
-
Edition Number
1st Edition
Pages
1-1115
Subjects
Communication, communication studies, social interaction, moral purpose of education, social purpose of education
Cite this article as:
Stoian, M., & Nica, A. (2016). Innovation Progress at International Level. In A. Sandu, T. Ciulei, & A. Frunza (Eds.), Logos Universality Mentality Education Novelty, vol 15. European Proceedings of Social and Behavioural Sciences (pp. 957-964). Future Academy. https://doi.org/10.15405/epsbs.2016.09.119