
Perception of the Rural and Urban Population about Healthcare in Romania during 1990-2010


Abstract
The aim of the present paper is to analyse the opinions of Romanians regarding the quality of the healthcare. This study used self-assessed health (SAH ) data obtained from 13 representative samples during the period 1990-2010. We measured comparatively the intensity of the polarization and inequality healthcare aspects in rural and urban areas too. The indicators which were selected are specific for ordinal variables. Concerning the healthcare in Romania, the polarization phenomenon is usually greater in the villages. Contrary, the inequality between the perception of the individuals is in general more accentuated in the cities.
Keywords: Healthcareself-assessed datapolarizationinequalityrural-urbanordinal variable
Introduction
It is very difficult to evaluate the future evolution of the healthcare in Romania. The progress in time
of the healthcare domain is closely related with the solving of many specific problems. We enumerate
some of the main factors, whose importance should be estimated more precisely for healthcare: the
professional competence of the medical staff, the population’s medical education, the public policies
for the prevention of different diseases and lastly the way the system is organized and financed (see, for
example, the OECD indicators, 2009).
In literature, there are a lot of indicators referring to the characterization of the evolution of the
public healthcare system. For instance, there are coefficients proposed by OECD, indexes that are
classified using multiple criteria such as: health status, health workforce, health care activities, quality
of health, access to care, health expenditure and financing (the OECD report 2009).
Nevertheless the population’s opinion regarding healthcare has a major importance in order to
correct nowadays problems from the healthcare system. Following this idea, for the current
presentation we will limit ourselves to a statistical analysis of the perception of the population in urban
and rural areas regarding Romanian healthcare from 1990 to 2010.
More concretely, we will analyse comparatively the population’s answers from rural and urban areas
regarding question
have to choose between 5 possible answers: very bad (code 1), bad (code 2), so and so (code 3), good
(code 4), very good (code 5).
Methodology
Our statistical study was based on 13 nationally representative samples obtained from the Research
Institute for Quality of Life – Romanian Academy (RIQL) during 1990-2010 (the RIQL data bases).
In fact, the variable Q1, which characterizes the perception of the population regarding healthcare, is
an ordinal one. The five ordinal classes are defined as the answering codes 1-5 (from very bad to very
good ). Practically, we will study the evolution of the ordinal variables Q1y, z , where the indexes y , zrepresent the year, and the respondent’s residential area respectively. More precisely, y∈ { 1990, 1991,
… , 2010 } , z∈ { rural, urban }.
An ordinal variable Q1y, z is defined by the distribution py,z = ( py,z,1 , py,z,2 , py,z,3 , py,z,4 , py,z,5 ) ,where py,z,k represents the probability that the persons interviewed in the year y and who live in zone zwill give the answer k to the question Q1, 1 ≤k≤ 5.
The statistical model for the analysis of the system’s { Q1y, z }y, z will be based on the evaluation of similarities / dissimilarities between the system’s components.
Most of the time, working directly with the distributions of the ordinal variables Q1y, z is difficult. That is why we prefer to use the values of indicators applied to these variables. Concretely, we have chosen to monitor the polarization and inequality phenomena defined by the distributions of the variables Q1y, z . In this way, we will use the indicators POA(Q1y, z) and IGO(Q1y, z) respectively.
So, Atkinson proposed in (Atkinson, 1970) a class of inequality measures which are applicable to cardinal variables. But the variables Q1y, z used in our research have an ordinal type. For this reason we
cannot apply the Atkinson inequality measures defined in [5]. Agresti developed in his books from
2002 and 2007 (Agresti, 2002; 2007) an unitary methodology for modeling categorical data, that are
systems with nominal and ordinal variables. Allison and Foster suggested in 2004 (Allison & Foster,
2004) how to measure the inequality in health when the data are qualitative. In the last years, Giudici
and Raffinetti (1996) adapted in the case of ordinal data the classic Gini coefficient which is a very
used inequality measure for cardinal random variables. In the subsequent we will denote by IGO(p) the
Giudici-Raffinetti inequality index (Giudici & Raffinetti, 1996) applied to an ordinal variable X which
has the distribution p.
The standard mean indicator Mean(X) has not always a right interpretation when the the variable X
is an ordinal one. The same discussion can be made for the variance coefficient Var(X) of X . In 1992
Berry and Mielke proposed more indices for ordinal variation (Berry & Mielke, 1992). These ideas
were developed by Blair and Lacy (Blair & Lacy, 1996). Later, Apouey (2007) takes one of Blair-Lacy
variation index and proved that this coefficient accomplishes some axioms which are specific to a
polarization phenomenon. In the following we will designate by POA(p) the polarization indicator used
by Apouey in 2007 to measure the polarization for self-assessed health (SAH) data having distribution
p . More details about the concrete definitions of the indicators POA(p) and IGO(p) could be found in
Apouey (2007), Giudici & Raffinetti (2011) and Ştefănescu (2015).
Both coefficients POA(p) and IGO(p) vary in the interval [0 , 1] and they measure the polarization,
respectively the inequality level from the distribution p. The two indicators are “independent” (see
Ştefănescu, 2015). So a high value of one of the indexes does not necessarily determine a high value in
the other index. In fact between the inequality and the polarization processes there is not a dependence
relation all the time (see Table 4.1 and Graphic 4.2 from Ştefănescu, 2015).
Data presentation
Our study is based on 13 nationally representative samples, which were designed at the Research
Institute for Quality of Life (RIQL) – Romanian Academy during 1990-2010. The
the size of the samples, neglecting the non-response cases.
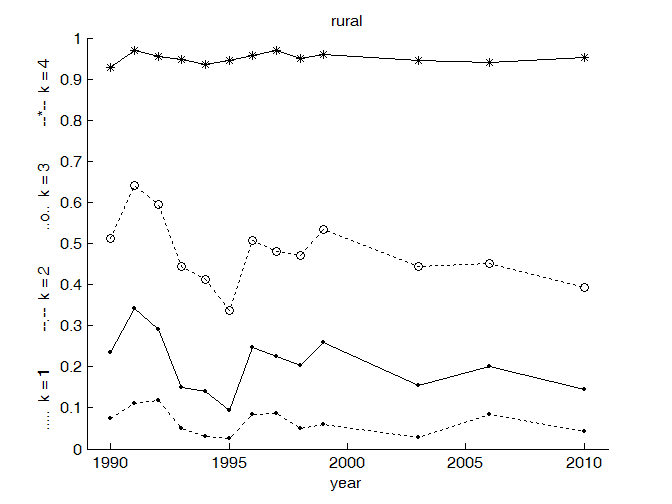
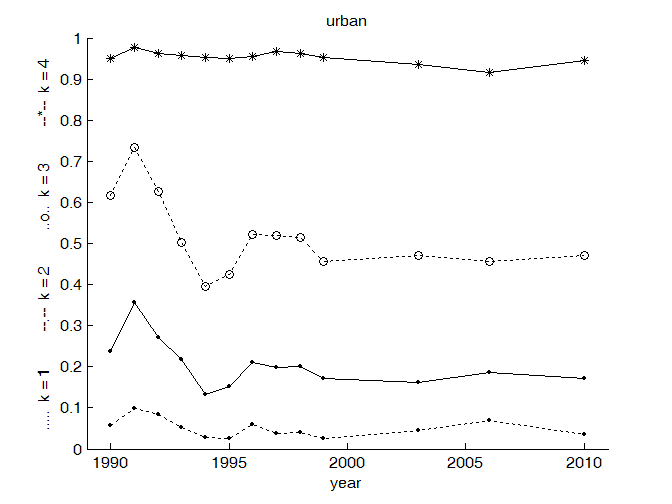
The distribution functions of the ordinal variables Q1y,z represent the cumulative probabilities of the population’s answers in year y, who have residence in zone z.
The probabilities Pr(Q1y,z≤ k ) , y∈ { 1990, 1991, … , 2010 } , z∈ { rural, urban } , k∈ {1 , 2 , 3 , 4 , 5}, of the ordinal variables Q1y,z are represented synthetically in Fig.
Healthcare is considered “more positive” in 1995 for the rural area ( Fig.
urban residents ( Fig.
Polarization aspects
In Fig.
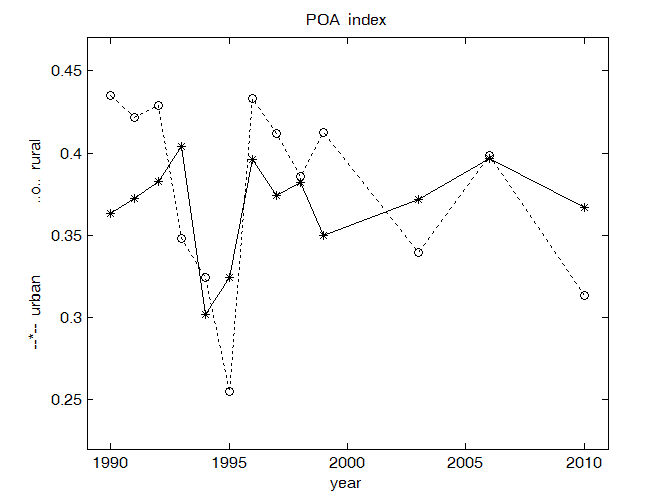
Taking into consideration the values POA of the polarization phenomenon, from Fig.
conclude :
- In the rural areas, the polarization is more intense than in the urban areas.
- The smallest value for the polarization is in the year 1995 for the rural areas.
- But the smallest value for the polarization in the urban areas is in the year 1994.
- In the analysis of public health, the rural is “inferior” to the urban.
- The greater polarization in the rural area is present in 1990-1993 and in the year 1996.
- For the urban zone the situation is a little different, that is in the years 1990-1994, 1996 and also in
2006 we have a maximum of the polarization indicator POA. Almost always, in the urban districts,
comparing with the rural communities, we have less fluctuations of POA coefficient.
- The variations of POA index in time are very similar in rural and urban districts. So we have the
same trend for the entire population.
Measuring the inequalities
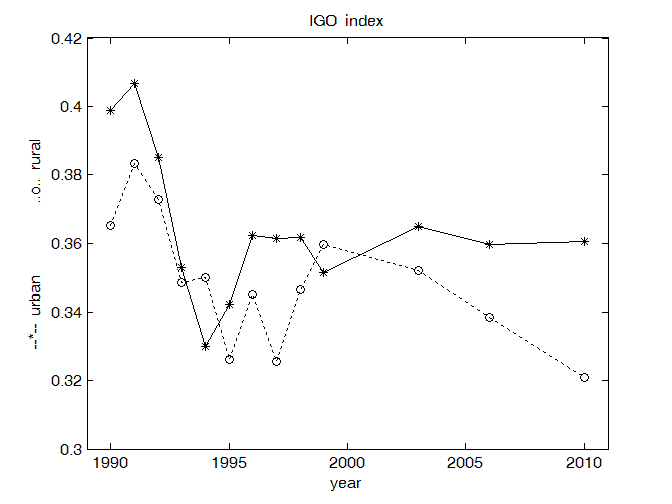
In Fig. 5.1 we summarize the variations in time of the inequality index IGO, for rural and also for
urban communities.
Concluding the behaviour of the inequality index IGO in Fig. 5.1 we mention the following aspects:
- In the urban areas , the inequality is more intense than in the rural areas.
- The smallest value for inequality is in 1994 year for the urban zone.
- The smallest value for inequality in the rural areas is in the year 1995.
- Taking into consideration the inequality phenomenon in the analysis of public health, the rural is
“superior” to the urban.
- We notice a decrease of inequality in urban areas and at last a relative stability after the year 1995.
- After 1999, in the rural areas there is a continuous decrease of Gini type inequality, arriving in 2010
to its smallest value for the entire period 1990-2010. The smallest perceived value for healthcare for
Gini inequality is approximately 0.32, value that results also at national level for incomes.
- We observe “turbulences” during entire period 1991-1996.
- With some exceptions (for years 1994, 1999), usually Gini inequality for healthcare has greater
values in the urban areas. But this aspect is not always true if we consider other variables as, for
example “the perceived health state” (an unpublished research).
Final conclusions
-The main aim of this paper is to analyse the perception of the rural and urban people regarding the
healthcare in Romania. The study is based on 13 nationally representative samples designated
during 1990-2010 years (RIQL, 1990-2010).
-In the literature are used frequently the mean, variance or the classical Gini coefficient as indices for
measuring the evolution, polarization, respectively for the inequalities between different cardinal
variables (see Atkinson, 1970). But these indicators are not suitable for SAH data which are often
interpreted as categorical variables (Agresti, 2002; 2007).
-For the statistical analysis of the polarization and inequality phenomena in healthcare were chosen
two recent indicators (Apouey, 2007; Giudici & Raffinetti, 2011). The numerical calculus and also
the graphs were programmed in Matlab language.
-We do not notice a relatively rapid improvement of the situation regarding the positive evaluation of
the healthcare system by the Romanian population (Fig. 4.1, 5.1).
-The polarization and inequality phenomena do not overlap (Fig. 4.1, 5.1).
-The polarization of the population’s answers is higher in the rural area (Fig. 4.1). But Gini’s
inequality index associated to the population’s perception is more intense in the urban area (Fig.
5.1). For the last period 1999-2010 we notice stationarity in the urban zone with relatively high
values of the inequality phenomenon. This phenomenon decreases in the rural area in the second
period 1999-2010 (Fig. 5.1).
-We could divide the period 1990-2010 in two great periods 1990-1998 (period 1), respectively
1999-2010 (period 2). In the first stage, we have “turbulences”, while in the second phase we have a
relative stability with a decreasing tendency for inequality in the rural areas and a stability of
inequality in the urban area (Fig.5.1), with similar tendencies for the urban areas for polarization
(Fig. 4.1).
-In fact we have overlapped two different phenomena, sometimes complementary, with similar
dynamic tendencies for the evaluation of the evolution of the rural and urban areas. We speak about
the polarization and on the inequality aspects. Summarizing, from the healthcare point of view the
polarization phenomenon is usually greater in the villages, while the inequality aspect is in general
more accentuated in the cities.
-For the future we intend to take into consideration new processes as the diversity, the progress or to
establish an evolution trend. We have in mind to correlate the healthcare with other variables as the
satisfaction with the life, the age of the individuals, the income of the persons and also with different
vulnerable categories from the population.
References
- Agresti, A. (2002). Categorical Data Analysis. New Jersey: Wiley Interscience.
- Agresti, A. (2007). An Introduction to Categorical Data Analysis. New Jersey: Wiley Interscience.
- Allison, R.A., Foster, J.E. (2004). Measuring Health Inequality Using Qualitative Data. Journal of Health Economics, 23, 505-524.
- Apouey, B. (2007). Measuring Health Polarization with Self-Assessed Health Data. Health Economics, 16(5), 875–894.
- Atkinson, A. B. (1970). On the Measurement of Inequality. Journal of Economic Theory 2, 244-263.
- Berry, K.J., Mielke, P.W. (1992). Indices of Ordinal Variation. Perceptual and Motor Skills, 74, 576-578. Blair, J., Lacy, M.G. (1996). Measures of Variation for Ordinal Data as Functions of the Cumulative Distribution. Perceptual & Motor Skills, 82(2), 411-418.
- Giudici, P., Raffinetti, E. (2011). A Gini Concentration Quality Measure for Ordinal Variables. Quaderni del Dipartimento di Economia, Statistica e Diritto, Università di Pavia, Serie Statistica, no. 1/2011 (April 7, 2011), 18 pag.
- Ştefănescu, M.L. (2015). Analyzing the Health Status of the Population Using Ordinal Data. Computational Methods in Social Sciences, 3(1), 9 pages.
- *** Health at a Glance 2009 - OECD Indicators, Report of the Organisation for Economic Co-operation and Development, OECD, 2009, 204 pages, www.oecd.org/health .
- *** Data bases “Diagnosis for Quality of Life in Romania”, Research Institute for Quality of Life, Romanian Academy, (the period 1990-2010 ).
Copyright information

This work is licensed under a Creative Commons Attribution-NonCommercial-NoDerivatives 4.0 International License.
About this article
Publication Date
04 October 2016
Article Doi
eBook ISBN
978-1-80296-014-3
Publisher
Future Academy
Volume
15
Print ISBN (optional)
-
Edition Number
1st Edition
Pages
1-1115
Subjects
Communication, communication studies, social interaction, moral purpose of education, social purpose of education
Cite this article as:
Ştefănescu, M. L. (2016). Perception of the Rural and Urban Population about Healthcare in Romania during 1990-2010. In A. Sandu, T. Ciulei, & A. Frunza (Eds.), Logos Universality Mentality Education Novelty, vol 15. European Proceedings of Social and Behavioural Sciences (pp. 943-950). Future Academy. https://doi.org/10.15405/epsbs.2016.09.117