
Comparative Analysis of the Biological and Motor Potential of School Population from Romania (Urban and Rural Areas)


Abstract
The population health state is conditioned by the biological and motor potential of the individuals. It is one of reason for what we indentified a permanent interest on the assessment of somatic, functional and motor human potential. The relation between the individual development and the environment influence, represents an important topic for many studies, among these the analysis on life environment influence it was noted. The accepted opinion is that children development is influenced by many internal and external factors, biological and social, and the specialty literature emphasize a tendency of decrease of children motor capacity in the same time with the overweight tendency. All these aspects have major social and economical implications at national level. This paper presents the results obtained under the national project
Keywords: Biological developmentmotor developmentenvironmentphysical educationhealthchildren
Introduction
As a component of the life quality, the population health state is conditioned by the biological and
motor resources of the individuals. This aspect determined a permanent interest on the somatic,
functional and motor assessment of human potential. The relation between individual development and
the influence of the environment is an important topic for many studies, and in particular for the
analysis on living environment influence.
Over time more study directions linked with our reseach were identified. One of them concerns the
influence of the environment or of the living conditions on individual development. (Wolanski, 1981;
Farmosi et. al., 1986; Szabo et. al., 2013)
Constant interest was shown for the study of the influence of different biological and social factors
on children development (Wolanski, 1981; Farmosi et. al., 1986), and a decreasing trend in the motor
capacity of children (Mei et. al., 2002). The child and adolescent obesity represents another important
topic (Must & Strauss, 1999; Deckelbaum & Williams, 2001; Flodmark et. al., 2004). Changes in body
weight is actually another important indicator of health status, and there is a higher risk of a child
becoming obese in adulthood if the parents are suffering from the same condition. The literature shows
the link between downward trend in the motor capacity of students coupled with a tendency to become
overweight, both trends having major social and economic implications for a nation.
There is also an increasing incidence of obesity found in children and adolescents in Europe
(Flodmark et. al., 2004), in the USA (Ogden et. al., 2002) and in less developed countries (Ebbeling et.
al., 2002). In this context, body mass index is an effective tool in identifying children at risk of obesity
with age (Guo et. al., 1994; Mei et. al., 2002; Kuczmarski et. al., 2002).
These research directions were accompanied by those regarding the population evolution (Jørgensen
et. al., Cazorla, 1989; Soppelsa & Albaret, 2005) (from anthropometric, functional or motor capacity
perspectives), assessed with different instruments (as Eurofit, 1983, for motor capacity).
1.1.Biomotor potential of Romanian school population
In Romania there has been a constant interest concerning the evaluation of the biomotor potential of
the school population. Identifying the level of the biomotor potential of the school population in
Romania appeared at the initiative of a team led by professors Alexe N. and V. Mazilu and having as
effect the modification and updating of the school curricula, designing attitudes and practices
concerning the evaluation or outlining some views on education sports activities.
Investigations have been conducted since the 70s, then 80s and 90s. (Mazilu et. al., 1972; Nicu et.
al., 1994; Nicu, 1982-1983) In this sense were applied batteries of tests, the content of which was
thoroughly considered in time by evaluation systems: the Unique System of Verification and
Assessment of the level of fitness and sport training of students (1970), the Unique System of
Verification and Assessment of the level of fitness of students and detection of talent for sport
performance (1986), the National School System of Assessment at Physical Education and Sport
(SNSE, 1999).
We have seen that Romanian specialists have shown a constant interest for the assessment of the
biomotor potential, underlined by their concern of identifying the most appropriate instruments, and by
periodic assessments aimed at capturing the evolution in time of this potential of the Romanian
population. The first edition took place between 1969 - 1972, the second between 1981 - 1984, and the
third between 1989 - 1994.
One of the defining particularities of the three evaluations regards the way in which parameters are
recorded, by gathering information at relatively equal periods of time and from the same geographical
areas. A battery of tests was used to assess the potential; it included 10 motor tests (jump vertically
without countermovement, throwing the oina ball, speed, overall skills, frontal plane mobility, trunk lift
lying back, face down trunk extension, tractions, pushups and running duration) and 5 anthropometric
measurements (size, weight, bust, chest perimeter in inspiration and expiration).
From the above mentioned tests used in the three previous editions, six are found in the 2012
evaluation developed within project The evaluation of somatic, functional and motor potential of
University of Physical Education and Sports - UNEFS, 2012). During the time we presented a series of
partial results of this project. (Stănescu et. al., 2015; Cojocaru et. al., 2015; Cojocaru et. al., 2015;
Stănescu et. al., 2015)
The results obtained in our research were linked to the six measurements whose averages and
differences significance (at p=0,05) are given below. The paper presents the analysis of data obtained
by 3865 physical education teachers, from 31 counties (from all over the country) who applied the
assessment tests.
Research Methodology
2.1. Hypothesis
The results of the biomotor measurements might highlight the significant differences between
students in urban and in rural areas, due to the specifice living conditions from these environments.
2.2 Objectives
The specific aims of our research were the following: presenting a clear picture of the relationship between the parameters evaluated in urban areaswith those in rural areas;identifying the evolution of the somatic, functional and motor potential of students levels basedon assessments made in previous years.
2.3 Methods
The assessment period was the school year 2011 – 2012. Transmission of the data to the coordinator
(UNEFS) was realised during the school year 2012 – 2013. To assess the biomotor potential we used a
battery of tests that included anthropometric measurement (height, weight), a functional one (Ruffier
test) and 5 motor tests (shuttle race, pushups, throwing the oina ball, trunk lift lying back, face down
trunk extension).Data were organized, centralized and processed using statistical functions of
Microsoft Office Excel (version 2013) (average, variability, differences significance – T-test). Graphs
were made with the same tool.
The information was analyzed by reporting the results from urban to rural areas, to the average
values obtained in previous national studies and to the actual National System of Evaluation for
Physical Education and Sport (SNSE). The comparative analysis with results from previous editions of
national assessments was performed only for similar tests.
2.4 Research group
As it can be seen in table
from rural areas, 50224 girls (F) from urban areas and 21969 girls (F) from rural areas participated in
this research. Most of the students comes from urban regions. The study involved only students in
grades I, V, IX and XII.
Results and Interpretation
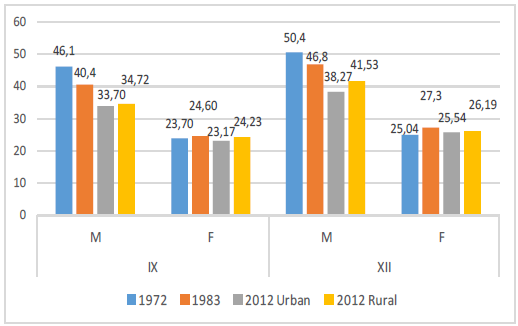
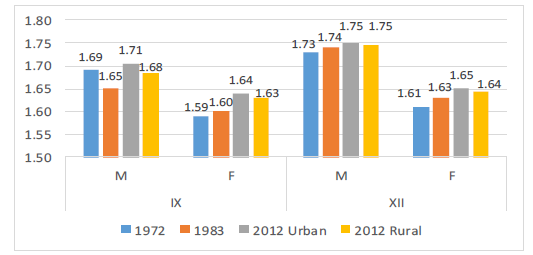
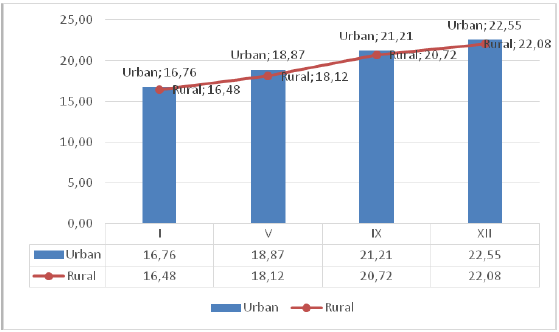
Data analysis was performed on three components: somatic, functional and motor. In terms of
the students, it is noteworthy that in all classes evaluated, students from the city are taller than those from
rural areas. (graphs
higher than those from previous years by 1 to 2 cm, which shows an increase in height of the Romanian
population over the 4 decades and a half that have passed since the first edition of the evaluation.
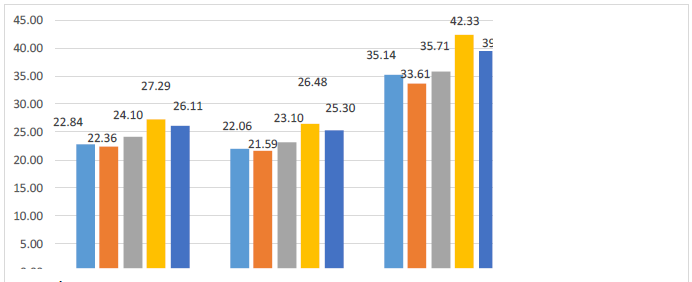
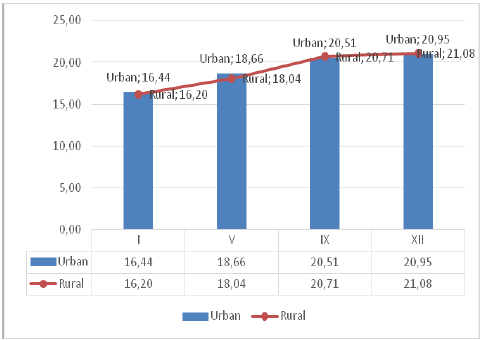
Mean values of te students’
are heavier than those from rural areas. (graphs
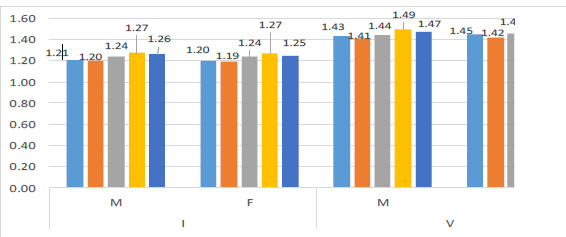
Analyzing the
Regarding girls in the high school grades analyzed, the body mass index in rural areas
insignificantly exceeds the one registered in urban school girls. (graph
noted that in all classes analyzed, the BMI values remain normal, with values <25 (threshold indicating
the state of overweight).
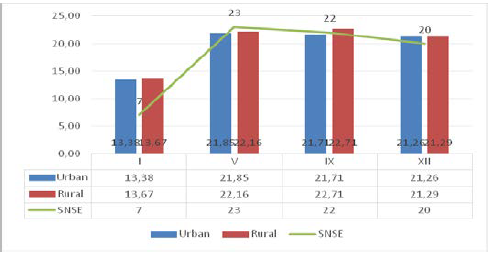
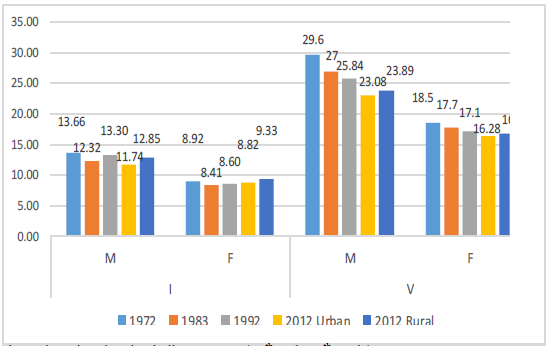
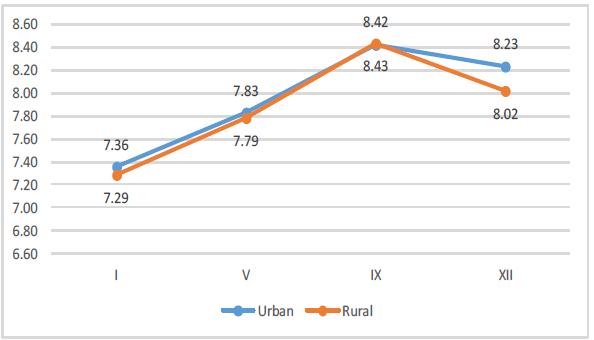
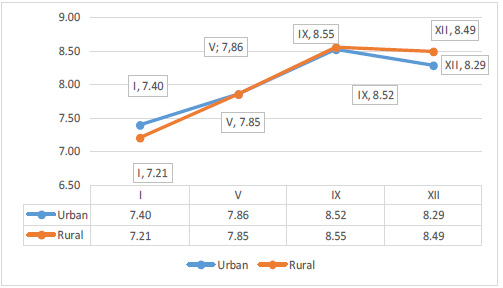
Regarding the assessment of the
As a general trend, results in rural areas have lower values than those in urban areas, which indicates a better exercise capacity. For girls in the XIIth grade, the values resulting from the application of the Ruffier test shows slightly higher values than those in urban areas.
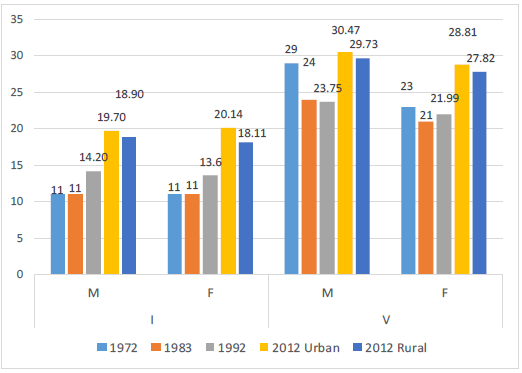
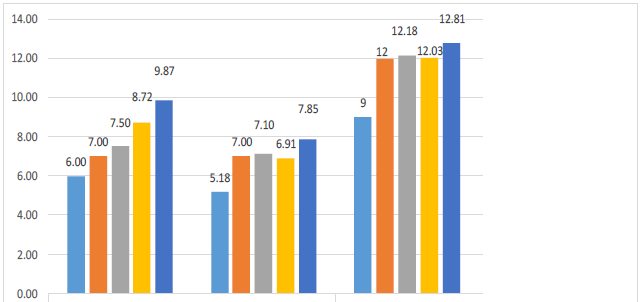
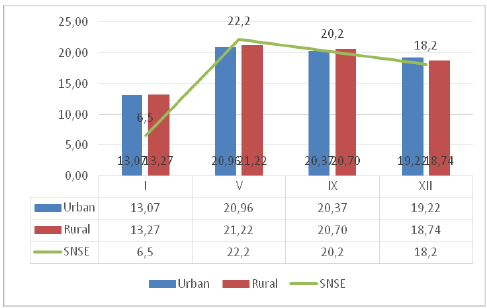
Regarding the samples for
values are higher in rural areas compared to urban areas. (graph
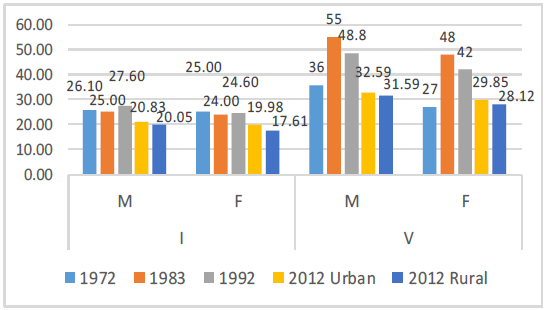
The biggest differences are registered relative to the provisions of the SNSE, in Ist grade. For this
grade, we believe that it is necessary to review the scale for that grade.
Regarding
for the 31 counties, indicate higher values in rural areas, both in girls and boys. In the Vth grade only,
girls from urban areas had better results than those from rural areas, all other keeping the previous
values. Also, we noted higher values than those in 1972 and 1992 and lower than in 1983, only in the Vth grade, for girls and boys alike (graph no. 11)
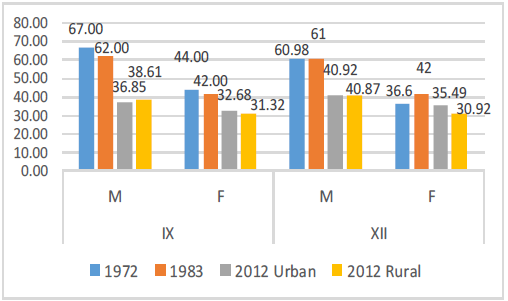
Arm muscle strength in high school students from cities is higher than the strength of those in rural
areas, for both genders. It can be seen that the values arehigh
e
r tha
n
those recorded in previous
assessments (graph
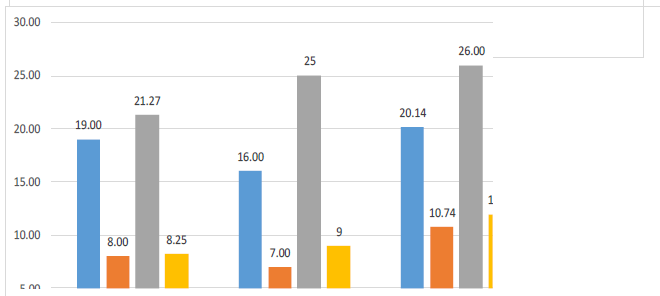
For the arms explosive strength, the rural environment shows superior values for both girls and
boys, in all 4 grades recorded, at throwing the oina b all (with a significant differences of 3.26 m for the XIIth grade, boys) (graph
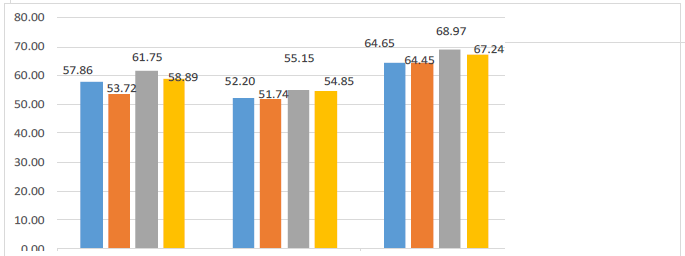
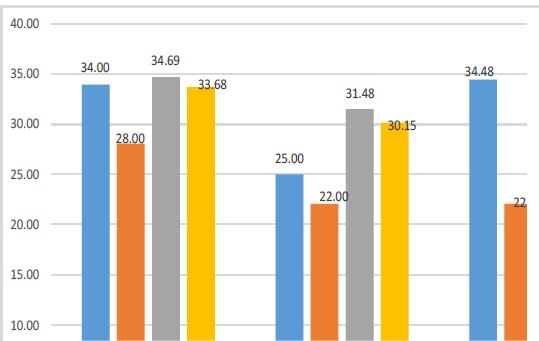
At the test relating to the face down trunk extension, we noticed that in urban areas were recorded higher values in all grades (graph
At high school, we identified the same trend as for the Ist and Vth grade, with differences of 4.08 repetitions in the XIIth grade, girls and 2.26 for boys. In IXth grade the differences are not significant (1.01 repetitions for boys and 1.33 repetitions for girls). (graph
On the motor tests it was noted that there is a high degree of variability in the results, allowing us to highlight that within each age group homogeneity is low.
Conclusions
From the point of view of students’ height, synthetic means linked to the previous assessments
indicate the trend of population growth in height. Students from the city are taller than those in rural
areas. Meanwhile, the mean values of the weight highlight the fact that students from the city are
heavier than those from rural areas. If the previous parameter is an indicator without a degree of
concern, one with prospects for practice of sports performance, weight keeps the same rising trend,
which requires special attention in order to maintain health.
The body mass index calculated still puts us in a position of normality in terms of values identified
by reference to benchmarks. Urban boys show higher values than those from rural areas, and there is a
continuous increase in this parameter from one educational cycle to another. Girls kept this trend only
in grades I and V.
Regarding the Ruffier test, there is an increase in the recorded values from one grade to another up to the IXth grade including, something that highlights a decrease in the exercise capacity of students from one grade to another. The results from rural areas indicates a better exercise capacity for students in these areas.
After calculating the average speed test and reporting them to the evaluation system in place it was found that the values are better than those provided in the system, which requires adjustments on these rates. Comparative analysis of urban and rural areas, in the speed tests, show that the average values in both boys and girls are better in rural areas compared to urban areas, the ratio reversing only to XIIthgrade for boys.
On the tests of force, contrary to the assumption that the motor values of children in rural areas are higher than in urban areas, the results refute that hypothesis. Analyzing the results from the rural and urban areas, we can say that the biomotor potential of the school population in Romania is influenced by the living conditions and social environment of students.
Of the evaluation tests analyzed, the only test that recorded values considerably higher than assessments from previous years is the one targeting the back muscles, namely, extensions of the trunk lying face down. On the other tests there was a decrease in the average values. Therefore, the results
indicate a decrease in the motor performance of students nationwide, in connection with records of
previous studies and the evaluation system in place.
Given the above, we propose a number of amendments to the National System of School
Assessment in Physical Education and Sport, considering the evolution of the motor capabilities of the
students. These changes can lead to encouraging students to spend more time performing motor
activities.
Designing assessment tools in line with the biomotor development aims to draw attention to the fact
that physical education is an important determinant of health, and the lack of physical activity coupled
with a sedentary lifestyle can damage the quality of life.
References
- Cazorla, G. (1989). L’evaluation des capacites motrice. De l’itineraire d’un concept a l’elaboration d’un outil. Revue Francaise de Pedagogie, 89, 15-22.
- Cojocaru, V., Stănescu, M., Tudor, V., Ciolcă, C., Stoicescu, M., Mujea, A.M. (2015). Comparative Study about the Particularities of Motricity in Children from the Development Regions of Romania. Proceedings Volume of the 4th edition of the International Congress of Physical Education, Sport and Kinetotherapy, Medimond Publishing Company, 579- 586.
- Cojocaru, V., Stoicescu, M., Mujea, A.M. (2015). Study on the relationship between somatic and motor development in Romanian 11 - 12 years old. Discobolul - Physical Education, Sport and Kinetotherapy Journal, XI, 2(40), 33-38.
- Council of Europe (1983). Testing Physical Fitness Eurofit – Experimental Battery. (Retrived from http://www.bitworksengineering.co.uk/linked/eurofit%20provisional%20handbook%20leger%20beep%20test %201983.pdf, 20 Aprilie 2016) Deckelbaum, R.L., Williams, C.L. (2001). Childhood obesity: the health issue. Obesity Rescue, 9(Suppl. 4), 239S–43S.
- Ebbeling, C.B., Pawlak, D.B., Ludwig, D.S. (2002). Childhood obesity: public health crisis, common sense cure. Lancet; 360, 473–482.
- Farmosi, I., Nádori, L., Bakonyi, F. (1986). The somatic development and motoral performance of 12-year-old children considering factors of socio-cultural condition (order of birth, the number of family and the extent settlement). International Journal of Physical Education, 23(3), 15-19.
- Flodmark, C.E., Lissau, I., Moreno, L.A., Pietrobelli, A., Widhalm, K. (2004). New insights into the field of children and adolescents’obesity: the European perspective. International Journal of Obesity, 28, 1189–1196. Guo, S.S., Roche, A.F., Chumlea, W.C., Gardner, J.D., Siervogel, R.M. (1994). The predictive value of childhood body mass index values for overweight at age 35 years. American Journal of Clinical Nutrition, 59(4), 810-819.
- Jørgensen, T., Andersen, L.B., Froberg, K., Maeder, U., von Huth, S., Mette, L., Aadahl, Mette, A. (2009).
- Position statement: Testing physical condition in a population - how good are the methods? European Journal of Sport Science, 9(5), 257 — 267.
- Kuczmarski, R.J., Ogden, C.L., Guo, SS, et al. (2002). 2000 CDC growth charts for the United States: Methods and development. National Center for Health Statistics. Vital Health Stat, 11, 246 Mazilu, V., Nicu, A., Focșăneanu, A. (1972). Potențialul biomotric al populației școlare din clasele I – IV ale învățământului de cultură generală din România. Bucureşti: CNEFS.
- Mei, Z., Grummer-Strawn, L.M., Pietrobelli, A., Goulding, A., Goran, M., Dietz, W. (2002). Validity of body mass index compared with other body-composition screening indexes for the assessment of body fatness in children and adolescents. American Journal of Clinical Nutrition, 75(6), 978-985.
- Mei, Z., Grummer-Strawn, L.M., Pietrobelli, A., Goulding, A., Goran, M., Dietz, W. (2002). Validity of body mass index compared with other body-composition screening indexes for the assessment of body fatness in children and adolescents. American Journal of Clinical Nutrition, 75(6), 978-985.
- Must, A., Strauss, R.S. (1999). Risks and consequences of childhood and adolescent obesity. International Journal of Obesity Related Metabolism Disorders, 23(Suppl 2), S2–11.
- Nicu, A. (coord.) (1982-1983). Potențialul biomotric al populației școlare din clasele IX – XII (studiu comparativ). Bucureşti: MEI, CNEFS.
- Nicu, A., Sintie, A.M., Miclescu, L., Popescu, M. (1994). Studiu comparativ al potențialului biomotric al elevilor din clasele V -VIII la a treia ediţie a evaluării. Bucureşti: MTS, MCT, MI.
- Ogden, C.L., Flegal, K.M., Carroll, M.D., Johnson, C.L. (2002). Prevalence and trends in overweight among US children and adolescents 1999– 2000. JAMA; 288: 1728–1732.
- Soppelsa, R., Albaret, J.M. (2005). La batterie d’évaluation du mouvement chez l’enfant (M-ABC): Etalonnage sur une population d’enfants de 4 à 12 ans. Psychomotricite, 195 – 200.
- Stănescu, M., Ciolcă, C., Păunescu, A., Tudor, V. (2015). Analysis of body mass index in Romania`s school population. Proceedings Volume of the 5th Edition of the International Congress of Physical Education, Sport and Kinetotherapy, București (CD).
- Stănescu, M., Ciolcă, C., Stoicescu, M. (2015). Study of the motor aptitudes of the children in North-Eastern Romania. Proceedings Volume of the LUMEN RSACV 2015 International Conference, Iași.
- Szabo, E., Keczeli, D., Farmosi, I., Gaál, S., Keresztesi, K. (2013). Somatic development and some motor performances of young girls based on age and birth season. Applied Studies in Agribusiness and Commerce, 1, 117-123.
- Wolanski, N. (1981). Biologische und soziale Komponenten der Motorishen Entwicklung. In Willimzick, K- Grosser, M. (Hrsg.): Die motorische Entwicklung in Kindes- und Jugendalter. Hofmann K.Verlag.
- Schorndorf. 324-341
Copyright information

This work is licensed under a Creative Commons Attribution-NonCommercial-NoDerivatives 4.0 International License.
About this article
Publication Date
04 October 2016
Article Doi
eBook ISBN
978-1-80296-014-3
Publisher
Future Academy
Volume
15
Print ISBN (optional)
-
Edition Number
1st Edition
Pages
1-1115
Subjects
Communication, communication studies, social interaction, moral purpose of education, social purpose of education
Cite this article as:
Stănescu, M., Ciolcă, C., & Stoicescu, M. (2016). Comparative Analysis of the Biological and Motor Potential of School Population from Romania (Urban and Rural Areas). In A. Sandu, T. Ciulei, & A. Frunza (Eds.), Logos Universality Mentality Education Novelty, vol 15. European Proceedings of Social and Behavioural Sciences (pp. 922-934). Future Academy. https://doi.org/10.15405/epsbs.2016.09.115