
Assessment of Anthropometric Indicators among Rural Students in the West of Moldavia Marketing


Abstract
This paper aims to identify the anthropometric characteristics of students from rural areas in two counties of Moldavia, 0-200m altitude floor. The study was conducted on a sample of 329 children in the 5th grade, from counties near Iasi (175 students) and Vrancea (154 students). The measurements included height and weight assessment and comparison of the values obtained with the national reference standards for a certain age, gender and family of origin (rural). Values are presented by comparing the two counties studied. Statistical processing of the results is performed using Pearson’s test. Results show that the dominant values of height are average (48.02%), the differences being statistically insignificant calculated by counties (p> 0.05, Gl = 3, χ² = 0.851). It draws attention the 2.12% young people with pathological values for height (above the average +3 sigma). Body weight has average values in 56.83% of the cases presented for both counties, and the calculated differences are statistically insignificant (p> 0.05, Gl = 3, χ² = 5.757). The incidence of pathological situations reaches 8.2%, which is a problem. Diagnosis of physical development allows emphasizing only 59.57% children with harmonious development, which is very little. The differences between the two counties are statistically insignificant (p> 0.05, Gl = 3, χ² = 2.957). In conclusion, results are similar for the two counties, so it is necessary to use other selection criterion for young people, which will be prepared for different sports. The criterion of geographical conditions offers few advantages in terms of anthropological indicators.
Keywords: Height, weight, teenager, countryside, Moldavia
1. Introduction
The growth and development of children and teenagers are two processes influenced by the action
of internal (genetic) and external (environmental) factors. Most of the somatic and some of the mental
characteristics are genetically determined. There are genetic differences concerning the height of
populations. Asian children are less tall compared to European or American children. African
Americans have longer upper and lower limbs compared to the European population. African
population has stronger muscles, denser bones and less body fat compared to the European population
(Eveleth & Tanner, 1990: 215). The body composition differences between populations also explain
the differences in sports performances. African athletes often obtain exceptional results, partially
explicable by their genetic particularities.
The category of environmental factors includes geo-climatic conditions, family background,
socioeconomic conditions, diet, dwelling, family, motor activity, health status and pollution.
Geo-climatic conditions influence growth mostly indirectly, by altering the flora and fauna of the
region in question. People who live at higher altitudes are less tall compared to people who live at sea
level. The difference is due to the distinct diet and to the partial decrease in oxygen, which favours
hypoxia (World Health Organisation,1999).
A series of modifications in the body appearance are recorded in certain climatic areas, some of
which are useful in certain sports branches. People who live in a warm climate have longer extremities,
while those who live in cold climates have better developed torsos. Such alterations allow the body to
adjust to living conditions: losing heat in the warm microclimate and reducing heat loss in the cold one.
Another factor that influences growth and development and that should be taken into account when
attracting young people toward sports is family background. In the entire world (except for the US and
Australia), urban children are better developed compared to rural children (Sonenstein, 2014; Eveleth
& Tanner, 1990: 203). The differences are considerable, reason for which one should use different
baselines depending on family background. When advising a student to choose a certain sports activity,
it is important to let them know all of these aspects.
2. Materials and methods
The study was conducted on a sample of 329 students from two counties in the West of Moldavia (a
notion used by Muntele, 1998): Iaşi (175 students) and Vrancea (135 students). The gender distribution
is not equal: 88 girls are from Iaşi County, while 66 from Vrancea. As for boys, 87 are from Iaşi and 90
from Vrancea.
According to Erdeli and Dumitrache (2001, adapted after Stasezewski, 1957), in terms of altitude,
most of the European population (92.3%) lives between 0 and 800 m. Iordache (2009) states that “over
56% of the Romanian inhabitants live in plain and low hill areas, up to 200 m altitude”;
In both counties, we chose to examine people from the altitude interval 0-200 m. We chose the same
altitude interval to assess the differences (or lack of them) in the physical development of students who
live in different areas, but in similar climatic conditions. We assessed the anthropometric indicators
(height and weight) of rural students aged between 10 and 12 (fifth graders) (World Health
Organisation, 2007). We interpreted the results by using national standard baselines for the rural
environment. These baselines indicate average development (average +/- sigma interval), high
development (average + sigma and average + 2 sigma) or very high development of children (average
+ 2 sigma and average + 3 sigma) (Bardov, 2009: 384). To the other extreme, there are the low values
(average – sigma and average – 2 sigma) or very low values (average – 2 sigma and average – 3 sigma)
(Gavăt, Albu, & Petrariu, 2006: 157). To avoid a too high dispersion of the results, the low and very
low values or the high and very high values will be discussed together. Values lower than average – 3
sigma and higher than average +3 sigma are pathological. We will make a separate interpretation for
the entire sample and then by gender. We will also conduct a comparative analysis of the results.
We have also determined the physical development diagnostic that allows us to assess the
correlation between height and weight. If height and weight are in the same sigma interval, the
development is well balanced. If the two indicators are in two different sigma intervals, the
development is not balanced (underweight or overweight issues). The results were processed using
Pearson’s test.
3. Results
We studied the anthropometric indicators of height and weight. The correlation between them
allowed us to determine the physical development diagnostic (Albu & Rada, 2014).
The height of students within our study is generally average (48.02%). This is an expected result for
students aged 10-12, who have not yet begun puberty, except for few of them (Misaki, 2013). It is
worth underscoring 2.12% of the children with pathological values for height, which are higher than
average + 3 sigma. They should be monitored carefully, in order to interpret their situation correctly
(pathological or normal growth leap) (Fig. 1).
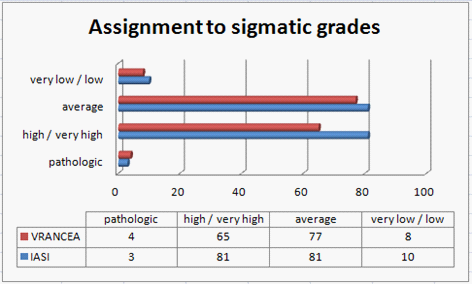
The distribution of the results by county indicated statistically insignificant differences (p> 0.05, Gl
= 3, χ² = 0.851).
It is important to continue the study with the analysis of results by gender, because it is known that
their growth process is distinct. For males, average values (46.4%) and high/very high (44.2%) values
of height are dominant, while the differences found were statistically insignificant (p> 0.05, Gl = 3, χ²
= 2.957) (Table 1).
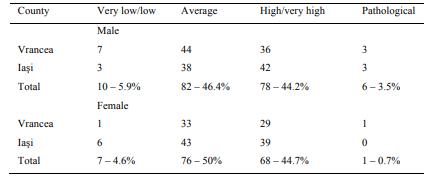
Among females, average (50%) and high/very high values are dominant (44.7%), while the
differences found were statistically insignificant (p> 0.05, Gl = 3, χ² = 3.664). The comparison by
gender also revealed statistically insignificant differences (p> 0.05, Gl = 3, χ² = 3.373), though some of
the girls had already shown the first signs of puberty (Ştirbu, Miu, & Simalcsik,2003).
We found the weight of students within our sample to be average (56.83%) in most cases, which
contradicts the opinions of certain specialists who warn about the alarming number of obese children
(Fig. 2).
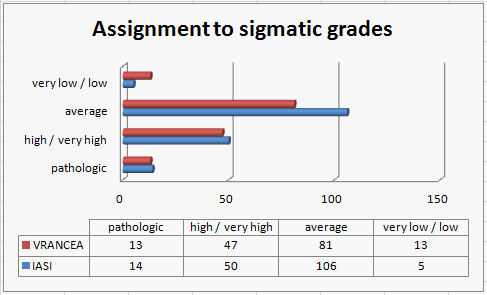
We have remarked 8.2% children who scored pathological values for weight (exceeding average + 3
sigma). This is not an alarming percentage; actually, it is not very unusual. We believed it would be
useful to continue the study of results by gender, in order to get a better insight especially concerning
the status of girls (Table 2).
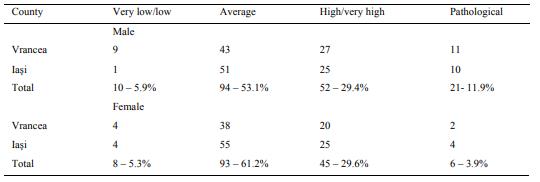
Among boys, average values are dominant (71.2%), but there is a percentage of 11.9% students who
featured a pathological weight. By counties, the differences are statistically insignificant (p> 0.05, Gl =
3, χ² = 7.01) and they suggest a similar situation concerning the obesity rate. Among girls, the average
values were scored only in 61.2% of the cases, while pathological values are present in 3.9% of the
children. The differences calculated by gender are statistically insignificant (p> 0.05, Gl = 3, χ² =
0.526).
The comparison between the results obtained for the two genders showed statistically insignificant
differences (p> 0.05, Gl = 3, χ² = 7.249), which underlines the fact that girls had not started to be
concerned with their appearance, yet.
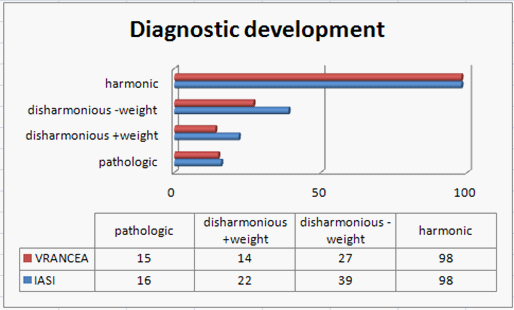
The most important indicator is the one represented by physical development diagnostic. Well-
balanced development was found in 59.57% of the children, while 31% students showed a lack of
balance; in this case, too, we found statistically insignificant differences (p> 0.05, Gl = 3, χ² = 2.957).
We underline that 9.43% of these students have a pathological development, considering the height
that exceeds average + 3 sigma, and mostly a weight higher than average + 3 sigma (Fig. 3).
Physical development diagnostic in the students within our sample
The misbalanced development including underweight issues was present in 20.1% of the students,
while underweight issues in 10.9% of the children. Practically, it is impossible for us to state that there
are many overweight children within this sample.
Another aspect to study was related to the distribution of cases of well-developed students by
gender. Among boys, the percentage of well-developed children reaches 58.2%, while differences are
insignificant (p> 0.05, Gl = 3, χ² = 5.277) if we consider the analysis by county. Among girls, 61.2%
are well-developed, while differences are insignificant if we consider the analysis by county (p> 0.05,
Gl = 3, χ² = 0.55) (Table 3).
The comparison between the two genders is important because we have found statistically
significant differences: p< 0.05 (Gl = 3, χ² = 8.284).
4. Discussions and conclusions
Our main objective was to assess the physical development of students from two counties in the
West of Moldavia, for pinpointing potential differences (Vasilov, 2001).
Average height was found for almost half of the children we measured. This is a normal result for
the age group 10-12, which generally does not show signs of puberty yet (Alexander, 2010: 92). These
modifications emerge later among rural children and later among boys. Students featuring pathological
values of height should get a medical examination in order to interpret the result afterwards (Cordeanu
et al.,2008). This may include a pathological process or simply an accelerated growth that has led to
exceeding standard values. However, it is difficult to interpret the results obtained by girls, because
some should have begun the puberty period, which includes significantly higher values of stature
compared to boys (for a short period) (Papalia & Olds, 1990: 395; Kreipe, 2011: 111).
Weight recorded mostly average values, which is a positive element. Only a small percentage of the
children measured by us showed pathological values for body weight. Within this sample, we have not
found an exaggerated growth of the body weight, unlike what specialists sometimes stress (Glavce et
al., 2008). Among the children, we have not found any tendencies of identifying themselves with
certain ideals of beauty, reason for which girls did not show any signs of obsessing over diets
(Braconnier, 1999: 7; Godeau, Arnaud, & Navarro, 2008: 122).
The most important indicator for selecting and advising a child to start a sports activity is the
physical development diagnostic. A well-balanced student has the highest chances of being able to
practice a sport consistently. An underweight student does not have enough strength to practice sports,
while overweight students show no interest in sports. Among girls, pathological development or excess
weight is less frequent, which means that they have started to be preoccupied by not gaining weight
(World Health Organisation, 2000).
The results obtained by counties with the same altitude level are similar. It would be necessary to
include other criteria for the selection of children for various sports. The criterion of family background
must always be included, because the development of rural children is lower than that of urban
children. The assessment of anthropometric indicators plays an important role within the monitoring of
general development of students, mostly when children plan to practice a certain sport.
References
Albu, A., & Rada, C. (2014). The dynamics of anthropological markers among Romanian teenagers between
1978-1999. Annuaire Roumain d’Anthropologie, 51, 65-72.
Alexander, R. (2010). Children, their World, their Education. London, New York: Routledge.
Bardov, V. G. (2009). Hygiene and Ecology. Vinnytsya: Nova Kniga.
Braconnier, A. (1999). Copilul tău de la 10 ani până la 25 de ani. Bucureşti: Teora.
Cordeanu, A., Bucaleţ, C., Stănescu, C., Dumitrache, C., & Nicolescu, R. (2008). Dinamica dezvoltării fizice a copiilor şi adolescenţilor din Romania în ultimii 50 de ani. Revista de Igienă şi Sănătate Publică, 58(2), 97-106.
Erdeli, G., & Dumitrache, L. (2001) Geografia populației. Bucureşti: Corint.
Eveleth, P., & Tanner, J. (1990). Worldwide Variation in Human Growth. Cambridge: Cambridge University Press.
Gavăt, V., Albu, A., & Petrariu, F. D. (2006). Alimentaţia şi mediul de viaţă în relaţie cu dezvoltarea copiilor şi a tinerilor. Iaşi: Editura “GR. T. POPA”.
Glavce, C., Moţa, P., Popa, I., Petrescu, M., Stan, C., & Popa, S. (2008). Evoluţia corpolenţei la adolescenţi (11-18 ani) și factorii modelatori. Revista de Igienă și Sănătate Publică, 58(2), 115-123.
Godeau, E., Arnaud, C., & Navarro, F. (2008). La santé des élèves de 11 à 15 ans en France/2006. Paris: INPES.
Iordache, C. (2009). Geografia populației și așezărilor umane din România. Craiova: Universitaria. Kreipe, R. (2011). Focusing on populations to improve the health of individual adolescents and young adults. Journal of Adolescent Health, 49(2), 111-112.
Misaki, N. (2013). Puberty in context: Toward a more nuanced understanding of early maturation. Journal of Adolescent Health, 53(6), 677-678.
Muntele, I., (1998). Populația Moldovei în ultimele două secole. Iași: Corson.
Papalia, D., & Olds, S. (1990). A Child’s World. New York, Toronto: McGraw-Hill.
Sonenstein, F. L. (2014). Introducing the well-being of adolescents in vulnerable environments study: Methods and findings. Journal of Adolescent Health, 55(6 Suppl.), S1-S3.
Ştirbu, M., Miu, G., & Simalcsik, A. (2003). Données concernant la dynamique du processus d’accélération de la croissance et du développement des adolescents et des jeunes. Annuaire Roumain d’Anthropologie, 40, 53-62.
Vasilov, M. (2001). Dezvoltarea fizică a copiilor din judeţele Moldovei. Iaşi: Editura Fundaţiei Altius Academis.
World Health Organisation. (2000). Obesity: Preventing and managing the global epidemic. Retrieved from file:///C:/Users/Admin/Downloads/WHO_TRS_894.pdf World Health Organisation. (1999). Programming for adolescent health and development. Retrieved from http://apps.who.int/iris/bitstream/10665/42149/1/WHO_TRS_886_(p1-p144).pdf World Health Organisation. (2007). WHO child growth standards. Retrieved from http://www.who.int/childgrowth/standards/second_set/technical_report_2.pdf
Copyright information

This work is licensed under a Creative Commons Attribution-NonCommercial-NoDerivatives 4.0 International License.
About this article
Publication Date
10 June 2016
Article Doi
eBook ISBN
978-1-80296-010-5
Publisher
Future Academy
Volume
11
Print ISBN (optional)
-
Edition Number
1st Edition
Pages
1-509
Subjects
Sports, sport science, physical education
Cite this article as:
Onose, I., Hodorca, R., & Albu, A. (2016). Assessment of Anthropometric Indicators among Rural Students in the West of Moldavia Marketing. In V. Grigore, M. Stanescu, & M. Paunescu (Eds.), Physical Education, Sport and Kinetotherapy - ICPESK 2015, vol 11. European Proceedings of Social and Behavioural Sciences (pp. 266-272). Future Academy. https://doi.org/10.15405/epsbs.2016.06.36