
Analysis of Body Mass Index in Romania’s School Population


Abstract
Nowadays, childhood obesity is a negative phenomenon recognized worldwide. A consequence of a sedentary lifestyle doubled by unhealthy eating habits, obesity can affect deeply the personality of a child. The numerous warning signals of the experts have generated educational measures in many countries, either by national projects or regional and local initiatives. As the BMI is one of the relevant indicators for the health of the younger generation, this paper tackles the BMI level of the Romanian school population in the 1st, 5th, 9th and 12th grades. For the purpose of this study, we analyzed data collected from measuring the somatic indicators (height and weight) of 124,000 students from all regions of the country, in rural and urban areas. The BMI values were analyzed and compared based on the grade and gender, according to the above-mentioned variables. The results of this study highlighted a number of trends in the evolution of this index from one age to another, and its relationship with the environment of children. Coupled with the results of other research in the field, the study aims to bring forth and to the attention of the authorities the importance of exercise in children’s lives and the need for an appropriate educational setting.
Keywords: Body mass index, physical exercises, sport, active lifestyle
2. Problem statement
Obesity continues to be today one of the first consequences of a sedentary lifestyle, often associated
with inadequate dietary habits. The main way to identify the obesity risk or obesity is by measuring the
body mass index (BMI). (Guo et al, 1994; Mei et al., 2002) Mei et al. (2002) have demonstrated that
the BMI has greater validity in comparison to other methods of body screening (Rohrer index, weight/
height ratio) for both the identification of underweight and overweight in children aged 2 to 9 years.
The body mass index is calculated by dividing the weight by height squared (kg / m2); a BMI of 25-29
defines the subject as overweight, while a BMI > 30 defines obesity.
Child obesity is currently considered a public health problem, because its prevalence is steadily
increasing, and the negative consequences of this condition are manifested not only in childhood, but
they also expand into adulthood, when cardiovascular diseases occur (congestive heart failure,
hypertension, myocardial infarction or stroke), joint ailments and some types of diabetes, respiratory
disorders, orthopaedic ailments, sleep apnoea, negative emotional states, and lower intellectual
capacity. (Halkjær, Holst, & Sørensen, 2003)
The increased interest in obesity research is a consequence of the fact that it has a negative influence
on the personality of children. Once they reach the age of adolescence, youth and adulthood, they will
have self-esteem issues, increased risk of cardiovascular diseases (in adults aged between 30 and 74
years), infertility and reduced life expectancy. These are also the reasons why many studies show
periodically the changes recorded in the BMI levels of different age groups, by gender and living
conditions. The results are often associated with changes which are recorded in the dietary habits and
lifestyle of the population. (Rich-Edwards et al., 1994; Stevens et al., 1998)
The BMI values in childhood are a strong predictor of morbidity and mortality in adulthood, and
this is revealed by the significant correlations between the BMI at different ages. The prediction is
excellent for 18-year-olds, good for 13-year-olds, and only moderate for childhood ages (below 13
years old). Studies have shown that 18-year-old adolescents with excess weight have a risk of obesity
in adulthood ranging between 34% for men and 37% for women. (Guo et al., 1994)
As obesity is widespread at this age because of unhealthy eating and sedentary life, specialists are
observing the evolution of the increasing mass weight in different regions of the world. Thus, an
interesting classification of the percentages of obese people (BMI over 30) has emerged, based on
information provided by studies from different countries of the world. Japan and Korea have the fewest
obese persons in the world (only 3.2% of the population is obese), while the United States are at the
other extreme, being the country with the highest number of obese persons (30.6%). The high body
mass index (BMI) among children and adolescents continues to be a public health issue in the United
States. For example, between 1999 and 2006, the prevalence of the BMI at or above the 95th percentile
(the “obesity level”) tripled among school-age children and adolescents, and remained high for about
17% of boys and girls, regardless of race. (Ogden, Carroll, & Flegal, 2008)
A study carried out in Portugal, in the years 2002-2003, found that 20.3% of children were
overweight and 11.3% of children were obese. These results indicate an incidence of overweight/
obesity of 31.5%. Girls had a higher percentage of overweight than boys. The same situation is found
in other Mediterranean countries such as Spain (30%), Greece (31%) and Italy (36%). These high
values require a national intervention program to control childhood obesity (Padez et al., 2004).
According to data from a study conducted in Spain on young adults, 25 and 30 BMI values
correspond to percentiles 80 and 97 in males, and 85 and 97 in females. A secular trend of growth was
observed among population with a non-proportional increase of weight to height ratio (BMI) values,
particularly for those corresponding to the 97th percentile. (Carrascosa Lezcano et al., 2008)
In Greece, among children in primary education, 59.4% of the participants had a normal BMI,
25.8% were overweight and 14.8% were obese, without significant differences between genders.
(Tokmakidis, Kasambalis, & Christodoulos, 2006)
An interesting study was conducted in 2005, in Bucharest, on a group of 1,100 subjects, in order to
identify the trend of childhood obesity onset in relation to the weight of the parents. The
anthropometric data of parents and the socio-economic conditions had an important role, determining
the role of the living conditions of a family in the evolution of children’s BMI. It has been found that
children with at least one overweight parent (in most cases, the father) tend to become overweight too.
Overweight was found in a ratio of 50-80% in children and parents from families with high economic
level. (Milici et al., 2007)
According to a study conducted by Eurostat (European Statistical Office) in Romania, 7.7% of men
and 9.5% of the female population is obese. The same study reveals that one Romanian in three is
overweight and one in four is obese. Overall, in Romania there are 3.5 million obese, according to a
study conducted by the company Abbot Laboratories.
In 2006, in Stockholm, at the European Ministerial Conference on Obesity, WHO launched the
COSI project - European Childhood Obesity Surveillance Initiative. The study started in 2007 and so
far has focused subjects from 18 countries, including Romania, since 2012. In Romania, the study was
conducted for the age group 8.0-8.9 years and revealed that the percentage of normal weight in girls
(71.06%) is by 5.82% higher than the percentage of normal weight in boys (65.24%), while the
prevalence of obesity in 8-year-old boys (15.03%) is by 6.79% higher than the prevalence of obesity in
girls of the same age (8.24%). The prevalence of overweight in 8-year-old children in Romania is
15.11%, and the prevalence of obesity is 11.64%. Most of the children included in the study had a
normal weight, irrespective of the area of residence (urban 64.15%, semi-urban 71.21%, and rural
72.20%). A quarter of the children living in the semi-urban area were overweight or obese. The highest
percentage of obese children was found in urban areas (13.15%), followed by those living in rural areas
(10.18%) and semi-urban areas (9.85%). (Nicolescu, 2013)
1.1. Purpose
The aim of this paper is to present the most recent trends in the body mass index (BMI) among
Romanian children and adolescents in the 1st, 5th , 9th and 12th grades, from 26 counties (representing all
development regions). Considering that the evaluation reflects the students’ development level, the
environmental and educational influences, this paper shows some comparative results achieved in
similar studies conducted worldwide.
The study shows the results of the research on this topic conducted within the project
(2011-2012, MCTS, UNEFS). The
research consisted in evaluating the bio-motor potential of students in the grades aforementioned
through a set of tests to assess the motor skills (speed, strength, stamina, coordination abilities),
functional abilities (Ruffier test) and the somatic development (height, weight, BMI).
2. Research methodology
2.1. Objectives
The following topics were tackled in this study: centralizing data from 28 counties; statistical
processing of the results achieved by students during the somatic measurements; comparing the results
obtained in this study with similar results recorded in Romania in previous studies, and with the results
of other studies carried out in other countries.
2.2. Methods
Data from these measurements were statistically processed (SPSS 17.0), and the findings
highlighted values of the indicators of the central tendency (arithmetic mean) and of the dispersion
(coefficient of variation). Also, the ANOVA test was applied to determine the significance of the
difference between BMI values recorded by students in the 28 counties of Romania, split by gender
(male and female). To highlight the normal weight, we used the BMI percentile calculation, a function
showing the tendency to overweight of the tested children.
2.3. Subjects
The results analysed in this paper come from the somatic evaluation of 115,000 students (45,127
boys and 69,873 girls) in the 1st, 5th, 9th and 12th grades, aged 7-8, 11-12, 15-16 and 18-19 years.
2.4. Results
Table 1 comprises values of the arithmetic mean, the coefficient of variation (Cv) and the
percentiles, indicating the percentage of the normal weight population within the investigated sample.
From the analysis of results by grade, it appears that the BMI values for girls are ranging between
15.24 and 17.27 (1st grade), 17.42 and 20.06 (5th grade), 19.22 and 21.65 (9th grade), and 19.89 and
22.91 (12th grade). For boys, the values are ranging between 13.15 and 26.50 (1st grade), 17.34 and
19.53 (5th grade), 20.31 and 22.64 (9th grade), and 20.20 and 24.40 (12th grade). In all counties, the
average BMI level is within normal limits, except for the 1st grade boys from Sibiu, where data indicate
a trend to overweight (in the investigated sample).
Important information on the BMI values is obtained from calculating the percentiles, which
illustrate the frequency of cases in the normal weight range. While in the 1st and 5th grades the values of
the normal weight percentages are relatively equal, in the upper grades, there is a clear trend to
overweight among boys. Table 1 shows that the percentage of normal BMI values in the 1st grade girls
is ranging between 94.5 and 100%; in the 5th grade, it ranges between 92% and 99.2%; in the 9th grade,
it is between 86.3% and 97.2%; in the 12th grade, it is between 83.7% and 98.7%. For boys, the BMI
values range between 95.5% and 100% in the 1st grade, between 90.2% and 97.5% in the 5th grade,
between 80% and 96.5% in the 9th grade, and between 71% and 98.7% in the 12th grade. It should be
noted that the percentage of normal weight is lower in boys than girls, especially in grades 9th and 12th.
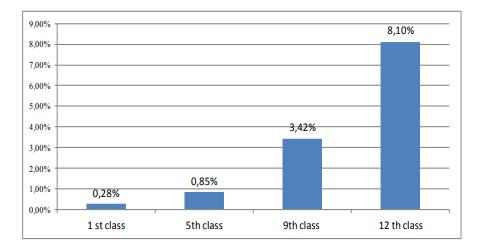
The values of the difference between the two genders/ grades are represented in Chart 1. The
percentages are higher in boys, with averages ranging from 0.28% (1st grade) to 8.10% (12th grade).
In Chart 2, we can see the average percentages among children with elevated BMI levels, which
indicate overweight (> 25). For both genders, these values increase progressively from one grade to
another, and the levels are higher in boys compared to girls.
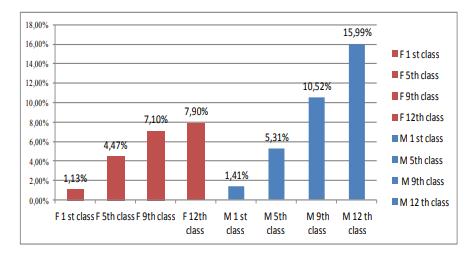
Table 1 reveals that the values ranging between 10 and 20% of the coefficients of variation for both
genders, in all counties, indicate an average homogeneity of the BMI for the studied age groups. By
applying significance tests for the difference between the coefficients of variation, it has resulted that
the values registered in girls and boys are not significant at p = 0.05.
3. Discussions and conclusions
From the analysis of the data presented previously, it appears that the population of the target group
has a BMI in the normal range in most cases. In 7-8 years old children, girls and boys, the values of
this indicator can be 100% normal (Buzau, Teleorman, Tulcea, Vaslui counties). Comparing these
results with the data from the literature confirms the trend to overweight in boys compared to girls. The
average difference between genders, in the four grades studied, varies between 2% (1st grade) and 7%
(12th grade). Regarding the age group for which we identified reference data in the literature (8 to 9-
year-olds), we have found that the data obtained are lower, namely in children aged 7-8 years the
overweight trend is lower.
Moreover, the percentage of overweight increased from one grade to another, confirming the data
from literature, according to which in ontogenesis the risk of exceeding the optimum weight increases
as a result of the amplified action of the risk factors.
The values obtained are consistent with data from the literature (Carrascosa Lezcano et al., 2008),
concerning the trend to overweight in boys compared to girls, and the increasing gap (in terms of this
trend) between genders, with age. By comparing our data for the 12th grade with the available literature
data, we found that the BMI values are weaker for boys but better for girls. Even under these
circumstances, boys tend to go beyond the optimal weight.
However, the values we have obtained are better than those reported for the US adolescents (Ogden,
Carroll, & Flegal, 2008) and those reported for primary school children in Greece. (Tokmakidis,
Kasambalis, & Christodoulos, 2006)
The results of our study highlight that, in the investigated school population, the BMI values are in
most cases in the range of normality. Percentages ranging from 1.13% (F) and 1.41% (M) in the 1st
grade, 4.47% (F) and 5.31% (M) in the 5th grade, 7.10 (F) and 10.52% (M) in the 9th grade, and 7.90%
(F) and 15.99% (M) in the 12th grade, indicate that the overweight trend in those children has rather
small levels compared to other sources of literature that studied less numerous groups.
Although the BMI has certain limits, it remains one of the most relevant indicators for the
population health. Future studies will highlight the relationship between the BMI, geographical
environment and the standard of living of the population in a specific development region of Romania.
References
Carrascosa Lezcano, A., Fernandez Garcia, J. M., Fernandez Ramos, C., Fernandez Longas, A., Lopez Siquero, J. P., … & Yeste Fernandez, D. (2008). Spanish cross-sectional growth study 2008 (Part II, Height, weight and body mass index values from birth to adulthood). An Pediatr (Barc.), 68(6), 552-569. Guo, S. S., Roche, A. F., Chumlea, W. C., Gardner, J. D., & Siervogel, R. M. (1994). The predictive value of childhood body mass index values for overweight at age 35 years. Am J Clin Nutr., 59(4), 810-819. Halkjær, J., Holst, C., & Sørensen, T. I. A. (2003).Intelligence Test score and educational level in relation to BMI changes and obesity. Obesity Research, 11(10), 1238-1245.
Mei, Z., Grummer-Strawn, L. M., Pietrobelli, A., Goulding, A., Goran, M., & Dietz, W. (2002). Validity of body mass index compared with other body-composition screening indexes for the assessment of body fatness in children and adolescents. Am J Clin Nutr., 75(6), 978-985.
Milici, N., Sandu, D., Glavce, C., Macovei, A., Popa, I., & Roville Sausse, F. (2007). La relation entre la corpulance des parents et l’IMC des enfants et des adolescents de Bucarest (Roumanie). Biométrie humaine et anthropologie, 25(3-4), 167-175.
Nicolescu, R. (coord.). (2013). Evaluarea stării de nutriție a copiilor din ciclul primar prin participarea la proiectul European Childhood Obesity Surveillance Initiative. (Raport național 2013). Retrieved from http://www.sfatulmedicului.ro/Educatie-pentru-sanatate/indicele-de-masa-corporala-calcul-siintepretare_11906 Ogden, C. L., Carroll, M. D., & Flegal, K. M. (2008). High body mass index for age among US children and adolescents, 2003-2006. JAMA, 299(20), 2401-2405.
Padez, C., Fernandes, T., Mourão, I., Moreira, P., & Rosado, V. (2004). Prevalence of overweight and obesity in 7-9-year-old Portuguese children. Am J Hum Biol., 16, 670-678. Retrieved from http://onlinelibrary.wiley.com/doi/10.1002/ajhb.20080/ abstract; jsessionid= 99A0E202D3836EC8B5EBFED2004C5A39.f03t01 Rich-Edwards, J., Goldman, M., Willet, W., Hunter, D., Stampfer, M., … &Marrison, J. (1994). Adolescent body mass index and infertility caused by ovulatory disorder. Am J of Obste Gynec., 171(1), 171-177. Stevens, J., Cai, J., Pamuk, E. R., Williamson, D. F., Thun, M. J., & Wood, J. L. (1998). The effect of age on the association between body-mass index and mortality. N Engl J Med., 1(338), 1-7.
Tokmakidis, S. P., Kasambalis, A., & Christodoulos, A.D. (2006). Fitness levels of Greek primary schoolchildren in relationship to overweight and obesity. Eur J Pediatr., 165(12), 867-874.
Copyright information

This work is licensed under a Creative Commons Attribution-NonCommercial-NoDerivatives 4.0 International License.
About this article
Publication Date
10 June 2016
Article Doi
eBook ISBN
978-1-80296-010-5
Publisher
Future Academy
Volume
11
Print ISBN (optional)
-
Edition Number
1st Edition
Pages
1-509
Subjects
Sports, sport science, physical education
Cite this article as:
Stanescu, M., Ciolca, C., Paunescu, A., & Tudor, V. (2016). Analysis of Body Mass Index in Romania’s School Population. In V. Grigore, M. Stanescu, & M. Paunescu (Eds.), Physical Education, Sport and Kinetotherapy - ICPESK 2015, vol 11. European Proceedings of Social and Behavioural Sciences (pp. 210-217). Future Academy. https://doi.org/10.15405/epsbs.2016.06.29