
Optimal Ranking of the Preparation Means in High Performance Athletic Training. The Experimental Research


Abstract
The paper presents the second part of preparing the athletic training using the Taguchi technique, namely the experimental research. For the athlete C.D., the main training means and their limit values were set. The experiment consisted in the athlete’s training for 25 days with the same value of factors, as training means. The paper presents the development of the training as experiments, and the calculated values, the average, the variation, and the consistency of the results achieved in the trials, calculated in MS Excel, the effect of the training methods over the measured value (performance) and over the result consistency ratio. The training methods that have the largest influence over the athlete’s training are pointed out. An improvement in the athlete’s performance in the experimental year is obvious. The experiment defines the optimization of the athlete’s training that has been the object of the study. The results are only relevant for her and can represent a foundation for her future training. In the case of the athlete that was the subject for this study, it has been determined the order of importance of the training means (factors) which influence the results of the trials.
Keywords: Average, performance, performance consistency, limit values
Introduction
The Taguchi technique may be a very interesting way of conducting the athletes’ training sessions,
with the purpose of achieving higher performances. According to the model classification (Beju, 2002),
we can consider this method a training model. As an example, the paper shows how the Taguchi
technique is used in the 20 km women’s race walking event using as a trial the 5 km walking. This
particular distance was set because the measured values were conditioned by the stopwatch for five
consecutive days. It was considered that this particular distance was the most relevant to be covered in
five consecutive days, rendering the possibility of achieving maximum performance and with a high
probability of recovering the energy resources. The steps followed were:
October 2003 – setting and designing the experimental training model for C.D., based on the Taguchi technique; conducting the experiment;
November 2003 - June 2004 – recording the data obtained during the training sessions of C.D. for running the experiment.
Materials and methods
The research approach was based on the following hypotheses:
applying Taguchi method in high performance race walking training establishes a hierarchy of training means with the greatest influence on performance, especially on its constancy;
specifying the means of training and optimal working volumes provides increased prerequisites for achieving performance targets.
In the case of C.D., the study monitors the values obtained during trials. Also, the main training
techniques were set and were given minimum or maximum values(Alexis, 1999) obtained over an
entire month of training (kilometres travelled or minutes of training). These values are the ones that the
athlete is able to achieve over the eight months of training within the experiment (E1, E2, E3, E4, E5,
E6, E7, E8),November 2003 - June 2004; Each experiment implies the training of the athlete for 25
days with the same factor values, those of the training means. Then, over the final days, the athlete
continues the training in the same way, and every day she is timed for the 5 km test (there will be 5
timings, noted i1, i2, i3, i4, i5). The means of training were established based on the classification
determined by the Italian coach Damilano (1994).
The main training methods (factors) used by C.D., as well as their limit values expressed in
travelled kilometres in one month of training or in strength minutes, motility, carried out in one day
and noted 1 and 2, are:
A = TV – total volume of travelled kilometres (running and walk), (A1= 500 km/month; A2= 600 km/month);
B = MV – total volume of walk kilometres, (B1 = 150 km/month; B2= 400 km/month); C = MT1 – km walk in tempo 1 (5’30”/km - 5’05”/km), (C1 = 80 km/month; C2 = 250 km/month); D = MT2 – km walk in tempo 2 (under 5’/km), (D1= 40 km/month; D2= 100 km/month); E = strength exercises [min], (E1 = 10 min/day; E2 = 20 min/day); F = stretching exercises - motility [min], (F1 = 10 min/day; F2 = 20 min/day).
One must take into consideration the situation when only the time interval in which the athlete
finishes the trial is of interest, noted with “i”. If there is emphasis on the importance of the interaction
between the factors noted B – total volume of walk kilometres and C – the volume of walk kilometres
travelled in 5’30”/km - 5’05”/km tempo; then the athlete’s training can be assimilated with an
experiment for optimizing the Taguchi style.
Such an experiment must be conducted according to a matrix of L8-type experiments (Everrett,
Adam, & Ebert, 2001),each representing one month of training, in pursuing a minimum criterion of
optimization (the trial time). Also taking into account other principles according to which the athletes’
training process is organized, such as following the volume and intensity curve during the training
year, the experiments were conducted in the E1-E8 order.
Results
The training experiments and the trial results for each experiment are presented in Table 1.
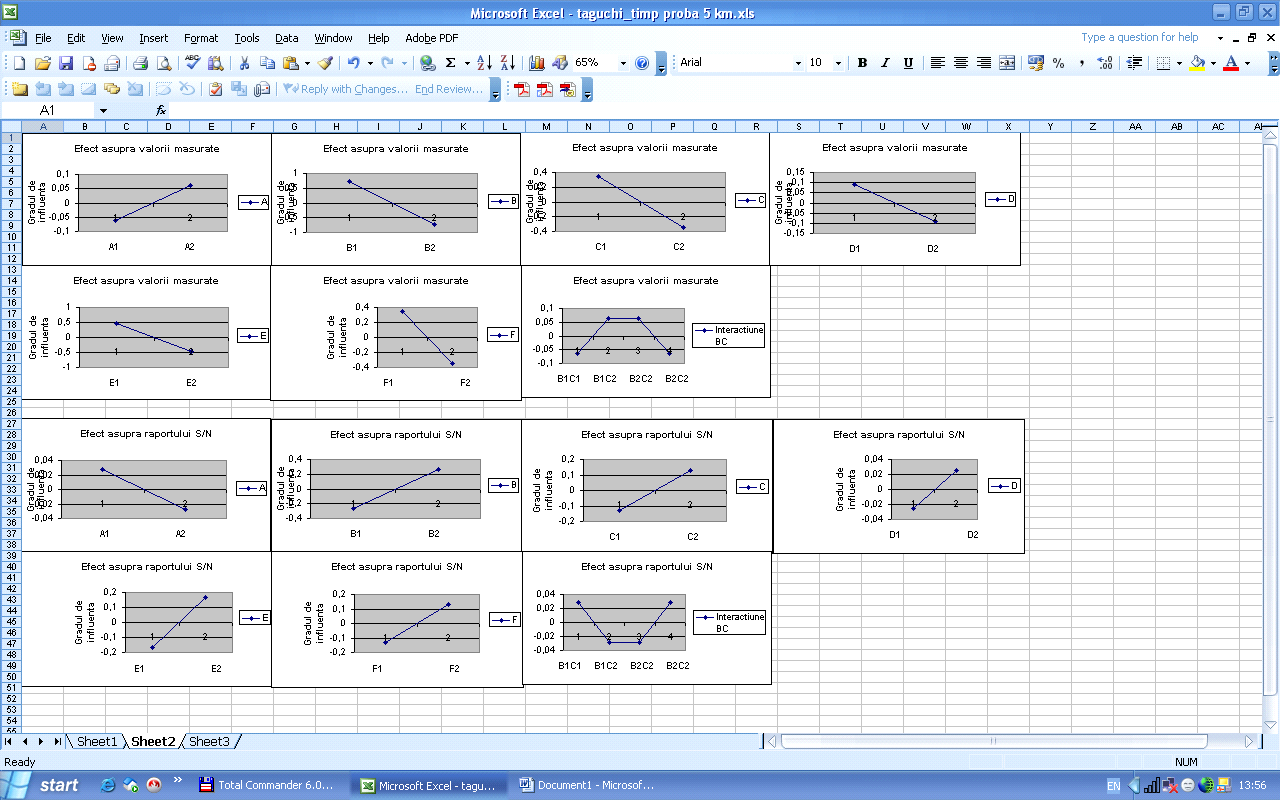
The data processing was achieved through an application written in MS Excel, taken from the
Engineering Faculty (“Lucian Blaga” University of Sibiu), where this application is being used for the
optimization of technological processes. Figures 1 and 2 present screen captures with the application
mentioned before.
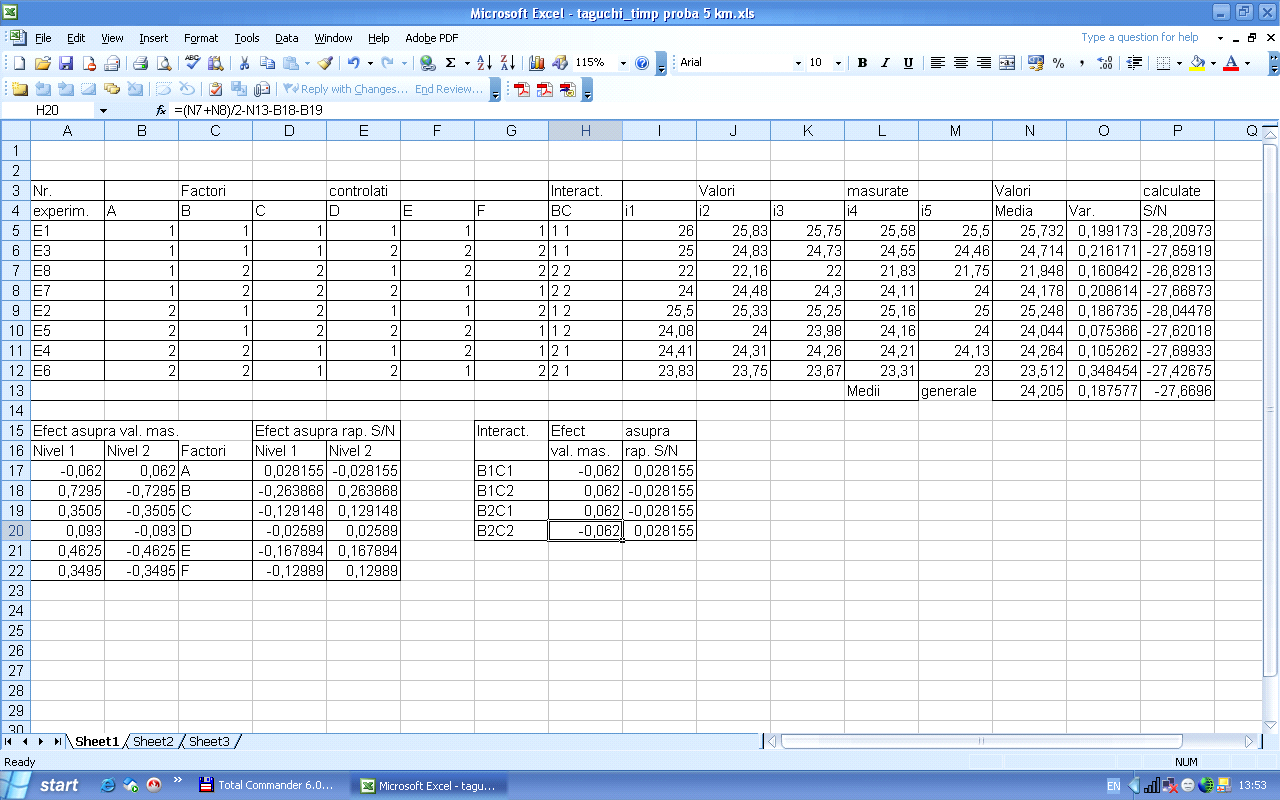
The values calculated for the conducted experiments, as the average time achieved in the trial, time
variations (dispersion of the resulted values around mean values) and the signal/noise ratio = S/N (the
influence of the disturbing factors over the trial time, materialized in the result consistency) are taken
from the MS Excel application and presented in Table 2.
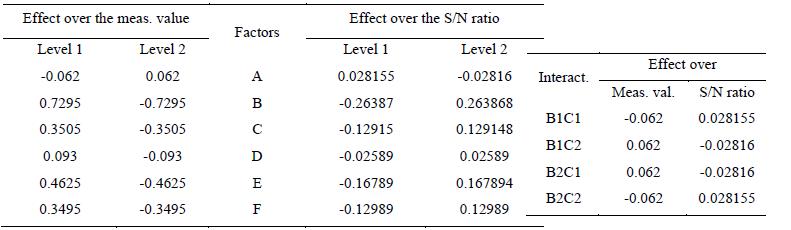
Also, the effect (influence) of the entry factors over the measured value (trial time, also called
) and the S/N ratio are presented in Table 3.
As the graphical representations created by the application are realized automatically at different
scales, the graphical representation of the effect of the factors over the measured value and the S/N
ratio is being done again in Figures 3 and 4. The representations are typical for the Taguchi technique.
Within the Taguchi technique-based representations, the influences of the training means (entry
factors) are represented through line segments. The longer a segment is, the greatest the influence of
the factor. The influential training means are ranked according to the length of the characteristic
segments.
The interpretation of the influence of the factors (training means) is being done by granting the
greatest importance to the influence of these factors over the S/N ratio as opposed to their influence
over the measured value in trials. The results are illustrated in the two representations (Fig. 3 and 4)
created with Auto Cad.
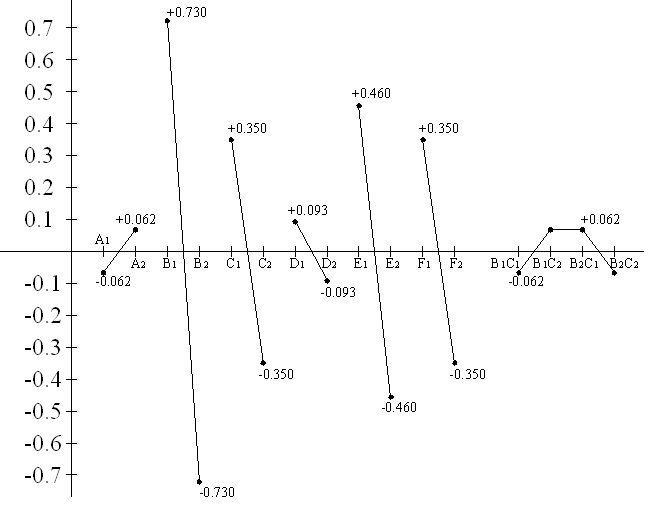
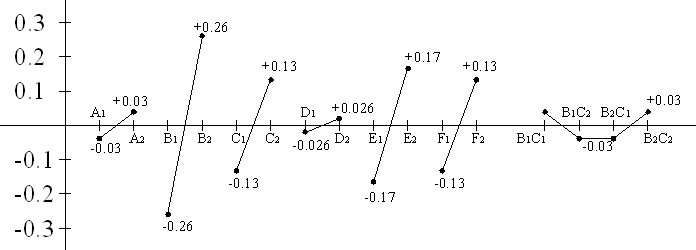
From the representations created in Figures 3 and 4, based on the Taguchi technique
recommendations, it results that the order of importance of the training means(factors) which influence
the trial results is the following: B, E, C, F, A, D,where:
B = MV – total volume of walking kilometres; E = strength exercises; C = MT1 – km walking in tempo 1 - 5’30”/km – 5’05”/km; F = stretching exercises – motility; A = TV – total volume of km (running + walking ); D = MT2 – km walking in tempo 2 – under 5’/km;
It can be noticed that the influence of the A factors – total volume of kilometres – walk kilometres
in tempo under 5'/h=km is reduced. The greatest influence over the performance, but especially over
the result consistency (Fig. 4), is held by the B factor, MV – total walking kilometres volume; Then the
E factor is less important, the strength exercises, followed by the C and F factors (MT 1 – kilometres
walking in tempo 1 and stretching exercises – motility) with equal influence. As factors A and E are
not very significant, the smallest values are chosen for these factors and the extra time can be used in
the athlete’s completion of training regarding other aspects (e.g. psychological process or motivation).
In order to reach a higher performance, the subject of the study must carry out the training according
to the combination of the following factors: A1, B2, C2, D1, E2, F2, after the pattern:
A1= TV – total volume of km (running + walk), 500 km/month; B2= MV – total volume of km (walk), = 400 km/month; C2 = MT1 – km walk in tempo 1 - 5’30”/km – 5’05”/km = 250 km/month; D1= MT2 – km walk in tempo 2 - under 5’/km = 40 km/month; E2= strength exercises = 20 min/day; F2 = stretching exercises - motility = 20 min/day.
Discussions and conclusions
After conducting the experiments, the following conclusions can be drawn:
through the actual experiment, certain stages of the research could be determined, clarified, better understood, and they could provide new possibilities of receptiveness for the success of the basic experiment;
the Taguchi technique represents an interesting instrument in the athletic training of various disciplines and may represent a research instrument which could lead to a growth in the athletic performance and in the scientific foundation of the athletes’ training, with minimum costs and maximum efficiency;
the experiment defines the optimization of the athlete’s training that has been the object of the study. The results are only relevant for her and can represent a foundation for her future training. Extending the experiment for other athletes in the same discipline as well may emphasize mutual elements which could become current practice in conducting future training sessions; in the case of the athlete that was the subject for this study, the order of importance of the training
means (factors) which influence the trial results is presented in the following configuration: B, E, C, F,
A, D, where:
B = MV – total volume of km (walking)
E = strength exercises;
C = MT1 – km walking in tempo 1 - 5’30”/km – 5’05”/km;
F = stretching exercises – motility;
A = TV – total volume km running and walking;
D = MT2 – km walk in tempo 2 – under 5’/km.
The research hypothesis is confirmed, that this method has established a hierarchy of the means of
training with the greatest influence on the performance and the constancy of performance, increasing
training efficiency.
MVtotal volume of kilometres in walk (B factor) is the one that determines the greatest influence over the results, especially over the consistency of results (Fig. 4);
training means A (total volume) and D (march volume under 5'/km) have a small significance, the shortest values are chosen for these factors and the extra time can be used in the completion of the athlete’s training where other aspects are concerned;
in order to achieve good results, the athlete must perform the training session according to the factor combination (A1, B2, C2, D1, E2, F2 ), as follows: A1= TV – total volume of km (running + walk), 500 km/month;
B2= MV – total volume of km in walk, = 400 km/month; C2 = MT1 – km walk in tempo 1 - 5’30”/km – 5’05”/km = 250 km/month; D1= MT2 – km walk in tempo 2 – under 5’/km = 40 km/month; E2= strength exercises = 20 min/day; F2 = stretching exercises - motility = 20 min/day.
very important, analysing the results from the 20 km walking trial, an improvement in the performance can be seen, therefore the following aspects can be noticed:
In 2003 – best result
Inthe year of the experiment – best performance
This research confirmed the hypothesis that the use of optimal working volumes provides increased
prerequisites for achieving performance targets.
Suggested trends
the use of Taguchi technique for efficiency in training for the athletes from the national athletics team
the application of Taguchi technique in the training process of other athletic events or in other athletic disciplines;
ranking the training means, in the sense of determining the most influential methods over the results;
secondary importance for the less influential training means, in the sense of using the time scheduled for these means for other methods; optimization of the training by using the correspondent methods and volumes, which leads directly
towards the desired result;
using the Taguchi technique in individual events, with individualized training sessions for athletes with various types of character, different results, various ages, trained by coaches with different personalities.
References
Alexis, J. (1999). Metoda Taguchi. Planuri de experienţe. București: Editura Tehnică.
Beju, L. (2002). Bazele teoriei sistemelor. Sibiu: Editura Universităţii “Lucian Blaga”.
Damilano, S. (1994). La marcia. Scienza & TecnicaAtleticastudi, 6, 113-119.
Everrett, E., Adam, Jr., & Ebert, R. J. (2001). Managementul producţiei şi al operaţiunilor. București: Teora.
Copyright information

This work is licensed under a Creative Commons Attribution-NonCommercial-NoDerivatives 4.0 International License.
About this article
Publication Date
10 June 2016
Article Doi
eBook ISBN
978-1-80296-010-5
Publisher
Future Academy
Volume
11
Print ISBN (optional)
-
Edition Number
1st Edition
Pages
1-509
Subjects
Sports, sport science, physical education
Cite this article as:
Bădescu, D. (2016). Optimal Ranking of the Preparation Means in High Performance Athletic Training. The Experimental Research . In V. Grigore, M. Stanescu, & M. Paunescu (Eds.), Physical Education, Sport and Kinetotherapy - ICPESK 2015, vol 11. European Proceedings of Social and Behavioural Sciences (pp. 171-178). Future Academy. https://doi.org/10.15405/epsbs.2016.06.24