
Overweight and Obesity in Slovak High School Students


Abstract
Childhood and adolescent overweight and obesity are important public health concerns. Common defınitions of paediatric overweight and obesity are based on BMI (Going et al., 2011). Slovakia is one of the few countries with national BMI standards that take into consideration dietary habits and local genotypes. The purpose of this study was to determine the prevalence of overweight and obesity among adolescents of Prešov region in Slovakia. A non-randomized cross-sectional study was used to determine incidence of obesity in adolescents living in the region of Prešov. Research sample consisted of 1,015 participants (550 girls; 465 boys) aged between 15 and 18 years. BMI values in particular age groups of both genders were assessed according to Slovak National Reference Standards. Results: For both genders, mean values of body height and body weight and mean BMI values across all age categories fell between 50th and 75th percentile. In total, 6.4% of boys and 6.8% of girls were overweight, and 9.4% of boys and 8.2% of girls were obese. The highest prevalence of overweight was found for 18-year-old boys and for 17-year-old girls, and the highest prevalence of obesity was found for both 15-year-old boys and girls. The comparison of our findings with available data from National Anthropometric Survey on physical development of Slovak youth in 2001 showed lower prevalence of overweight, but higher percent prevalence of obesity in girls and boys.
Keywords: Body weight, body height, BMI, Slovak National Reference Standards, prevalence
Introduction
Growth and development of an individual are determined by genetic and environmental factors
including lifestyle and socioeconomic conditions. These factors may have either a positive or negative
effect on genetic developmental dispositions (Nováková, Hamade, & Ševčíková, 2004). Growth spurt
and secular trend over the past few decades are evidence of how changing life conditions affect growth
parameters of children and youth. Monitoring basic somatic parameters of children and adolescents is
an important assessment tool used to determine actual health and nutritional status. Slovakia is one of
the countries where experts thoroughly investigate growth characteristics of child population, which
allows for acquiring comprehensive knowledge about developmental trends of Slovak children and
youth. At the same time, Slovakia is one of the few countries with national standards for the
assessment of body height, body weight and BMI. Thanks to National Anthropometric Survey (NAS)
conducted at 10-year intervals, tools to monitor and assess current situation in this field are available.
Over the past 50 years, the analysis of somatic development of Slovak children has confirmed that
Slovak children and youth demonstrate both growth acceleration and moderate increase in overweight
and obesity. The analysis of available NAS data from 2001 revealed that 10.7% of girls and 11.3% of
boys were overweight, and 6.4% of girls and 6.7% of boys were obese (Nováková, Kajaba, &
Salkayová, 2014).
Worldwide, childhood and adolescence overweight and obesity represent a serious health concern.
Their continually increasing prevalence is induced by imbalance between energy intake and energy
expenditure caused by poor dietary habits and lack of physical activity (Kožuchová & Bašková, 2013).
From the perspective of health risks, childhood obesity is more serious than adulthood obesity. In
addition to serious health problems such as dyslipidaemia, type 2 diabetes, arterial hypertension,
atherosclerosis, or metabolic syndrome, childhood obesity affects children’s experience, state of mind
and intimacy leading to frustration, depression, social discrimination, which manifest especially during
this age period (Hlavatá, 2007).
With respect to the risk factors associated with childhood obesity, early detection of obesity is
crucial. Childhood age is specific in terms of determining overweight and obesity. In addition to
examining body weight itself, which naturally increases during the growth and developmental period,
body weight should be assessed relative to body height. Worldwide, the most applied and the simplest
body index used to assess overweight and obesity is the body mass index (BMI), which takes into
consideration the relation between body weight and body height. In children, BMI values are
significantly age-dependent.
High BMI values during childhood and adolescence are associated with increased probability of
adulthood obesity. As much as 80% of obese children tend to remain obese in adulthood as well (Lisá,
2004). In Slovakia, girls and boys under 18 years of age are assessed according to BMI percentile
charts, which allows for comparing children BMI with respect to age and gender against reference
norms for a given population. The assessment of BMI based on a percentile chart is considered to be
a valid assessment tool. Children are classified as overweight or obese when their BMI exceeds 90th
percentile or 97th percentile, respectively. BMI values ranging from 25th to 75th percentile indicate
normal weight, while BMI values below 25th percentile indicate underweight. BMI between 75th and
90th percentile is indicative of above-normal weight (Hlavatá & Rajteková, 2008).
This paper, which was supported by the Slovak Research and Development Agency pursuant to
contract no. APVV-0768-1, provides findings related to the incidence of overweight and obesity of
contemporary high school students living in Prešov region.
The purpose of this study was to determine the prevalence of overweight and obesity among
adolescents of Prešov region in Slovakia.
Materials and methods
A non-randomized cross-sectional study was used to describe selected indicators of body
composition as predictors of health risks in high school students from the Prešov region, with respect to
gender differences.
The sample consisted of 1,015 high school students aged 15 to 18 years (boys n = 465; girls n =
550). At the time of measurement, mean decimal age of students (mean ± SD) was 17.2 ± 1.2 years.
The study was conducted between October and December 2013. The sample consisted of students
attending 14 schools that differed in the orientation of the teaching process (college-preparatory
schools, high schools of art, vocational high schools). Schools were selected using random, stratified
sampling in the respective districts, with one school per district. Subsequently, classes from 1st through
4th grade were randomly selected, one class per grade.
Participants took part in basic measurement of anthropometric parameters. Body height was
measured using a portable stadiometer (SECA 217, Hamburg, Germany) to the nearest 0.1 cm. Body
weight measured to the nearest 0.1 kg was determined using direct segmental multi-frequency
bioelectric impedance analysis (DSM-BIA) device InBody 230 (Biospace Co., Ltd.; Seoul, Korea).
BMI value was calculated using a standard equation, according to Keys et al. (1972).
Somatic development expressed by body height, body weight and BMI of both female and male
students was assessed by comparing their values against reference values, according to Slovak National
Reference Standards based on National anthropometric survey from 2001 and 2011 (NAS, 2001,
2011), which provide data about dietary habits and local genotypes. Participants were assessed
according to their age and changes in the degree of obesity (BMI value). The students were assigned
into age categories according to the rules of decimal age division devised by World Health
Organization.
The assignment of students into particular subsamples in relation to somatic development zones was
based on percentile charts. Students whose body height values were below 25th percentile of reference
values were classified as short, and those with body height falling into 25th and 75th percentile were
classified to be of medium height. Students whose body height values equalled or exceeded 90th
percentile were classified as tall and very tall, respectively.
Incidence of obesity was determined according to BMI. Data were analysed to determine
overweight and obesity rates, using the NAS 2001 reference data for BMI for age. BMI values between
25th and 75th percentile, between 75th and 90th percentile, over 90th percentile and over 97th
percentile indicate normal weight, above-normal weight, overweight, and obesity, respectively.
Students with BMI values under 25th percentile were not assessed separately, but were assigned to the
health weight group.
Legal guardians of participants (when children were younger than 18 years) or/and participants
(when children were older than 18 years) received a verbal description of the study procedures before
testing and completed a written informed consent that was approved by the ethical committee of Prešov
University in Prešov. Measurements were performed according to the ethical standards of the Helsinki
Declaration (Harriss & Atkinson, 2011).
Results
The trend in physical growth and development of high school youth living in Prešov region was
assessed according to growth charts by comparing data against results of VI and VII Slovak nationwide
anthropometric cross-sectional surveys conducted in 2001 and 2011, respectively, on representative
samples of both boys and girls across all age groups.
Tables 1 and 2 provide descriptive characteristics of anthropometric parameters for both genders
and their comparison with national standards of VII. nationwide anthropometric survey conducted in
2011. Mean values of body height, body weight and BMI for boys and girls across particular age
groups fell between 50th and 75th percentile, which indicates medium body height and normal body
weight. For boys, mean values of investigated parameters increased with age. The most significant
increase in body weight equalling 2.7 kg was found particularly between 17th and 18th year of life.
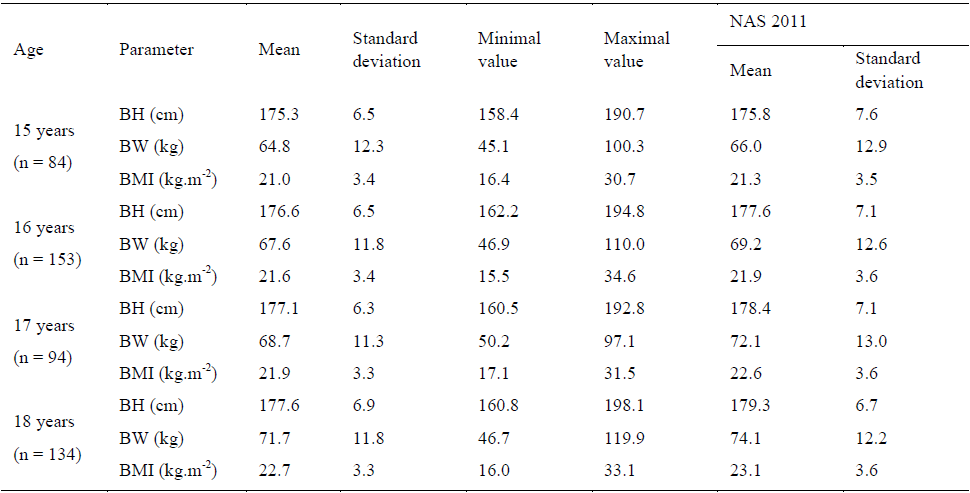
Note. n = number of participants; BH – body height; BW – body weight; BMI – body mass index; NAS 2011 – national anthropometric survey 2011
For girls, body height increased by 1.1 cm between 16th and 17th year of life, while mean values of
body weight and BMI increased with age, but at a slower rate compared to boys.
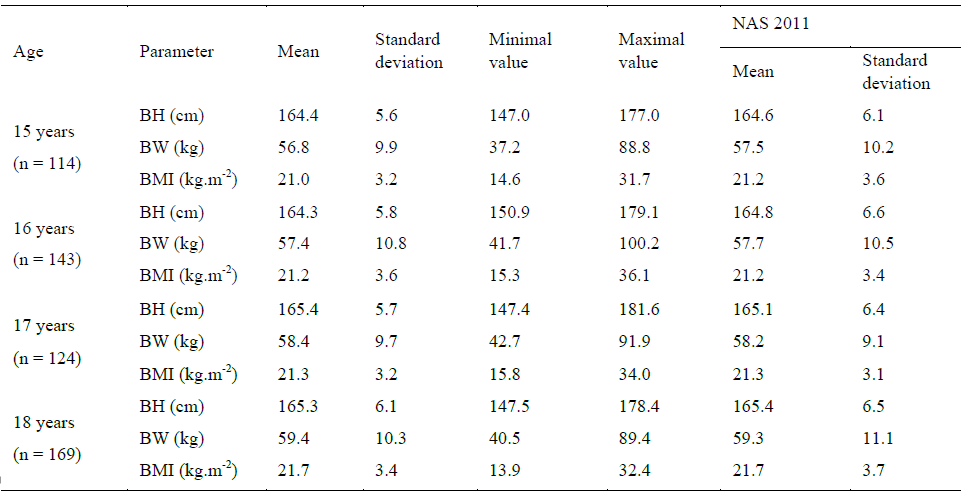
Note.n = number of participants;BH – body height; BW – body weight; BMI – body mass index; NAS 2011 – national anthropometric survey 2011
Comparison with results of VII nationwide anthropometric survey conducted in 2011 has shown
that mean values of anthropometric parameters for boys in particular age categories are lower than
reference values, while those for girls are approximately at the same level. However, mean body
weight of 15-year-old girls is lower by 0.7 kg.
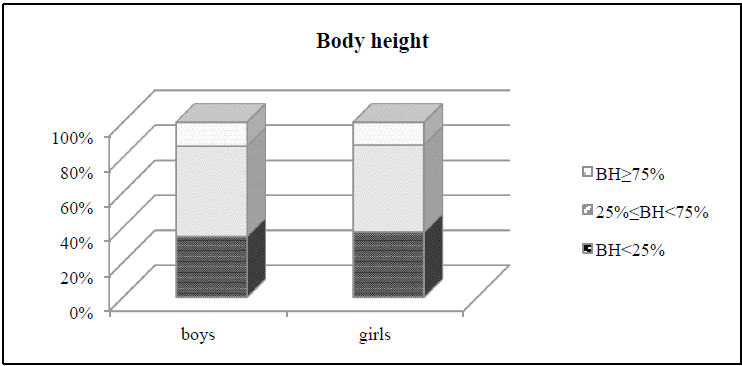
Intra-individual analysis based on using percentile charts showed that the largest number of high
school students fell into the medium body height zone (25th to 75th percentile), i.e. 51.5% of boys and
49.7% of girls (Fig. 1). Overall, 34.9% of boys and 37.4% of girls fell into the below-average body
height zone (below 25th percentile). The lowest number, 13.6% of boys and 12.9% of girls were
identified to be tall or very tall (75th to 95th percentile).
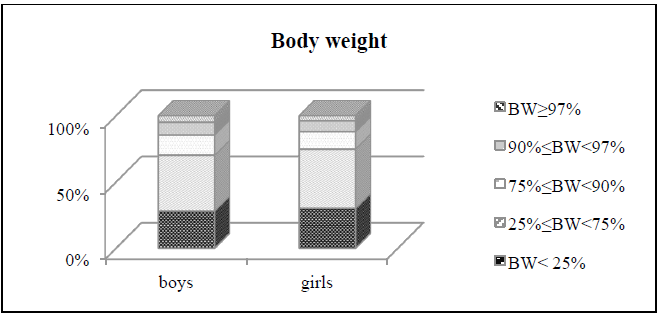
Unlike body height, which is significantly genetically determined, body weight is an unstable
somatic parameter that may be influenced particularly by physical activity and diet. Body weight
assessment of participants showed that 42.0% of boys and 44.7% of girls had normal weight (25th to
75th percentile) (Fig. 2). Further, 28.2% of boys and 30.1% of girls were classified as underweight
(below 25th percentile). Increased body weight (75th to 90th percentile), overweight (90th to 97th
percentile) and obesity (over 97th percentile), was found for 15.3% of boys and 13.1% of girls, 9.6% of
boys and 8.2% of girls, and 4.9% of boys and 3.9% of girls, respectively.
Body height and body weight are indicators which if assessed separately do not have as high
information value as a frequently used weight-height ratio expressed by BMI (Tománková,
Matejovičová, & Tatko, 2010).
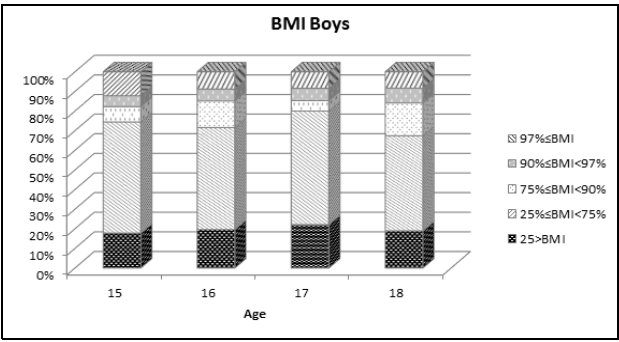
Figure 3 shows percentages for boys in particular percentile zones according to their BMI. BMI
analysis showed that approximately half of boys in each of the age categories were found to have
normal body weight (25th to 75th percentile). The highest percentage and the lowest percentage of
boys with normal weight were found for 57.9% of 17-year-olds and 48.5% of 18-year-olds,
respectively (Fig. 4). Almost one fifth of boys across all age groups fell into the underweight category
(below 25th percentile). For boys, above-normal weight (75th to 90th percentile) was found for 5.3%
of 17-year-olds, 13.5% of 16-year-olds and 16.7% of 18-year-olds. The overweight rate (between 90th
and 97th percentile) ranged from 5.6% of 15-year-olds to 7.6% of 18-year-olds. The highest obesity
rate (above 97th percentile) was found for 15-year-old boys (12.2%), while obesity rate in the
remaining age categories gradually decreased from 8.8% for 16-year-olds to 8.3% for 18-year-olds.
Overall, 6.4% and 9.4% of boys were overweight or obese, respectively. Overweight moderately
and gradually increased with age, whereas obesity rate for boys decreased. At onset of adolescence,
5.6% of 15-year-old boys were overweight and 12.2% of boys were obese. At the beginning of
adulthood, in the 18-year-olds, 7.6% of boys were overweight and 8.3% were obese.
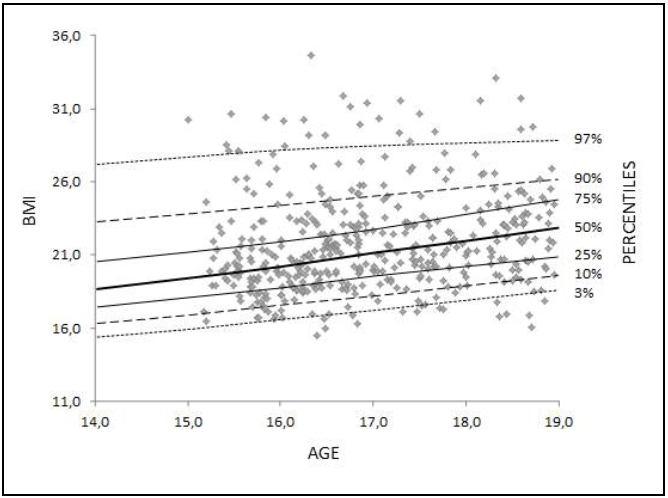
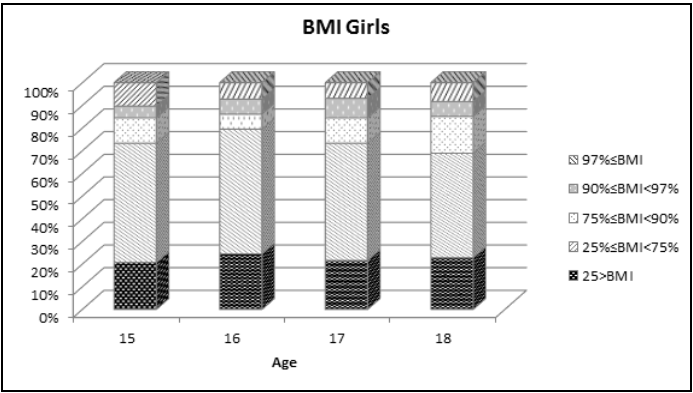
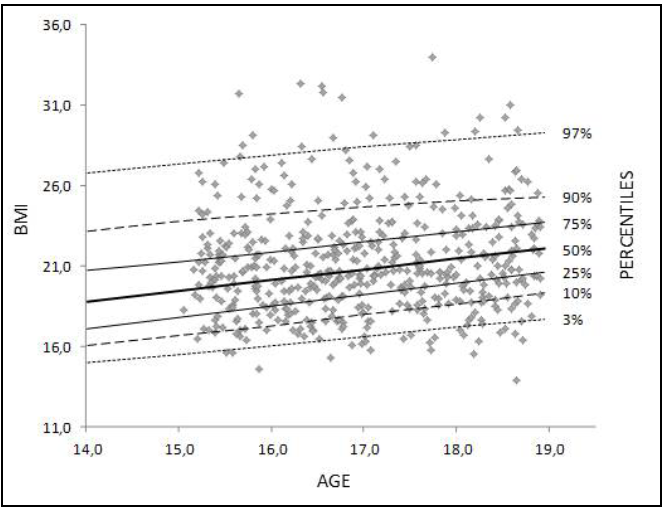
Figure 5 shows percentages for girls in particular percentile zones according to their BMI. BMI
analysis showed that approximately half of girls in each of the age categories fell into the normal
weight zone (25th to 75th percentile). The highest percentage of normal weight girls was found for
55.0% of 16-year-olds and 46.1% of 18-year-olds (Fig. 6). Underweight was found for 20.0% to 25.0%
of girls, depending on the age category. Above-normal weight was lowest for 16-year-old girls, 6.6%,
and highest incidence of above-normal weight (75th to 90th percentile) was recorded identically for
11.2% of 15- and 17-year-old girls. The largest percentage of girls with above-normal weight equalling
16.2% was found for 18-year-olds. The lowest and the highest number of overweight girls (90th to 97th
percentile) was found for 15-year-olds (5.2%) and 17-year-olds (8.6%), respectively. The highest and
the lowest obesity (above 97th percentile) percentage rate equalling 10.3% and 6.9% was found for 15-
year-old and 17-year-old girls, respectively.
Of girls, 6.8% were identified as overweight and 8.2% as obese. Unlike their male counterparts,
percentage of overweight girls increased gradually with age. The number of obese girls decreased in
15-year-olds and 17-year-olds only. At the beginning of adolescence, 5.2% of 15-year-old girls were
overweight and 10.3% of 15-year-old girls were obese. At the onset of adulthood, 6.6% and 8.4% of 18-year-old girls were overweight or obese, respectively.
Gender comparison has shown that at the onset of adulthood, at the age of 18, boys are taller by 12.3
cm and heavier by 12.3 kg than girls, and their BMI is higher by 1.0 kg.m-2 compared to that of girls.
With respect to incidence of overweight and obesity in the subsamples, higher rate of overweight was
found for 16- and 17-year-old girls, however lower obesity rate was found for 15- and 17-year-old girls
compared to their male counterparts. The largest percentage of overweight girls and boys were 17 years
old (8.6%) and 18 years old (7.6%), respectively. The highest percentages of both obese boys and girls
were found for 15-year-olds (12.2% of boys and 10.3% of girls). The lowest obesity rate was found for
8.3% of 18-year-old boys and 6.9% of 17-year-old girls. These findings have shown that obesity rate
decreases with age for both genders, whereas overweight rate increases.
Discussions and conclusions
The assessment of somatic development should take into consideration two basic anthropometric
parameters, i.e. body height and body weight, which significantly underlie somatic development. Body
height is determined by both genetic and constitution factors, however body weight manifests lower
rate of developmental stability and is affected mainly by external factors such as nutrition, physical
activity, or their relationship expressed as ratio of energy intake to energy expenditure. The comparison of data collected during VI and VII Slovak nationwide anthropometric surveys
conducted in 2001 and 2011 shows that at present the acceleration stimuli and secular trend in body
height of adolescents has stopped. Over the past decade, mean values of body height decreased for 16-
to 18-year-old boys and for 15- to 18-year-old girls. Stagnation of growth after 16th year of life has
been evident since 1991 (Ševčíková et al., 2014). Unlike body height, unfavourable trend in increasing
mean body weight for both female and male adolescents is continuing, with more significant increase
in boys. Compared to results from 2001, statistically significant increase in body weight was found for
adolescents across all age groups, except 16-year-old girls. Body weight increased by 2.9 kg to 3.9 kg
for boys and by 0.4 kg to 1.7 kg for girls. A both interesting and unfavourable finding is that at the
onset of adulthood mean values of body height increased more significantly compared to the previous
decade between 1991 and 2001. In 2001, 18-year-old boys were 0.6 kg heavier compared to their
counterparts in 1991, however boys in 2011 were 3.8 kg heavier than their counterparts in 2001.
A similar although less significant trend was found for 18-year-old girls. In 2001, 18-year-old girls
were 0.15 kg heavier compared to their counterparts in 1991, however, in 2011, their mean body
weight was 1.7 kg higher compared to that in 2001. With stagnating body height, increase in body
weight resulted in increased mean BMI values, which at present is a basic parameter used to determine
the incidence of overweight and obesity. Changes in BMI values correspond to changes in body weight
(Ševčíkováet al., 2008). During the decade between 2001 and 2011, mean BMI values increased
significantly across all age groups for both genders. In 2011, mean BMI values at the onset of
adulthood were 23.1 kg.m-2 for boys and 21.7 kg.m-2 for girls, whereas in 2001, mean BMI values for
boys and girls were 21.8 kg.m-2 and 21.0 kg.m-2, respectively. Most significant differences between
genders were found for 17- and 18-year-olds, where higher values were recorded for boys. Compared
to 2001, mean BMI value increased by 1.27 kg.m-2 for boys and by 0.64 kg.m-2 for girls. Between 1991
and 2001, mean BMI values of 13- to 18-year-old girls decreased significantly indicating slenderness,
which was not confirmed in 2011.
The analysis of BMI values from 2001 showed that of girls and boys aged 7 to 18 years, 10.2 to
14.5% of girls and 10.0% to 17.5% of boys were overweight and 5.3% to 8.9% of girls and 5.7% to
9.8% of boys were obese. However, different types of associations between overweight and obesity
and age were found for both genders. For girls, prevalence of overweight and obesity was found at
a younger age. Prevalence of overweight and obesity gradually decreased, with moderate increase at 14
years of age. These findings have revealed that, with onset of puberty and adolescence, girls begin
caring more about their looks, change their dietary habits and monitor their body weight more often.
However, for boys, the prevalence of overweight and obesity increased from 7 to 12 years of age and
then decreased up to 18 years of age. The analysis of anthropometric survey conducted in 2001 showed
that during adolescence 10.7% of girls and 11.3% of boys were overweight and 6.4% of girls and 6.7%
of boys were obese (Nováková, Kajaba, & Salkayová, 2014).
To determine trends in overweight and obesity rates of Slovak adolescents over the past few
decades, we should take into account data from 1991, which were not processed, and data from the
most recent VII nationwide anthropometric survey are not available yet. With regard to external conditions, ethnic and genetic relatedness, Slovak children are fairly similar
to children and adolescents from Czech Republic. Anthropometric survey conducted in 1991 showed
that, in each of the age categories, 7.0% of children were overweight and 3% of children were obese.
However, in 2001, the number of overweight boys and girls increased by 1.9% and by 1.5%,
respectively. The percentage of obese children in 2001 equalled 6.6% for boys and 2.6% for girls, and
compared to data from 1991, the obesity rate increased by 3.6% for boys and by 2.6% for girls,
especially in the younger age groups (Lisá et al., 2008). As reported by Hlavatá (2007), in former
Czechoslovakia 13.0% of boys and 12.0% of girls were overweight and 6.0% of boys and 5.6% of girls
were obese.
Nationwide anthropometric surveys conducted on Slovak children and adolescents at 10-year
intervals have shown that both growth acceleration and secular trend related to body height are
diminishing. The unfavourable trend showing increase in body weight of Slovak children and youth
over the past few decades, which corresponds to BMI increase, is similar to that present in other
economically developed European countries and other countries around the world. Overweight and
obesity rates in Slovak adolescents range from 10.5% to 11.5% and from 5.0% to 6.0%, respectively,
and do not reach epidemic proportions.
References
Going, S. B., Lohman, T. G., Cussler, E. C., Williams, D. P., Morrison, J. A., & Horn, P. S. (2011). Percent body fat and chronic disease risk factors in U.S. children and youth. American Journal of Preventive Medicine, 41(4), 77-86.
Harriss, D. J., & Atkinson, G. (2011). Update - Ethical standards in sport and exercise science research. International Journal of Sports Medicine, 32(11), 819-821.
Hlavatá, A. (2007). Obézne dieťa v ambulancii lekára pre deti a dorast. Pediatr Prax., S1, 12-16. Retrieved from http://www.solen.sk/index.php?page=pdf_ view&pdf_id=2939 Hlavatá, A., & Rajteková, K. (2008). Hodnotenie nadmernej hmotnosti a obezity u detí. In L. Kovács, K.
Babinská, L. Ševčíková et al., Nové trendy vo výžive detí (pp. 71-76). Bratislava: Univerzita Komenského.
Keys, A., Fidanza, F., Karvonen, M. J., Kimura, N., & Taylor, H. L. (1972). Indices of relative weight and obesity. J Chronic Disease, 25(6-7), 329-343.
Kožuchová, M., & Bašková, M. (2013). Výskyt nadhmotnosti a obezity u detí v školskom veku a adolescencii v oblasti Stredného Slovenska.Hygiena, 58(1), 11-15.
Lisá, L. (2004). Obezita v dětském věku. In V. Hainer (2004), Základy klinické obezitologie (pp. 293-301). Praha: Grada Publishing, a.s.
Lisá, L., Kytnarová, J., Stožický, F., Procházka, B., & Vignerová, J. (2008). Doporučený postup prevence a léčby dětské obesity. Retrieved from http://www.obesitas.cz/index.php?pg=doporuceni Nováková, J., Hamade, J., & Ševčíková, L. (2004). Telesný vývoj detí a mládeže v SR: Výsledky VI. celoštátneho prieskumu v roku 2001. Bratislava: UVZ SR.
Nováková, J., Kajaba, I., & Salkayová, I. (2014). Vývoj prevalencie obezity u detí a mládeže na Slovensku počas 40-tich rokov. Retrieved from http://www.jedalne.sk/sk/public/vyvoj_prevalencie.pdf Ševčíková, L., Regecová, V., Hamade, J., Janechová, H., Babjaková, J., … & Argalášová, L. (2014). Trendy v somatometrických parametroch u detí a mládeže v SR. In J. Jurkovičová & Z. Štefániková, Životné podmienky a zdravie (pp. 178-188). Bratislava: Úrad verejného zdravotníctva.
Ševčíková, L., Štefániková, Z., Jurkovičová, J., Nováková, J., Hamade, J., & Ághová, L. (2008). Výživa a telesný vývoj detí a mládeže v SR.In L. Kovács, K. Babinská, L. Ševčíková, L. et al., Nové trendy vo výžive detí (pp. 60-68). Bratislava: Univerzita Komenského.
Tománková, K., Matejovičová, B., & Tatko, T. (2010). Zmena indexu BMI v priebehu puberty športujúcich a nešportujúcich dievčat. In Zborník vedeckých prác doktorandov a mladých vedeckých pracovníkov “Mladí vedci 2010” (pp. 162-168).
Copyright information

This work is licensed under a Creative Commons Attribution-NonCommercial-NoDerivatives 4.0 International License.
About this article
Publication Date
10 June 2016
Article Doi
eBook ISBN
978-1-80296-010-5
Publisher
Future Academy
Volume
11
Print ISBN (optional)
-
Edition Number
1st Edition
Pages
1-509
Subjects
Sports, sport science, physical education
Cite this article as:
Zvonar, M., Vadasova, B., Smerecka, V., Cech, P., & Ruzbarsky, P. (2016). Overweight and Obesity in Slovak High School Students. In V. Grigore, M. Stanescu, & M. Paunescu (Eds.), Physical Education, Sport and Kinetotherapy - ICPESK 2015, vol 11. European Proceedings of Social and Behavioural Sciences (pp. 3-12). Future Academy. https://doi.org/10.15405/epsbs.2016.06.2