
The Influence of Specific Training on Explosive Power in Top Athletes


Abstract
Explosive power is an important aspect in sports events such jumping and throwing as well as in other sports like tennis, boxing, wrestling and most sports games. To clarify whether explosive muscle power depends only on the macroergic phosphate compounds or other factors, which can be influenced through specific training, are also involved, this study used a Wingate testing protocol to follow the evolution of anaerobic performance parameters in 450 top athletes trained for aerobic (70 athletes), anaerobic (224 athletes) and mixed events (156 athletes). Parameters studied were the Peak Power (PP), Time at Peak Power (TPP), correlations between them and Average Powers recorded on each 5-second interval of maximal effort. The results showed that TPP was shorter than 5 sec only for the alactacid anaerobic groups (3.630 sec for men and 3.960 sec for women), the other athletes reaching maximum power after 5 sec. Most athletes registered the highest average power in the second 5-second interval (5-10 sec) and not in the first one (0-5 sec), as expected, except for the alactacid anaerobic group. The anaerobic alactacid and mixed energogenesis groups achieved a significant negative correlation between PP and TPP (p< 0.05), these groups being composed of athletes whose specific training aimed to improve their neuro-motor skills and movement pattern. The results of this research show that explosive power depends on the muscle composition, but also confirms the importance of motor skills in improving the recruitment velocity of fast muscle fibres and muscle power generation.
Keywords: Explosive power, Peak Power, Time at Peak Power, training
Introduction
Muscular power is an important aspect in most sports events. Power is the product of force and
velocity, and this relationship suggests that the factors that influence muscular force (muscle cross-
sectional area, proportion of fast-twitch fibres; initial fibre lengths) also affect the muscle capacity to
generate power (McArdle, Katch, & Katch, 2004). Muscle power is the explosive aspect of force
(Brukner & Kahn, 2012), but it is important to notice that it also has, in its turn, three aspects: the peak
power (maximal amplitude of power), explosive power (rate of maximal power development) and
power endurance (the period of time in which maximal power can be maintained). A running event, for
instance, is not won by the athlete who develops the greatest power at one time (maximal power
aspect), but by the athlete who is able to develop andas much power as possible over the
whole period of running (power endurance aspect). However, during those athletic events similar to
jumpingandthrowing, when the athlete’s body or various objects are propelled like a projectile, the
ability to generate maximal power over a very short period of time (explosive power aspect) is
significant for performance.
The Monark cycloergometer software, used in the Wingate testing (Inbar, Bar-Or, & Skinner, 1996),
displays graphically the curve of powers developed by the athletes over a 30-second period, but also
average values of this parameter over 5 sec intervals. The Peak Power parameter is represented by the
greatest value of the average power recorded in any 5 sec interval. Theoretically, the greatest muscular
power should be recorded in the first 5 sec interval, since it relies upon highenergyphosphate
compounds, but it is important to verify this aspect in order to emphasize the involvement of other
factors upon the rate of maximal power development. For some events like throwing and jumping, not
only the value of maximal power is important, but also the moment when it is generated.
Materials and methods
In order to clarify whether the explosive aspect of muscular power mainly depends on energogenic
capacity of highenergyphosphatecompounds or some other factors, such as neuromuscular factors,
are also involved, this study followed the results obtained in testing the anaerobic exercise capacity of
450 top athletes, specifically trained for aerobic, anaerobic and mixed events, through a slightly
modified Wingate protocol. The parameters specific to Wingate testing, such as the Peak Power (PP),
Fatigue Index (FI), Average Power (AP), but also other parameters that are included in the Monark
cycloergometer software used in the testing process, but are not incorporated in the classical Wingate
protocol, have been followed: the Average Powers on each 5 sec testing interval, Average Power on a
45 sec interval (AP45”) and Time at Peak Power (TPP).
were represented by a total of 450 top athletes, components of Romania’s National and
Olympic Teams, men and women, aged between 18-28 years.
70 athletes participating in aerobic events (great endurance events: marathon and race walking) out of whom 35 women (aerobic women’s group) and 35 men (aerobic men’s group).
162 athletes participating in (very short-lived events: throwing, jumping, 100 m dash). The women’s group was made up of 85 female athletes (alactacid anaerobic women’s group), while the men’s group of 77 male athletes (alactacid anaerobic men’s group).
62 athletes also participating in, but with an important component (400 m dash and 400 m hurdles runners). The women’s group included
31 female athletes (lactacid anaerobic women’s group), while the men’s group included 31 male
athletes (lactacid anaerobic men’s group).
156 athletes participating in, aerobic and anaerobic (800 m and 1500 m runs, football and handball). The women’s group included 64 female athletes (mixed energogenic women’s group), while the men’s group, 92 (mixed energogenic men’s group).
The athletes were tested using a modified Wingate protocol, in which duration of maximal effort was extended to 45 seconds in order to observe more aspects of tolerance to acidosis. The athletes trained for very short sport events (anaerobic alactacid groups, male and female) were tested only for 10 seconds of maximal effort. The cycloergometer we used to test maximal effort, a Monark 894-E from Sweden, was connected to a computer that runs software supplied by the producer - (Sports Medicine Industries, Inc. (SMI) (St. Cloud, MN) (Power software). Resistance applied to cycloergometer was calculated in terms of each subject weight (kg x 7.5%).
For each subject, the absolute values of Peak Power (PP), Average Power (AP), Fatigue Index (FI), Time at Peak Power (TPP) were recorded. The statistical analysis was performed using the statistical analysis mode of the Microsoft Excel software and included average values, standard deviations and value intervals for the collected parameters. The comparison between the levels of these parameters for each individual group was carried out by using the Student test. Correlations between parameters were assessed using the Pearson correlation method, while the level of significance was considered p< 0.05.
Results
Expressed as a relative value, that is W/kg, had the following values for the studied
groups: aerobic events (women) 7.21 ± 0.94, aerobic events (men) 7.93 ± 1.69, mixed energogenic
events (women) 7.75 ± 1.21, mixed energogenic events (men) 9.61 ± 1.57, lactacidanaerobic events
(women) 8 ± 1 and 10.13 ± 1.68 (men), alactacid anaerobic events (women) 8.93 ± 1.48 and 11.57 ±
1.96 (men). The results show that the athletes trained for alactacid anaerobic events have the best
values, followed by the athletes trained for lactacid anaerobic and mixed energogenic events, and then
by those participating in aerobic events, who had the lowest values of this parameter.
over 30 sec, a parameter recommended by the Wingate testing protocol, also
displays the same trend as the Peak Power - it increases as a particular event requires a greater
anaerobic metabolism and a lower aerobic metabolism: lactacid anaerobic groups 7.96 ± 0.94 w/kg for
men and 6.58 ± 0.85 w/kg for women, mixed energogenic groups 7.55 ± 0.86 w/kg for men and 6.2 ±
0.88 w/kg for women, aerobic groups 7.23 ± 0.69 w/kg for men and 5.71 ± 0.79 for women. The
Average Power was also calculated over the whole 45 sec period of maximal effort and presented the
same increasing profile as the Average Power over the 30 sec, paralleling the involvement of the
anaerobic mechanisms in the energy production of the studied athletic events, although the recorded
values were lower, as it was expected: lactacid anaerobic groups 7.59 ± 0.79 w/kg for men and 6.37 ±
0.77 for women, mixed energogenic groups 7.2 ± 0.71 w/kg for men and 5.92 ± 0.77 w/kg for women,
aerobic groups 6.71 ± 0.68 w/kg for men and 5.71 ± 0.79 w/kg for women. The Average Powers over
30 sec and respectively 45 sec were not determined for alactacid anaerobic groups of athletes, since
they performed a maximal testing for a period of only 10 sec.
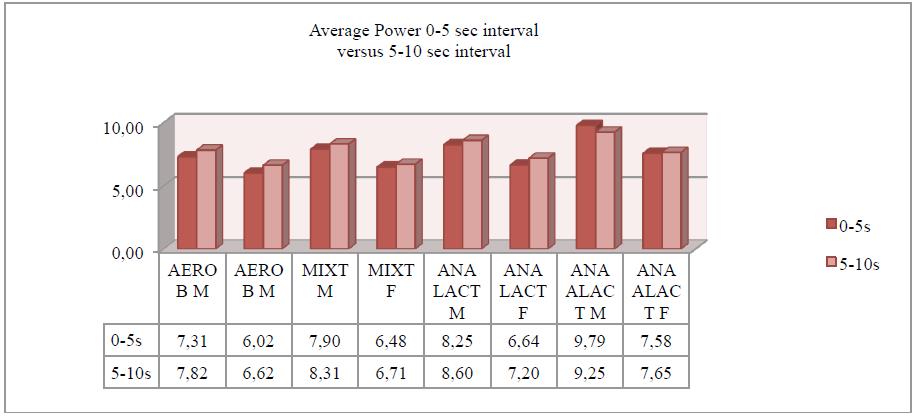
The Monark cycloergometer software displays both a graphical representation of power during
testing as well as the numerical values for the from
the beginning up to the end of testing. From the cumulative analysis of all testing performed in this
study, it followed that it was the second 5 sec interval in which the greatest value of power was
recorded and not the first one, as it was expected, with the exception of the alactacid anaerobic men’s
group, which was characterized by higher values of average power in the first 5-second interval when
compared to the next 5-second interval (Fig. 1).
was also, on the average, over 5 seconds in all tested groups,
(lactacid anaerobic groups 5.92 sec for men and 8.59 sec for women, mixed energogenic groups 6.96
sec for men and 6.41 sec for women, aerobic groups 5.35 sec for men and 6.94 sec for women), with
the exception of alactacid anaerobic men’s and women’s groups (3.63 sec for men and 3.96 sec for
women), which supports the idea that in most cases the peak power is not achieved in the first 5 sec of
the maximal effort. We mention that this parameter measures in milliseconds the time elapsed from the
beginning of the effort and the moment when the muscle power curve generated by athlete reaches the
highest point.
The correlation between the value of the Peak Power and Time at PeakPower showed that, for the
groups with mixed and alactacid anaerobic energogenesis, the great values of the Peak Power (PP)
correlated with a smaller duration of the time necessary to develop the Peak Power (the correlation
coefficients were -0.36 cu p = 0 in men and -0.34 cu p = 0 in women) in mixed energogenesis events
and respectively (-0.25 cu p = 0.03 in men and -0.27 cu p = 0.04 in women) in alactacid anaerobic
events. For the other groups, correlations were not significant.
is considered an indicator of muscle fatigue. The
values attained by this parameter (expressed as percentage of the peak power) were: lactacid anaerobic
groups 53.46 ± 15.46 % for men and 48.05 ± 10.56 for women, mixed energogenesis groups 53.25 ±
14.26% for men and 50.35 ± 11.37 for women, aerobic groups 53.53 ± 13.8 % for men and 44.6 ±
12.56 for women. The Power Decline was calculated only for 10 seconds in those subjects who
participated in alactacid anaerobic events (male and female) and had values of 31.28 and 33.68%.
Discussions and conclusions
Skeletal muscle is a heterogeneous tissue composed of a large variety of fibre types. The
classification of fibres provides information about functional characteristics as strength, power and
fatigue resistance (Bottinelli, 2001; Malisoux, Francaux, & Theisen, 2007).Training produces adaptive
responsiveness and even a fibre-type transition (Armstrong, Welsman, & Chia, 2001; Brandon &
Boileau, 1987; Brodal, Ingjer, & Hermansen, 1977; Brooke & Engel, 1969; Brooks, Fahey, & Baldwin,
2005; Hakkinen et al., 1998; Pette & Staron, 1997). The strictly glycolytic fibres (FG) contract faster
than the mixed (FOG – glycolytic and oxidative fast fibres) or slow oxidative ones (SO – slow
oxidative fibres), and the generated power is greater (MacIntosh, Gardiner, & McComas, 2006;
Buchthal & Schmalbruch, 1970). The individuals with fatigue in high-intensity exercise are
characterized by a shift in the EMG power spectrum of the muscle involved, indicating selective
fatigue of fast-twitch fibres (Kupa et al., 1995; Billaut et al., 2006; Bogdanis, 2012).
The results of this study show that the athletes trained for alactacid anaerobic events have the best
values for Peak Power, followed by the athletes trained for lactacid anaerobic and mixed energogenic
events, and then by those participating in aerobic events, who had the lowest values of this parameter.
The Peak Power, Average Power and Fatigue Index parameters obtained in this study are similar to
other authors’ results (Maud & Shultz, 1989; Zupan et al., 2009). But the comparative analysis of the
average power values on each 5 sec interval of the maximal effort in all athlete groups showed that the
alactacid anaerobic men’s groups were the only groups in which the average power developed in the
first 5 sec of effort, exceeding the one developed in the next 5 sec interval. This result supports the idea
that the specific training has produced in these athletes a proportion of fast-twitch fibres (probably the
strict glycolytic fast fibres – FG) (Pette & Staron, 2000; Staron & Johnson, 1993) superior to all the
other athletes, including those trained for lactacid anaerobic efforts. However, for the other groups, the
peak of anaerobic power was recorded in the second 5 sec interval. This observation suggests the fact
that in the athletes trained for aerobic and mixed efforts, but also for longer anaerobic efforts, with an
important lactacid component, the fibres that have an important contribution to generating anaerobic
muscle power are also the fibres that have glycolytic content, but are slower and more resistant to
fatigue (probably FOG) than those exclusively developed through alactacid anaerobic training (FG).
If the development of the anaerobic peak power depended only on the highenergyphosphate
compounds availability and the proportion of fast glycolytic fibres, we should find a significant
negative correlation between the Peak Power (PP) and the Time at Peak Power (TPP) in the groups of
athletes whose performance implies an increased percentage of fast glycolytic fibres (alactacid
anaerobic groups). In this study, we found significantly negative correlations between the Time at Peak
Power and the Peak Power in the alactacid anaerobic groups, but also in those with mixed
energogenesis. The common factor that characterizes the process of training for both the alactacid
anaerobic events (the studied group being mostly made up of athletes participating in throwing and
jumping events) and the sports games and 400 m hurdles event (the mixed energogenic group including
mostly this type of athletes) is represented by exercises similar to jumping and throwing, which
facilitate the recruitment velocity of muscle fibres by the neuronal factors. Many authors claim that the
explosive power is influenced in a more than significant proportion by the degree and modality in
which muscle fibres are recruited by the neuronal factors (Clamann, 1993; McArdle, Katch, & Katch,
2007). In this study, the groups that obtained a significant negative correlation between PP and TPP
were made up of athletes for whom the neuromotor skills and pattern of movement are especially
important for performance, and their improvement by specific training can be an explanation for the
results obtained. It is obvious that the elapsed time from the beginning of effort up to the attainment of
the peak power depends on how fast the power-generating fibres contract, that is on the fibre type, but
also the neuromuscular factors like the recruitment velocity of muscle fibres by motoneurons and the
recruitment pattern that exert an important influence over the moment when the peak power is
generated.
We recommend that for the sports events similar to jumping, throwing, etc., that is when the
explosive aspect of the anaerobic muscle power matters significantly for performance, the preferred
testing parameter should be the Peak Power. However, it is indicated that its values should be
corroborated with the Time at Peak Power, because the information regarding the moment when
musculature generates the peak power may constitute a feedback for the training of neuromuscular
factors.
References
Armstrong, N., Welsman, J., & Chia, M. (2001). Short term power output in relation to growth and
maturation. Br J Sports Med., 35(2), 118-124.
Billaut, F., Basset, F. A., Giacomoni, M., Lemaître, F., Tricot, V., & Falgairette, G. (2006). Effect of high-
intensity intermittent cycling sprints on neuromuscular activity. Int J Sports Med., 27(1), 25-30.
Bogdanis, G. C. (2012). Effects of physical activity and inactivity on muscle fatigue. Front Physiol., 3.
doi: 10.3389/fphys.2012.00142.
Bottinelli, R. (2001). Functional heterogeneity of mammalian single muscle fibres: Do myosin isoforms tell
the whole story? Pflugers Arch., 443(1), 6-17.
Brandon, L. J., & Boileau, K. A. (1987). The contribution of selected variables to middle and long distance
run performance. J Sports Med., 27(2), 157-164.
Brodal, P., Ingjer, F., & Hermansen, L. (1977). Capillary supply of skeletal muscle fibers in untrained and
endurance trained men. Am J Physiol., 232(6), H705-H712.
Brooke, M. H., & Engel, W. K. (1969). The histographic analysis of human muscle biopsies with regard to
fibre types: 1. Adult male and female. Neurology, 19(3), 221-233.
Brooks, G. A., Fahey, T. D., & Baldwin, K. M. (2005). Exercise Physiology: Human Bioenergetics and Its
Application (4th ed.). McGraw-Hill Higher Education.
Brukner, P., & Khan, K. (2012). Clinical Sports Medicine (4th ed.). McGraw-Hill Medicine.
Buchthal, F., & Schmalbruch, H. (1970). Contraction times and fibre types in intact human muscle. Acta Physiol Scand., 79(4), 435-452.
Clamann, H. P. (1993). Motor unit recruitment and the gradation of muscle force. Phys Ther., 73(12), 830-843.
Hakkinen, K., Newton, R. U., Gordon, S. E., McCormic, M., Volek, J. S., … & Kraemer, W. J. (1998).
Changes in muscle morphology, electromyographic activity and force production characteristics during progressive strength training in young and older men. J Gerontol A Biol Sci Med Sci., 53(6), B415-B423. Inbar, O., Bar-Or, O., & Skinner, J. S. (1996). The Wingate Anaerobic Test. Champaign, IL: Human Kinetics.
Kupa, E. J., Roy, S. H., Kandarian, S. C., & De Luca, C. J. (1995). Effects of muscle fibre type and size on
EMG median frequency and conduction velocity. J Appl Physiol., 79(1), 23-32.
MacIntosh, B., Gardiner, P., & McComas, A. (2006). Skeletal Muscle: Form and Function. Champaign, IL:
Human Kinetics.
Malisoux, L., Francaux, M., & Theisen, D. (2007). What do single-fibre studies tell us about exercise
training? Med Sci Sports Exerc., 39(7), 1051-1060.
Maud, P. J., & Shultz, B. B. (1989). Norms for the Wingate Anaerobic Test with comparison to another
similar test. Res Q Exerc Sport, 60(2), 144-151.
McArdle, W. D., Katch, F. I., & Katch, V. L. (2004). Essentials of Exercise Physiology (2nd ed.). New York:
Lippincott Williams and Wilkins.
McArdle, W. D., Katch, F. I., & Katch, V. L. (2007). Exercise Physiology: Energy, Nutrition and Human
Performance (6th ed.). Philadelphia, PA: Lippincott Williams and Wilkins.
Pette, D., & Staron, R. S. (1997). Mammalian skeletal muscle fiber type transitions. Int Rev Cytol., 170, 143-
223.
Pette, D., & Staron, R. S. (2000). Myosin isoforms, muscle fiber types and transitions. Microsc Res Tech.,
50(6), 500-509.
Staron, R. S., & Johnson, P. (1993). Myosin polymorphism and differential expression in adult human
skeletal muscle. Comp Biochem Physiol B, 106(3), 463-475.
Zupan, M. F., Arara, A. W., Dawson, L. H., Wile, A. L., Payn, T. L., & Hannon, M. E. (2009). Wingate anaerobic test peak power and anaerobic capacity classifications for men and women intercollegiate athletes. J Strength Cond Res., 23(9), 2598-2604. doi: 10.1519/JSC.0b013e3181b1b21b.
Copyright information

This work is licensed under a Creative Commons Attribution-NonCommercial-NoDerivatives 4.0 International License.
About this article
Publication Date
10 June 2016
Article Doi
eBook ISBN
978-1-80296-010-5
Publisher
Future Academy
Volume
11
Print ISBN (optional)
-
Edition Number
1st Edition
Pages
1-509
Subjects
Sports, sport science, physical education
Cite this article as:
Caramoci, A., Ionescu, A. M., Nica, A. S., & Mazilu, V. (2016). The Influence of Specific Training on Explosive Power in Top Athletes. In V. Grigore, M. Stanescu, & M. Paunescu (Eds.), Physical Education, Sport and Kinetotherapy - ICPESK 2015, vol 11. European Proceedings of Social and Behavioural Sciences (pp. 121-127). Future Academy. https://doi.org/10.15405/epsbs.2016.06.17