
Measuring Deficiencies in Nonprofit Management


Abstract
The need to measure the performance of nonprofit boards has been recognised for over 30 years primarily because of the direct relationship between board performance and organisation performance but also because identifying management strengths and weaknesses across a range of performance factors forms the basis for an effective management development programme. The results of past studies are generally inconclusive leading to a lack of consensus as to which is the best approach. The objective for this study was to demonstrate that a heuristic methodology does produce an acceptable, approximate solution to the measurement of individual management performance in a nonprofit board. Testing established that the heuristic model produced a satisfactory solution and was able to provide a detailed assessment of management strengths and weaknesses across a wide range of factors. Analysis of the results obtained from a sample of nonprofit board members provided clear evidence that management skills, management experience, relevant knowledge and commitment are key competencies for nonprofit board members. A direct, positive relationship between age and management performance was also identified.
Keywords: Management deficiency, Nonprofit board, Heuristic model
Introduction
For nonprofit organisations (NPOs), research has established that there is a positive relationship between board performance and organisational performance (McDonagh 2006; Nicholson, Newton and McGregor-Lowndes 2012; Willems, Huybrechts, Jegers, Weijters, Vantibborgh, Didee and Pepermans 2012). The implication of this finding is that improving the performance of the board will lead to improvement in the performance of the organisation but to improve their performance, nonprofit management teams need actionable information that will enable them to identify their strengths and weaknesses (McDonagh 2006; Nicholson, Newton and McGregor-Lowndes 2012). There have been many attempts over the past 40 years to develop a technique that can provide a solution to the problem of measuring nonprofit management performance but the results are generally inconclusive leading to a lack of consensus as to which is the best approach (Herman 1990; Moxham 2010; Taysir and Taysir 2012). There is no agreement on the factors associated with management performance (Alexander, Hearld and Mittler 2011) and there is no consensus that one performance measurement model is better than another. Current techniques produce results that have not been rigorously tested to validate the reliability of their measurement of performance (Heiberg and Bruno-van Vijfeijken 2009; Herman and Renz 2002) and the findings from one study sometimes do not support the findings of another study (Barnard and Lesirge 2012; Bhardwaj and Vuyyuri 2005; Cornforth 2012; Holland, Chait and Taylor 1989; Ostrower and Stone 2010). There is also a positivist orientation evident in the current approach (Cornforth 2012), looking at how well the board as a whole carries out their responsibilities. The result is a lack of focus on management weaknesses and individual board member competencies. However, there is agreement that the problem is complex and a large number of factors have been identified as being associated with nonprofit management performance.
Problem Statement
Researchers have been trying to develop a technique for measuring management performance in a nonprofit organisation for more than 30 years. Traditional, analytical techniques have failed to find a solution that has broad acceptance.
Research Questions
Does heuristic methodology provide an acceptable, approximate solution to the measurement of management deficiency in a nonprofit organisation?
Purpose of the Study
The purpose of this study was to identify the factors that contribute to management performance in an NPO and measure the level of deficiency in those factors using a heuristic methodology. The objective was to build a heuristic model that will measure individual management deficiency and produce an assessment of management strengths and weaknesses for the board members of nonprofit organisations.
Research Methods
It has been established that, in a situation where a problem involves a large number of variables with the relationship between them unknown and no solution can be found by traditional methods, a heuristic approach may provide an acceptable, approximate solution (Gilli and Schumann 2012; Satoglu, Durmusoglu and Ertay 2010; Tempelmeier and Buschkuhl 2009). This situation can be applied directly to the present state of research into the measurement of nonprofit management performance. Therefore it was logical to adopt a heuristic approach to find a solution to this long standing problem.
NPO management performance has a number of dimensions so it was necessary to decide which dimension should be measured. The evidence suggests that most NPO failures are the result of inexperienced, weak management (Productivity Commission 2010). In other words, management deficiencies are the primary cause of NPO failures. It was noted in the introduction that nonprofit management teams need actionable information that will enable them to identify their strengths and weaknesses (McDonagh 2006; Nicholson, Newton and McGregor-Lowndes 2012). For NPOs, these findings place a measure of importance on identifying management deficiencies and working to address those weaknesses. Consideration of the points raised above led to two conclusions. Firstly, the focus should be on management deficiency as the ability to measure that dimension of management performance would provide the greatest benefit to NPO management teams. Secondly, the
actionable information needed to address management deficiencies requires a focus on individual board member competencies and personal attributes.
5.1. Identifying Factors Associated with Nonprofit Management Performance
A review of the literature and interviews with NPO board members led to the identification of seven main responsibilities of a board:
1.Achieve the objectives set out in the mission statement (Alexander, Hearld and Mittler 2011; Bagnoli and Megali 2011; Epstein and McFarlan 2011; Forbes 1998; Herman and Renz 2002; Mwenja and Lewis 2009; Sawhill and Williamson 2001).
2.Oversee financial control (Epstein and McFarlan 2011; Forbes 1998; Green and Griesinger 1996; Harrison and Sexton 2004; Langabeer and Galeener 2007; Productivity Commission 2010; Taysir and Taysir 2012; Tucker 2010).
3.Income generation (Forbes 1998; Harrison and Sexton 2004; Productivity Commission 2010; Tucker 2010; Tucker and Parker 2013).
4.Communication(Bhardwaj and Vuyyuri 2005; Doherty and Hoye 2011; Widmer 1993).
5.Strategic planning (Bhardwaj and Vuyyuri 2005; Brown 2005; Brown and Iverson 2004; Forbes 1998; Green and Griesinger 1996; Herman and Renz 2002; Jackson and Holland 1998; Langabeer and Galeener 2007; Tucker and Parker 2013; Willems, Huybrechts, Jegers, Weijters, Vantibborgh, Didee and Pepermans 2012). 6.Meet legal obligations(Productivity Commission 2010).
7.Oversee asset management.
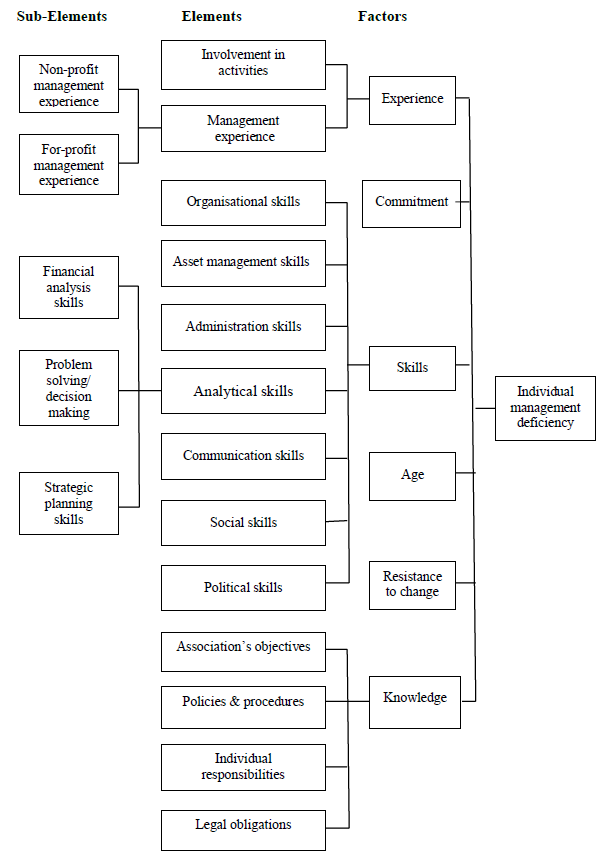
Having identified the main areas of responsibility for an NPO board, it was then possible to identify the competencies and personal attributes, collectively referred to as factors, required by the individual board members to carry out these responsibilities. Three main competencies were identified:
1.Management skills (Cornforth 2001; Forbes 1998; Green and Griesinger 1996; Langabeer and Galeener 2007; McDonagh 2006; Nicholson, Newton and McGregor-Lowndes 2012; Parker 2007; Schjoedt and Kraus 2009; Thach and Thompson 2007; Tucker and Parker 2013; Willems, Huybrechts, Jegers, Weijters, Vantibborgh, Didee and Pepermans 2012).
2.Management experience (Brown 2007; Nafukho 2007; Schjoedt and Kraus 2009; Thach and Thompson 2007).
3.Relevant knowledge (Brown 2007; Nafukho 2007; Schjoedt and Kraus 2009; Thach and Thompson 2007).
In addition to these competencies three personal attributes were identified:
1.Commitment to the organisation (Allen and Meyer 1996; Cornforth 2001; Doherty and Hoye 2011; Preston and Brown 2004).
2.Age (Glisky 2007).
3.Resistance to change (Block 2004; Griesmann 2012; Jewell 2013; Taysir and Taysir 2012).
The review of the literature found no references in the nonprofit literature to studies which investigated the effect of aging on an individual’s ability to perform management functions. However, medical literature supports the view that higher order cognitive functions, such as decision making and problem solving, may be affected by age (Glisky 2007). This finding has implications for the competency of elderly board members. Resistance to change, which is also referred to as “iced innovation”, has recently been identified as a cause of NPO failures (Griesmann 2012; Jewell 2013).
A review of the relevant literature led to the identification of a framework of elements and sub-elements associated with the six primary factors. This framework determined the structure of the heuristic model which is illustrated in Figure 1.
5.2. Quantifying the Factors
Techniques for quantifying the identified factors were developed using subjective, qualitative techniques based on findings in the literature. A self-administered survey was used to collect the data required to quantify the factors. For most factors the level of deficiency was measured by formulating one or more questions which were designed to measure some aspect of the factor. A 5 point Likert-type scale ranging from 0 to 4 was used to record responses which were divided by the maximum possible response of 4 to produce a deficiency ratio lying between 0 and 1. Throughout the heuristic model development process whenever deficiency ratios were aggregated the average was taken to return to a range of 0 to 1.
5.3. Building the Heuristic Model
There are many general heuristic modelling techniques available. The one selected as being most suitable for this study was the technique known as simulated annealing (Kirkpatrick, Gelatt and Vecchi 1983). To apply this technique, assumptions are made to simplify a complex problem so that a model can be developed that will provide an initial solution. From the initial solution, small refinements are made to the model to produce new solutions which are plotted to determine the direction in which they are heading. If the new solution is better than the previous one it is accepted and the process continues. If a new solution is worse, it is not immediately rejected as a local maximum or minimum may have been encountered. The process usually continues until the plotted solution path indicates that the model has reached an optimal state.
The heuristic model development process began by developing an initial form of the model from which an initial solution could be obtained. It was assumed that the dependent variable, individual management deficiency, is a function of the independent variables, which are the identified factors. The relationship between the independent variables is not known, therefore a possible relationship needed to be selected for the initial form of the model. Heuristic methodology seeks to simplify a complex problem as much as possible so that a feasible, initial solution can be found. Therefore complex, higher order relationships were not considered.
Instead it was assumed that an additive or linear functional relationship exists between the independent variables. With an assumption of linearity the individual management deficiency equation can be written as:
d = α! + α!f! + α!f! + α!f! + α!f! + α!f! + α!f! where
d = individual management deficiency
f! = skills factor f! = experience factor f! = knowledge factor
f! = commitment factor f! = age factor f! = resistance to change factor
α! is a constant α! = factor coefficients ( i = 1, 2, ...6)
The constant term, α! , represents the survey response bias error for the respondent. When data is
collected using a self-administered survey, response bias is a legitimate aspect of the variable being measured (Paulhus 1991). Therefore, the level of response bias needed to be estimated and an adjustment made to the results obtained to compensate for its effect. As the data required to estimate response bias was not available until a later stage in the model development process, the constant term, α!, remained unknown for the initial form of the model. The coefficients, α! , of each independent variable are also unknown but if each factor is equally important in determining the level of individual management deficiency then the coefficients of the independent variables would be 1. Under this assumption the initial form of the individual management deficiency equation became:
d = α! + 1 6 (f! + f! + f! + f! + f! + f!)
A similar approach was adopted for defining the initial relationship between the factors and their
elements and between the elements and their sub-elements, where appropriate, according the model structure
illustrated in Figure 1. The overall measurement of management deficiency for the board, D, was defined to be the average of the individual management deficiency measurements, d. That is:
where n = the number of board members
5.4. Obtaining an Initial Solution
Having made a number of assumptions to simplify the problem and develop an initial form for the model, the next step in the simulated annealing process was to obtain an initial solution. A pilot study was conducted to collect data from a sample of six board members of an NPO. The data was entered into a data analysis spreadsheet which was designed to convert the initial responses into deficiency ratios and enter the ratios into the model’s equations. For each board member, the model produced measurements of deficiency in each factor. It then calculated the level of management deficiency for each board member and the board.
For the results produced by the model to be meaningful they must lie within the expected range from 0 to 1 or 0% to 100% deficiency. For the results to be acceptable they should not be extreme (all lying close to the extremities of the range of possible values) and variation in individual deficiency ratios should be evident. The initial form of the model produced individual deficiency measurements ranging from 21% to 50%. Following the definitions above, the results obtained were meaningful and acceptable in terms of their absolute value and range. They also demonstrated that the model, even in its initial form, was able to differentiate between the level of deficiency in individual competencies and personal attributes of the board members. The full set of results demonstrated that the model does provide an assessment of individual board member strengths and weaknesses across a wide range of factors. Therefore, it was established that the model produced a satisfactory initial solution.
5.5. Refining the Model
The simulated annealing process required small refinements to be made to the heuristic model and the new solutions tracked to determine the direction in which they were heading. The first refinement was to estimate the level of survey response bias.
Paulhus (1991) claimed that an estimate of response bias can be obtained by establishing the distribution of the raw scores obtained from a sample and comparing this distribution with the expected distribution of the population. This approach was adopted to obtain an initial estimate of survey response bias. The population of individual deficiency measurements was assumed to have a mean of 50% deficiency or 0.5. Effectively, the assumption being made here is that an average NPO board member is equally balanced between being deficient in some personal attributes and areas of competency and efficient in other areas. This mean was compared with the mean of the individual deficiency measurements derived from the sample used in the pilot test. Using the sample mean as an estimate of the population mean, the difference between the two means would represent an estimate of the level of survey response bias as illustrated below:
Sample mean = 0.351.
Estimate of the population mean = 0.5
Estimated Survey Response Bias = 0.5 – 0.351
= 0.149
As this result is a preliminary estimate based on a small sample, the result was rounded down to 0.1. The
equation for individual management deficiency became:
d = 0.1 + 1 6 (f! + f! + f! + f! + f! + f!)
where d = individual management deficiency and f! are the factors
Estimating survey response bias represented the first refinement to the heuristic model and the start of the
simulated annealing solution tracking process.
In the initial form of the model the coefficients of each independent variable in the set of equations that comprise the model were assumed to be 1. Taking each of the model’s equations in turn, the literature was searched for research findings that enabled the independent variables to be ranked in order of their importance in determining the value of the dependent variable. The independent variables were then given weights according to the reverse order of their ranking (Nooriafshar and Vibert 2012). The weighting process is illustrated in Table1.
The weights allocated to the six factors became estimates of their coefficients in the individual management deficiency equation. The model was then refined to include these coefficients and the equation for individual management deficiency became:
d = 0.1 + 1 21 ( 6f! + 5f! + 3.5f! + 3.5f! + 1.5 f! + 1.5f! ) or
d = 0.1 + 0.286 f! + 0.238 f! + 0.167 f! + 0.167 f! + 0.071 f! + 0.071 f!
The same refinement process outlined above was applied to each of the model’s equations in turn which represented in total a series of seven refinements carried out on the model.
Following the simulated annealing process, each refinement to the model generated a new solution to the measurement of management deficiency for the board which was tracked to determine whether the new solutions were following a path. The solution path for overall board management deficiency that resulted from the seven refinements to the model is illustrated in Figure 2.
It was evident from Figure 2 that the new solutions obtained from refinements to the model had followed a clear
solution path and the model had reached an optimal state.
As this study represented a new field for the application of simulated annealing heuristic methodology there was no established procedure to follow for validating the results. A new procedure was developed which attempted to establish that there was an alignment of the model results with an assessment of individual management deficiency obtained by a management performance rating technique. The data required for the model validation was collected from the board members of a random sample of 15 NPOs run entirely by volunteers from whom 50 completed surveys were returned. Each survey had two sections. The first section collected the data required for the heuristic model. The second section collected the individual performance ratings data for the members of that board. In this second section, each respondent was asked to rate the overall management performance of the other board members and themselves on an 11 point Likert-type scale from 0 to 10 where 0 represented “extremely poor performance in all areas” and 10 represented “extremely good performance in all areas”. For each board member an average management performance rating was calculated from the individual ratings which were then converted into deficiency ratios using the process illustrated below:
Rating deficiency ratio = 1 - ( average performance rating ÷ 10 )
For example, if a respondent received an average performance rating of 6.25, their rating deficiency ratio would be given by:
Rating deficiency ratio = 1 - ( 6.25 ÷ 10 )
= 0.375 or 37.5%
Paired observations were obtained from the sample of 50 respondents which consisted of a model individual management deficiency ratio and a rating individual management deficiency ratio. The paired observations were subjected to two forms of statistical analysis.
The t-test was used to test the significance of the difference between the mean of the individual management deficiency ratios produced by the heuristic model and the mean of the ratios produced by the individual performance ratings. Letting µμ! and µμ! be the means of the individual management deficiency ratios determined by the heuristic model and the performance ratings, respectively, the null hypothesis, µμ! = µμ!, was tested at the 95% confidence level which gave a critical region of < -1.960 and > 1.960 . The value ofwas calculated to be 0.794 which does not lie in the critical region. Therefore the null hypothesis was not rejected and it was concluded that there is no significant difference between the two means.
The statistical analysis carried out in the previous section was based on two means and variances. In this section a different statistical analysis was carried out using the average model deficiency ratios and the average performance rating deficiency ratios obtained for each of the 15 organisations in the sample.As the sample size was small (n=15) and the data was subjective in nature, it was appropriate to use a nonparametric analysis. The sign test was used to test the null hypothesis µμ! = µμ! against the alternative µμ! ≠ µμ!
where µμ! is the mean of the individual management deficiency ratios obtained from the heuristic model and µμ!
is the mean of the deficiency ratios obtained from the performance ratings. For a critical region R < 4 corresponding to a 96% confidence level, the value of r obtained was 7 which is not in the critical region.
Therefore the null hypothesis was not rejected and it was concluded that there is no significant difference between the two means. This finding was derived from a random sample of 15 NPAs which is considered to be an adequate sample size for the non-parametric analysis carried out.
The results of the two statistical analyses carried out demonstrate that there is an alignment of the results produced by the heuristic model and the results derived from the individual performance ratings which effectively validates the results produced by the model. Therefore, it can be claimed, with a high level of confidence, that the heuristic model does produce reliable results.
The refinements made to the heuristic model and the information collected from the sample of board members made it possible to refine the estimate of survey response bias to produce more reliable results. This refinement followed a different technique to that used for the initial estimate. It was assumed that responses to the questions measuring age and management experience, which are objective in nature, would be free of the main sources of bias and that the level of response bias was uniform across the remaining four factors. It was again assumed that the population of individual deficiency measurements has a mean of 50% or 0.5. The equation for measuring individual management deficiency, with the response bias term removed, was previously estimated to be:
d = 0.286 f! + 0.238 f! + 0.167 f! + 0.167 f! + 0.071 f! + 0.071 f!
where d = individual management deficiency f! = commitment factor
f! = skills factor
f! = experience factor f! = age factor
f! = knowledge factor f! = resistance to change factor
and 0 ≤ f! ≤ 1 for i = 1,2, … 5
A bias variable, x, was added to the skills, knowledge, commitment and resistance to change factors to give the equation shown below:
d = 0.286(f! + x) + 0.238 f! + 0.167 f! + x + 0.167 f! + x + 0.071(f! + x )+0.071f!
The sample provided 50 assessments of management deficiency in each of the six factors from which the average deficiency measurement was calculated. These averages were substituted into the equation above with d = 0.5 and the resulting equation was solved to give x = 0.239 which is the estimate of the average level of response bias across the four factors: skills, knowledge, commitment and resistance to change. This value was substituted back into the equation:
d = 0.286(f! + x) + 0.238 f! + 0.167 f! + x + 0.167 f! + x + 0.071(f! + x ) + 0.071f!to give:
d = 0.165 + 0.286 f! + 0.238 f! + 0.167 f! + 0.167 f! + 0.071 f! + 0.071 f!
The above equation, which defines the relationship between individual management deficiency and the primary factors, is the main component of the heuristic model. The constant term, 0.165, represents the revised estimate of average survey response bias.
Findings
Thorough testing and validating of the results obtained have established that the heuristic model developed in this study does produce an acceptable, approximate solution to the measurement of management deficiency in NPOs run entirely by volunteers. A summary of the results produced by the model for an NPO board is provided in Table 2.
From the detailed assessment of individual management strengths and weaknesses produced by the model for the sample of 50 board members, a general profile of the board of volunteer-only NPOs emerged. The findings indicate that the competencies required to manage the affairs of the organisation are concentrated in one or two board members. The evidence suggests that, within an NPO board, some members have a high level of management deficiency but this weakness is compensated for by one or two competent individuals serving on that board who have a low level of management deficiency. A key finding of this study is that management experience and relevant knowledge had a relatively low level of deficiency which makes experience and knowledge a strength of volunteer-only board members. The evidence suggests that, in general, the experience gained from years of serving on the board, combined with the accumulated knowledge of the organisation’s norms and management processes, forms the means by which the organisation is governed.
The results have provided evidence that the most important competencies for a board member to possess are management skills, management experience and relevant knowledge. Deficiency in each of these factors has a strong, positive correlation (r = 0.8) with management deficiency. The implication of this finding is that deficiency in these areas of competency would have a significant impact on the management performance of the individual and the board as a whole. It was also found that commitment to the association (r = 0.6), financial analysis skills (r = 0.4) and social skills (r = 0.4) are directly related to management performance. A moderate level of correlation was found to exist between deficiency in each of these factors and individual management deficiency. Another important finding was that a positive association exists between age and nonprofit management performance (r = 0.4) with the level of individual management deficiency increasing as age increases beyond 65 years.
Conclusions
The heuristic model produced an acceptable, approximate solution to the measurement of individual
management deficiency in NPO board members.
The main competencies an NPO board member should possess are: management skills, management
experience, relevant knowledge and commitment to the organisation. Deficiency in any of these factors
will have a direct effect on individual and board management deficiency.
There is a positive relationship between age and management performance with the level of individual
management deficiency increasing as age increases beyond 65 years.
In general, the experience gained from years of serving on the board, combined with the accumulated
knowledge of the organisation’s norms and management processes, forms the means by which the
organisation is managed.
References
Alexander, J. A., Hearld, L. R. and Mittler, J. (2011). Measuring Leadership in Multi-sector Healthcare
Alliances. Nonprofit Management and Leadership, 21( 4), 341-361.
Allen, N.J. and Meyer, J. P. (1996). The Measurement and Antecedents of Affective, Continuance and
Normative Commitment to the Organisation. Journal of Occupational Psychology, 63, 1-18.
Bagnoli, l. and Megali, C. (2011). Measuring Performance in Social Enterprises. Nonprofit and Voluntary
Sector Quarterly, 40(1), 149-165.
Barnard, H. and Lesirge, R. (2012). Measuring Board Effectiveness. The Guardian, UK, 9th Nov., 2012.
Bhardwaj, S. and Vuyyuri, S. (2005). Analysis of Board Effectiveness in Non-profit Organisations in India.
Journal of Social Science, 10(1), 29-36.
Block, S. R. (2004). Why Nonprofits Fail: Overcoming Founders Syndrome, Fund Phobia and Other
Obstacles to Success. Google Books.
Brown, W. A. (2005). Exploring the Association between Board and Organisational Performance in
Nonprofit Organisations. Nonprofit Management and Leadership, 15(3), 317-339.
Brown, W. A. (2007). Board Development Practices and Competent Board Members: Implications for
Performance. Nonprofit Management and Leadership, 17(3), 301-317.
Brown, W. A. and Iverson, J. D. (2004). Exploring Strategy and Board Structure in Nonprofit Organisations.
Nonprofit and Voluntary Sector Quarterly, 33(3), 377-400.
Cornforth, C. (2001). What Makes Boards Effective? An Examination of the Relationships between Board Inputs, Structures, Processes and Effectiveness in Non-profit Organisations. Corporate Governance: an International Review, 9(3), 217-227.
Cornforth, C. (2012). Non-profit Governance Research: Limitations of the Focus on Boards and Suggestions
for New Directions. Nonprofit and Voluntary Sector Quarterly, 41(6), 1116 -1135.
Doherty, A. and Hoye, R. (2011). Role Ambiguity and Volunteer Board Member Performance in Nonprofit
Sports Organisations. Nonprofit Management and Leadership, 22(1), 107-128.
Epstein, M. J. and McFarlan, F. W. (2011). Measuring the Efficiency and Effectiveness of Nonprofits’
Performance. Strategic Finance, October, 2011, 27-34.
Forbes, D. P. (1998). Measuring the Unmeasurable: Empirical Studies of Nonprofit Organisational
Effectiveness from 1977 to 1997. Nonprofit and Voluntary Sector Quarterly, 27(2), 183-202.
Gilli, M. and Schumann, E. (2012). Heuristic Optimisation in Financial Modelling. Annals of Operations
Research, 193, 129-159.
Glisky, E .L. (2007). Changes in Cognitive Functions in Human Aging. Brain Aging Models, Methods and
Mechanisms. Riddle, D. R. Editor.
Green, J. C. and Griesinger, D. W. (1996). Board Performance and Organisational Effectiveness in
Nonprofit Social Service Organisations. Nonprofit Management and Leadership, 6(4), 381-402.
Griesmann, D. (2012) Don Griesmann’s Nonprofit Blog, May, 2012.
www.dongriesmannnonprofitblog.blogspot.com.au.
Harrison, J. and Sexton, c. (2004). The Paradox of the Not-for-profit Hospital. Health Care Manager, 23(3),
192-204.
Heiberg, D. and Bruno-van Vijfeijken, T. (2009). Which Measurement Matters. Monday Developments,
27(9), 26-27.
Herman, R. D. (1990). Methodological Issues in Studying the Effectiveness of Nongovernmental and
Nonprofit Organisations. Nonprofit and Voluntary Sector Quarterly, 19(3), 293 - 306.
Herman, R. D. and Renz, D. O. (2002). Nonprofit Organisational Effectiveness: Practical Implications of Research on an Elusive Concept. Issued by the Midwest Centre for Nonprofit Leadership, University of Missouri-Kansas City.
Holland, T. P., Chait, R. P., and Taylor, B. E. (1989). Board Effectiveness: Identifying and Measuring
Trustee Competencies. Research in Higher Education, 30(4), 435-453.
Jackson, D. K. and Holland, T. P. (1998). Measuring the Effectiveness of Nonprofit Boards. Nonprofit and
Voluntary Sector Quarterly, 27(2), 159 - 182.
Jewell, J. (2013). 7 Reasons Nonprofits Flounder or Fail. NPoutlook, April 3, 2013.
www.valcort.com/category/blog/non-profit-blog.
Kirkpatrick, S., Gelatt, C. D. and Vecchi, M. P. (1983). Optimisation by Simulated Annealing. Science,
220(4598), 671-680.
Langabeer, J. R. and Galeener, C. A. (2007). Measuring Board Activity in Governance of Not-for-profit
Healthcare. Texas Public Health Association Journal, 60(1), 22-25.
McDonagh, K. J. (2006). Hospital Governing Boards: A Study of Their Effectiveness in Relation to
Organisational Performance. Journal of Healthcare Management, 51(6), 377-389.
Moxham, C. (2010). Help or Hindrance? Examining the Role of Performance Measurement in UK Nonprofit
Organisations. Public Performance & Management Review, 33(3), 342-354.
Mwenja, D. and Lewis, A. (2009). Exploring the Impact of the Board of Directors on the Performance of
Not-for-profit Organisations. Business Strategy Series, 10(6), 359-365.
Nafukho, F. M. (2009). HRD’s Role in Identifying, Measuring and Managing Knowledge Assets in the
Intangible Economy. Advances in Developing Human Resources, 11(3), 399-410.
Nicholson, G., Newton, C. and McGregor-Lowndes, M. (2012). The Nonprofit Board as a Team. Non-profit
Management and Leadership, 22(4), 461-481.
Nooriafshar, M and Vibert, C. (2012). Perceptions of Success in a Nascent Wine Industry. Paper 10, Regional Development Conference, University of Southern Queensland, Australian Centre for Business Sustainability and Development.
Ostrower, F. and Stone, M. M. (2010). Moving Governance Research Forward: A Contingency-Based
Framework and Data Application. Nonprofit and Voluntary Sector Quarterly, 39(5), 901-924.
Paulhus, D. L. (1991). Measurement and Control of Response Bias. Measures of Personality and Social
Psychological Attitudes, San Diego, CA: Academic Press, Inc. 17-59.
Preston, J. B. and Brown, W. A. (2004). Commitment and Performance of Nonprofit Board Members.
Nonprofit Management and Leadership, 15(2), 221 - 238.
Productivity Commission, (2010). Contribution of the Not-for-Profit Sector, Research Report. Canberra.
Satoglu, S. I., Durmusoglu, M. B. and Ertay, T. (2010). A Mathematical Model and a Heuristic Approach for Design of the Hybrid Manufacturing Systems to Facilitate One-piece Flow. International Journal of Production Research, 48(17), 5195-5220.
Sawhill, J. C. and Williamson, D. (2001). Mission Impossible? Measuring Success in Nonprofit
Organisations. Nonprofit Management and Leadership, 11(3), 371-386.
Schjoedt, L. and Kraus, S. (2009). Entrepreneurial Teams: Definition and Performance Factors. Management
Research News, 32(6), 513-524.
Taysir, E. A. and Taysir, N. K. (2012). Measuring Effectiveness in Nonprofit Organisations: An Integration
Effort. Journal of Transnational Management, 17, 220-235.
Templemeier, H. and Buschkuhl, L. (2009). A Heuristic for Dynamic Multi-level Capacitated Lotsizing Problem with Linked Lotsizes for General Product Structures. Operations Research Spectrum, 31, 385-404.
Thach, E. and Thompson, K. J. (2007). Trading Places: Examining Leadership Competencies between For-profit Vs Public and Non-profit Leaders. Leadership and Organisational Development Journal, 28(4), 356-375.
Tucker, B. P. (2010). Through Which Lens? Contingency and Institutional Approaches to Conceptualising Organisational Performance in the Not-for-profit Sector. Journal of Applied Management Accounting Research, 8(1), 17-33.
Tucker, B. P. and Parker, L. D. (2013). Out of Control? Strategy in the Not-for-profit Sector: The Implications for Management Control. Accounting, Auditing & Accountability Journal, 26(2), 234-266.
Widmer, C. (1993). Role Conflict, Role Ambiguity and Role Overload on Boards of Directors of Nonprofit
Human Service Organisations. Nonprofit and Voluntary Sector Quarterly, 22(4), 339 - 356.
Willems, J., Huybrechts, G., Jegers, M., Weijters, B. Vantibborgh, T. Didee, J. and Pepermans, R. (2012). Non-profit Governance Quality: Concept and Measurement. Journal of Social Science Research, 38(4), 561-578.
Copyright information

This work is licensed under a Creative Commons Attribution-NonCommercial-NoDerivatives 4.0 International License.
About this article
Publication Date
06 January 2015
Article Doi
eBook ISBN
978-1-80296-001-3
Publisher
Future Academy
Volume
2
Print ISBN (optional)
-
Edition Number
1st Edition
Pages
1-218
Subjects
Educational psychology, education, psychology, social psychology, group psychology, collective psychology
Cite this article as:
Hunt, L., Nooriafshar, M., & Krishnamurtia, C. (2015). Measuring Deficiencies in Nonprofit Management. In Z. Bekirogullari, & M. Y. Minas (Eds.), Cognitive - Social, and Behavioural Sciences – icCSBs 2015 January, vol 2. European Proceedings of Social and Behavioural Sciences (pp. 15-27). Future Academy. https://doi.org/10.15405/epsbs.2015.01.4