
Children and Youth: Inclusive-Factors in the Provision of Recreational Facilities in Nigeria

Abstract
The adage “All work and no play make Jack a dull boy” implies the need for recreation; hence, the emphasis on the provision of recreational facilities for especially the children and youth. This paper provides an assessment of the provision of recreational facilities and participation in the activity among children and youth in Greater Jos. Plateau State, Nigeria. The study employed a mixed-method integrated data analysis, namely remote sensing and Geographic Positioning System that determined the places of recreation. The paper examined the concept and policy as it affects the provision of recreational facilities and found out that the challenges range from distance to recreational areas, inappropriate facilities, and being grossly inadequate. It further discusses the absence of the facilities in the sectors other than the core-city. To mitigate the problems mentioned above, suggestions proffered include the need for the provision of recreational facilities, to achieve equity, appropriateness, and adequacy. There should be the need to implement the policies with regards to the provision of neighbourhood facilities, SDGs Goals 3, and 11 that promote healthy lives. Hence, the wellbeing of children and youth, and the settlements inclusive that enhances safety and resilience.
Keywords: Recreational facilities, provision, inclusiveness, children and youth, greater Jos Plateau State, Nigeria
Introduction
The essence of play is to contribute to the development of the intelligence and health of an individual, to give satisfaction, the identity of personality, growth in greatness, develops creativity, mental capacity, physiological aptness, socialisation and managing attitude (Meeras, 2010). In recent times, considering the world experience of the high development of sophisticated information technology and modern communication devices is said to impact significantly on the adolescent, for instance, the smartphones, tablets, and a variety of devices (Adli & Wirdati, 2017). Youth, being an active age, refers to the group of persons between the ages of 15 to 24 years old. This age bracket is the most that engages much time in outdoor recreational activities (Omar, Omar, Kamaludin, Othman, &, Yusoff, 2017). Findings from the Canadians show that 75% opted that parks and gardens help children and youth lead a healthy lifestyle. While 77% say, participation in recreational activity reduces crime significantly (Town & Blackfalds, 2016).
There is no effect in any way with regards to change in the physical environment that engages people of the community for an activity, but, the provision of the necessary facilities (Pawlowski, Andersen, Troelsen, & Schipperijn, 2016). Also, visitation to outdoor recreational facilities influenced by accessibility (Yu, Che, Xie, & Tian, 2018). Therefore, the provision of recreational facilities, as suggested includes threshold, satisfaction, accessibility, and proper management of the existing recreational facilities. These factors could be said to influence youth-driven force to visit recreational facilities (Omar et al., 2017). To be accessible to the recreational activity area is not necessarily related to distance and proximity, rather the availability that motivates, hence easy reach to the facility (Andkjær & Arvidsen, 2015).
There is an immense concern on the environment with regards to space for development, facilities therein, as well as management capacity which serves as components that boost recreational activity and participation. For effective planning for the provision and engagement, it requires the public and stakeholder involvement most especially as it affects children and youth (Town & Blackfalds, 2016). This paper intends to determine the participation in recreational activities, focusing on children and youth who according to most literature, are the most active age group that engages in outdoor recreation. This aimed at considering the children and youth as an inclusive factor when it comes to the provision of outdoor recreational activities.
Recreation and policies
The provision of sports and other recreation facilities are, to a great extent, provide places where children actively participate in recreation. The understanding of these relationships is eminent in research, policy development, and planning process (Harrington, Jarvis, & Manson, 2017; Draper, Basset, Villiers, De, Lambert, & Group, 2014). The government in most countries of the world is responsible for the provision and maintenance of public facilities. Though, in a few cases, the individuals or organisations find it necessary to carry out a continual assessment of the demand and provision of the facilities (Das & Pandit, 2016).
To consider the recent reports on youths' lukewarm attitudes to outdoor recreation in the 21st century, regarding Colombia. The Physical Activity rate is low, while the sedentary behaviours are high on the side of children and youth. This attitude influences the development and assessment of the availability and accessibility of recreational facilities in schools (González et al., 2014). Since physical activity among, suggested that promoting physical activities among youth also influences health, where most of the factors are modifiable factors, it is necessary to deal with these identified factors (Zulkia, Zainol, Zainol, & Nordin, 2014).
The provision of a recreational facility and its availability has expressed positively with youth physical activity levels. The provision of the facilities affects the social environment, which attracts adolescents to such facilities. It connotes that public facilities are more focus on increasing physical activities through facility used in this age category (Ries, Yan, & Voorhees, 2011). Gilliland, Holmes, Irwin, and Tucker (2006a), suggested that there should be a sensitisation towards producing proactive measures by planners, and health policy analysts to promoting physical activities among children and youth. The distribution of recreational facilities within the environment should be paramount as well as, the new and proposed public-funded recreation spaces in neighbourhoods with a deficiency in provision. The disadvantaged or underserved areas of cities seem to have fewer facilities and public open space, which connotes less access to playgrounds and recreational opportunities (Rigolon & Flohr, 2014).
The objectives and strategies to achieve policy are issues that need to identify and dealt with in present-day cities. It aimed at reviewing the provision of the existing facility services in each urban area, mainly the metropolitan centres, to detect deficiencies, gap, and inadequacies. While the strategy ensures that spaces for services are provided in cities and conserved among competing land uses. The principles are, therefore observed in conformity to policies and involvement of the private sector in the provision of facilities (Tari, Brown, & Chikagbum, 2015). Hence, to enhance the development of physical activity among children and youth, the city administrators must take into consideration the geographical distribution of recreational activity areas. Thereby, make the provision of the facilities to neighbourhoods with deficiencies (Gilliland, Holmes, Irwin, & Tucker, 2006b). Recreational activity in children and youth is part of their wellbeing, the basis of attachment to social life and nature. The perception which, is connected to having an easy reach to recreational facilities that deal with social inequalities (Amerijckx & Humblet, 2015).
Problem Statement
The concern of this research is towards bringing up an existing knowledge on the state of recreational facilities in Greater Jos, considering its provision with regards to accessibility and appropriateness. The recreation challenges relate to the ineffective coverage of services to the targeted area and population. The distribution of the recreational facility in most cases not evenly distributed, the concentration or allocation are mostly done politically or by privately establishments for profit-making. The failure to consider the policy of provision to easy reach in neighbourhoods or district is always a concern (City of Laguna, 2009).
The poor utilization of the services provided to the populace becomes a thing of concern when it comes to the provision and distribution of the recreational facility. Since the facility is geared toward filling in leisure, when poorly located, children and youth do not get to be informed about them. (Muiga & Rukwaro, 2017).
Research Questions
To achieve the purpose of this research the following questions were developed;
- How do the spatial relationship of the level of accessibility to recreational facilities varies in the Greater Jos?
- How adequate and appropriate is the provision of recreational activities in the Greater Jos?
Purpose of the Study
The purpose of this research is to bring up an existing knowledge on the state of recreational facilities in Greater Jos, considering its provision with regards to accessibility, appropriateness and being adequate. The provision of recreational facility areas with emphasis to accessibility are gradually recognised in urban policies. Therefore, the need for required information and seemingly indicators that can be used for variants in the distribution of the facility within a given city and groups with focus on children and youth.
Despite the provision of recreational facility, they are not sufficient due to lopsided distribution towards specific locations and hence, social groups (Texier, Schiel, & Caruso, 2018). The provision will, therefore, fail to achieve equity, appropriateness, and adequacy in enhancing recreational activity among children and youth.
Research Methods
This study employed a mixed-method approach being qualitative and quantitative. The data was collected in 2 stages, namely; Inventory survey and mapping, and questionnaire survey. Information was collected and captured in an inventory form, which was used for the Geometrical Data Analysis, using point mode.
The method represents an integrated qualitative analysis employing the remote sensing and Geographic Positioning System tools. The process determines the place of recreation, and by observation, the type of activity. Hence, the devices were used to identify, mapped out, and determine the accessibility/ reachability to the various recreational activity areas. Maps were produced, updated, and extensively used for data analysis.
The maps were produced through remote sensing, using Geographic Information System to geo-reference and digitalize the identified objects to reflect the actual positions on the ground. The tools were effectively used to generate the required maps and presented through the Geometric data and point mode. The maps include;
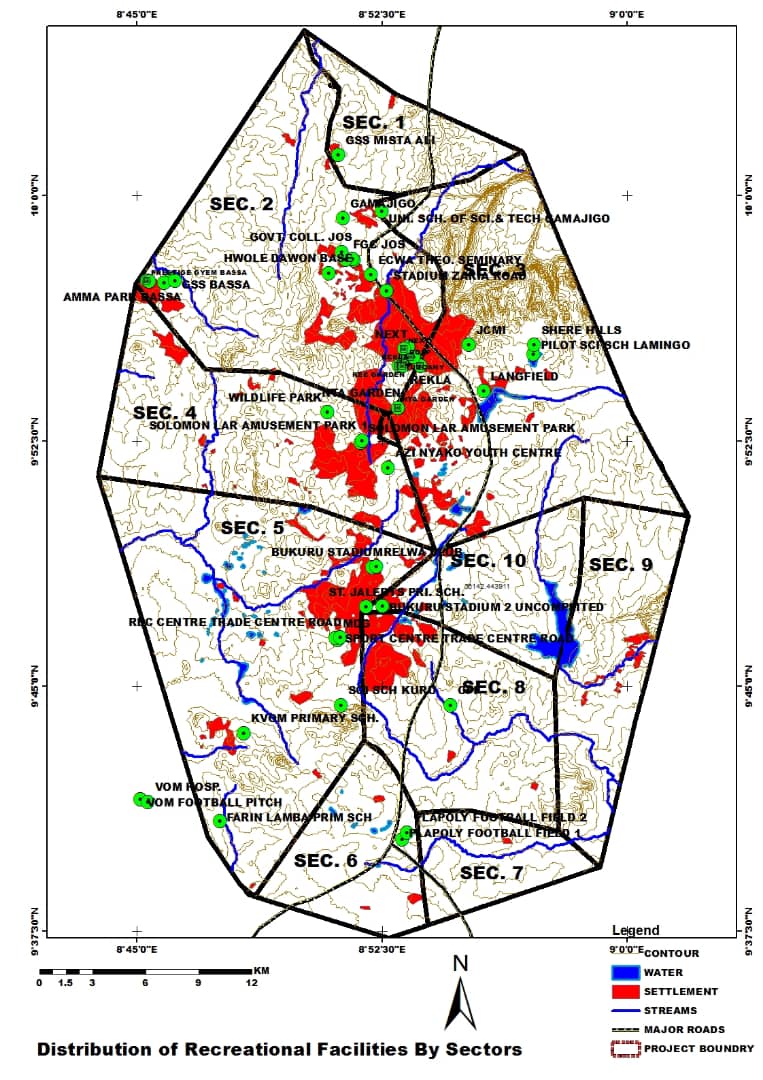
- Distribution of Recreational facilities by sectors (Figure 1) in linear scale 1:1.5km
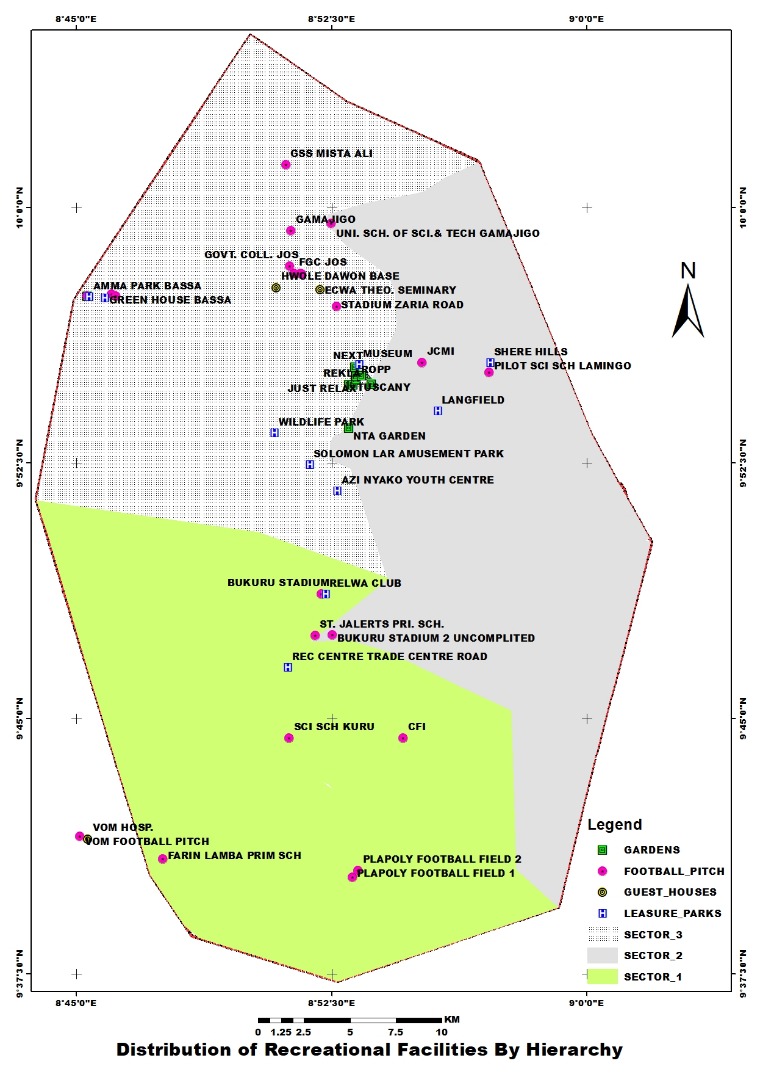
- Spatial Distribution of Recreational facilities by Hierarchy/Types (Figure 2) in linear scale 1:1.5km
In the second stage, a survey conducted in the Greater Jos, between February and March 2019 using a questionnaire form. The questionnaires were administered within the ten (10) sectors as defined in the Greater Jos Master Plan (2008-2025). The target respondents were estimated to 1,500,000 million, a sample size of 450, while the response rate for valid questionnaires was 400. Data stored in SPSS version24, where descriptive analysis techniques use and presented the results in a table for easy manipulation and interpretation.
The map was able to show the spread of the superimposed recreational area facility within the study area and the types which depict the existing situation with regards to the development of recreational facilities. It complements the effort of the information from the survey that expresses participation in engaging in the available category of facilities, as shown in the maps. Hence, assessing the adequacy by determining the adequately served and unserved.
It is worthy to note that the indicators are basically, the spatial distribution, distance to recreational are and adequacy. The measurements for distribution and distance are presented in maps and interpreted. While the questionnaires measured the adequacy by analysing the opinion of the residents, as shown in tables.
Findings
As shown in Figure 1, the spatial distribution of the recreational facilities and areas where most of the recreational activities within the developed areas takes place. The area is experiencing uneven development as a result of the distribution of outdoor recreational facilities.
The core city has the advantage of having more facilities, while, having scanty and lacking at the outskirt. The available facilities within the core-city are of different activities, and the facilities superimposed as presented in map Figure 2; describe as gardens, Football pitches, Guesthouses/ clubs, and leisure parks.
This information intends to give a background to the spread of the facilities within the study area where children and youth relationship to recreational opportunities are determined and encouraging the usage.
Children and youth are class of age structure, and as well as an active age to reckon with in the usage of recreational facilities. Therefore, their level of influence is determined by a survey that residents' views and opinions regarding the provision of outdoor recreational facilities deduced. A total of 400 resident members in the ten sectors, randomly, ages from 15 and above, both male and female responded to a prepared questionnaire.
The questionnaires distributed to each of the sectors according to population density, the higher density having more cascading to the lowest.
The result of Table 1 intended to reveal the participation of youth in recreational activities. The result showed that 39.3% moderately engage in recreational activities. While those that participate very severely and severe constituted 29.8% and 16.8% respectively, the implication here is that 85.4% indicated that youth engage in outdoor recreation. The result connotes the available facilities, as shown in Figure 2, which further attests to a greater extent that there is high usage of the available recreational facilities. Concerning the results, the higher percentage of respondents are from areas that have more of the facilities, reference to sectors 2 (6.8%), 3 (9.0), and 4 (7.0%).
The result of Table 2 intended to reveal the participation of children in recreational activities. The result showed that 50.0% moderately engage in recreational activities, while, those that participate very severely, and severe constituted 23.3% and 21.0% respectively. The implication here is that 94.3% indicated the youth engage in outdoor recreation; this shows that there is higher usage of the available recreational facilities. Considering the results, it reveals that the higher percentage of the respondents are from areas that have more of the facilities to the areas experiencing low, referring to sectors 2 (10.0%), 3 (10.0) and 4 (7.0%).
The result of Table 3 reveals the residents' assessment of the availability of the outdoor recreational facility for the children. The result showed that 37.0% of the respondents somewhat agreed that the children were underserved, while 27.5% believed that the facilities moderate. Though, in comparison to the whole response, those that strongly agreed and agreed were 7.5% and 15.5% respectively, bringing the total to 59.0% which implies that the available facilities for the children in the study area are inadequate in provision. At this point, it shows clearly that the higher percentage of the respondents are from the core-city where they stand a chance to assess the adequacy of the facilities, particularly sectors 2 and 3.
The results show that those that disagreed have been underserved in sectors 2 (8.0%) and 3 (disagreed 4.8% and strongly disagreed 4.8%) have the highest. It then confirms the inappropriateness available recreational facilities for children in the core-city.
The result of Table 4 is intended to assess the adequacy of the outdoor recreational facility for the youth. The result shows that 47.8% somewhat agreed that the available facilities are underserved. While those that strongly agreed and agreed were 10.8% and 14.8% respectively, this sum to the total to 73.4% which infer that the provision of recreational facilities is not adequate but underserved.
The result of Table 5 assessed the average distance to an outdoor recreational facility. It shows that 46.5% agreed that the distance to recreational facilities is not as enshrined in the policy and standard of providing services in each neighbourhood and within walking distance. Those that strongly agreed and somewhat agreed were 16.3% and 21.8% respectively, which summed up to 84.6% depicting those recreational facilities not easy reach from homes.
The facilities were provided along the core-city axis (Figure 2), rendering the outskirts at a disadvantage in terms of equity in distribution, which affects accessibility. There should be sufficient facilities sporting or passive, for maximum use. To uphold the policy of providing services in neighbourhoods, depending on the complexity of the category of the facility. The location should seem to create interest to attract the high participation of the youth. The high percentage of response confirms the shortage and spacious in distribution according to figure1tribution of the recreational facilities in Greater Jos, which to an extent affected the youth.
Conclusion
Considering the results of the analysis, it implies that the available facilities are not of desirable distance, because people cover quite a distance journey to the available facility. Compared to policy and standard of providing recreational facilities in each neighbourhood and within walking distance is faulty. Thus, considering the complexity of the category of the facility, the location should be seen to create interest by attracting high participation among children and youth. Figure 1 and 2 confirms the shortage and spacious distribution of the recreational facilities in Greater Jos. The statutory body that regulates and enforces the law, for the establishment or issuing license for the provision and operating the services should be encouraged. Considering making provisions of the facilities available for the children and youth, since they are more of the active age in participating in outdoor recreation. Recommendations with regards to spatial distribution strategy that would be appropriate to enhance accessibility and effectiveness towards improving the facilities for the children and youth should be the fulfilling task. Such as adequate provision to all sectors and neighbourhoods to deal with the unserved and harnessing potential areas for recreation according to different age groups of children, youth and adults as well to avoid crowdedness of children and youth facility. The recommendations will, to a greater extent, improve the mental and physical wellbeing of the people of Greater Jos and most importantly minimizes youth indulging in vices of all sorts.
Acknowledgments
The authors would like to extend their appreciation to Universiti Sains Malaysia for granting the USM Short Term Grant [Grant No. 304/PPBGN/6315164] that made this study and paper possible.
References
Adli, M. S., & Wirdati, M. R. (2017). A Study of Motivation in Outdoor Recreational Activities, 7(3).
Amerijckx, G., & Humblet, P. (2015). Uses and perceived benefits of children’s recreational activities: the perspectives of parents and school professionals. International Journal of Child Care and Education Policy, 9(1).
Andkjær, S., & Arvidsen, J. (2015). Places for active outdoor recreation – a scoping review. Journal of Outdoor Recreation and Tourism, 12, 25–46.
City of Laguna. (2009). Recreation Facilities Needs Assessment.
Das, S., & Pandit, D. (2016). Qualitative assessment of public facilities: the “public bus.” The TQM Journal, 28(2), 275–294.
Draper, C., Basset, S., Villiers, A., De Lambert, E. V., & Group, W. (2014). Results From South Africa ’ s 2014 Report Card on Physical Activity for Children and Youth, 11(Supp 1), 98–104.
Gilliland, J., Holmes, M., Irwin, J. D., & Tucker, P. (2006a). Environmental Equity Is Child ’ s Play : Mapping Public Provision of Recreation Opportunities in Urban Neighbourhoods Environmental equity is child ’ s play : mapping public provision of recreation opportunities in urban, (March 2014).
Gilliland, J., Holmes, M., Irwin, J. D., & Tucker, P. (2006b). Environmental Equity Is Child ’ s Play : Mapping Public Provision of Recreation Opportunities in Urban Neighbourhoods Environmental equity is child ’ s play : mapping public provision of recreation opportunities in urban, (October).
González, S. A., Sarmiento, O. L., Cohen, D. D., Camargo, D. M., Correa, J. E., Páez, D. C., & Ramírez-vélez, R. (2014). Results From Colombia ’ s 2014 Report Card on Physical Activity for Children and Youth, 11(Supp 1), 33–44.
Harrington, D. W., Jarvis, J. W., & Manson, H. (2017). Parents’ perceived barriers to accessing sports and recreation facilities in Ontario, Canada: Exploring the relationships between income, neighbourhood deprivation, and community. International Journal of Environmental Research and Public Health, 14(10).
Meeras, L. (2010). Leisure and Recreation. History, 65(213), 52–57.
Muiga, J., & Rukwaro, R. (2017). Satisfaction among Residents over Recreation Facilities : A Case of Kasarani Neighbourhood in Nairobi City, 22(2), 70–84.
Omar, D., Omar, K. A., Kamaludin, Z., Othman, S., & Yusoff, Z. M. (2017). Recreational Facilities For Youth In Malaysian Urban Areas. Case Studies: Lembah Pantai, Kuala Lumpur And Kota Kinabalu, Sabah. Planning Malaysia Journal, 15(2).
Pawlowski, C. S., Andersen, H. B., Troelsen, J., & Schipperijn, J. (2016). Children’s physical activity behavior during school recess: A pilot study using GPS, accelerometer, participant observation, and go-along interview. PLoS ONE, 11(2), 1–18.
Ries, A. V., Yan, A. F., & Voorhees, C. C. (2011). The Neighborhood Recreational Environment and Physical Activity Among Urban Youth : An Examination of Public and Private Recreational Facilities, 640–649.
Rigolon, A., & Flohr, T. L. (2014). Access to Parks for Youth as an Environmental Justice Issue: Access Inequalities and Possible Solutions, 69–94.
Tari, E., Brown, I., & Chikagbum, W. (2015). Assessment Of The Location And Availability Of Public Facilities And Services In Port Harcourt Metropolis In Rivers State , Nigeria, 4(06).
Texier, M., Le Schiel, K., & Caruso, G. (2018). The provision of urban green space and its accessibility: Spatial data effects in Brussels. PLoS ONE, 13(10), 1–17. https://doi.org/10.1371/journal.pone.0204684Town, T. H. E., & Blackfalds, O. F. (2016). THE TOWN OF BLACKFALDS, Recreation, Culture, and Parks Needs Assessment and Master Plan. Retrieved from https://www.blackfalds.com/public/download/documents/16451
Town, T. H. E., & Blackfalds, O. F. (2016). THE TOWN OF BLACKFALDS Recreation, Culture, and Parks Needs Assessment and Master Plan. Retrieved from https://www.blackfalds.com/public/download/documents/16451
Yu, B., Che, S., Xie, C., & Tian, S. (2018). Understanding Shanghai residents’ perception of leisure impact and experience satisfaction of urban community parks: An integrated and IPA method. Sustainability (Switzerland), 10(4).
Zulkia, D. R., Zainol, R., Zainol, N., & Nordin, N. A. (2014). Factors Determining Youth ’ s Recreational Behaviour and its Effects on Body Mass Index ( BMI ), 5(2), 1–11.
Copyright information

This work is licensed under a Creative Commons Attribution-NonCommercial-NoDerivatives 4.0 International License.
About this article
Publication Date
26 December 2017
Article Doi
eBook ISBN
978-1-80296-950-4
Publisher
Future Academy
Volume
2
Print ISBN (optional)
-
Edition Number
1st Edition
Pages
1-882
Subjects
Technology, smart cities, digital construction, industrial revolution 4.0, wellbeing & social resilience, economic resilience, environmental resilience
Cite this article as:
Isa, M. I., Mohamed, B., Omar*, S. I., & Wash, P. M. (2017). Children and Youth: Inclusive-Factors in the Provision of Recreational Facilities in Nigeria. In P. A. J. Wahid, P. I. D. A. Aziz Abdul Samad, P. D. S. Sheikh Ahmad, & A. P. D. P. Pujinda (Eds.), Carving The Future Built Environment: Environmental, Economic And Social Resilience, vol 2. European Proceedings of Multidisciplinary Sciences (pp. 708-718). Future Academy. https://doi.org/10.15405/epms.2019.12.71